Cities with the Highest Percentage of Population with a Degree in Visual and Performing Arts in Mississippi
RELATED REPORTS & OPTIONS
Visual and Performing Arts
Mississippi
Compare Cities
Map of Cities with the Highest Percentage of Population with a Degree in Visual and Performing Arts in Mississippi
0.0%
50.0%
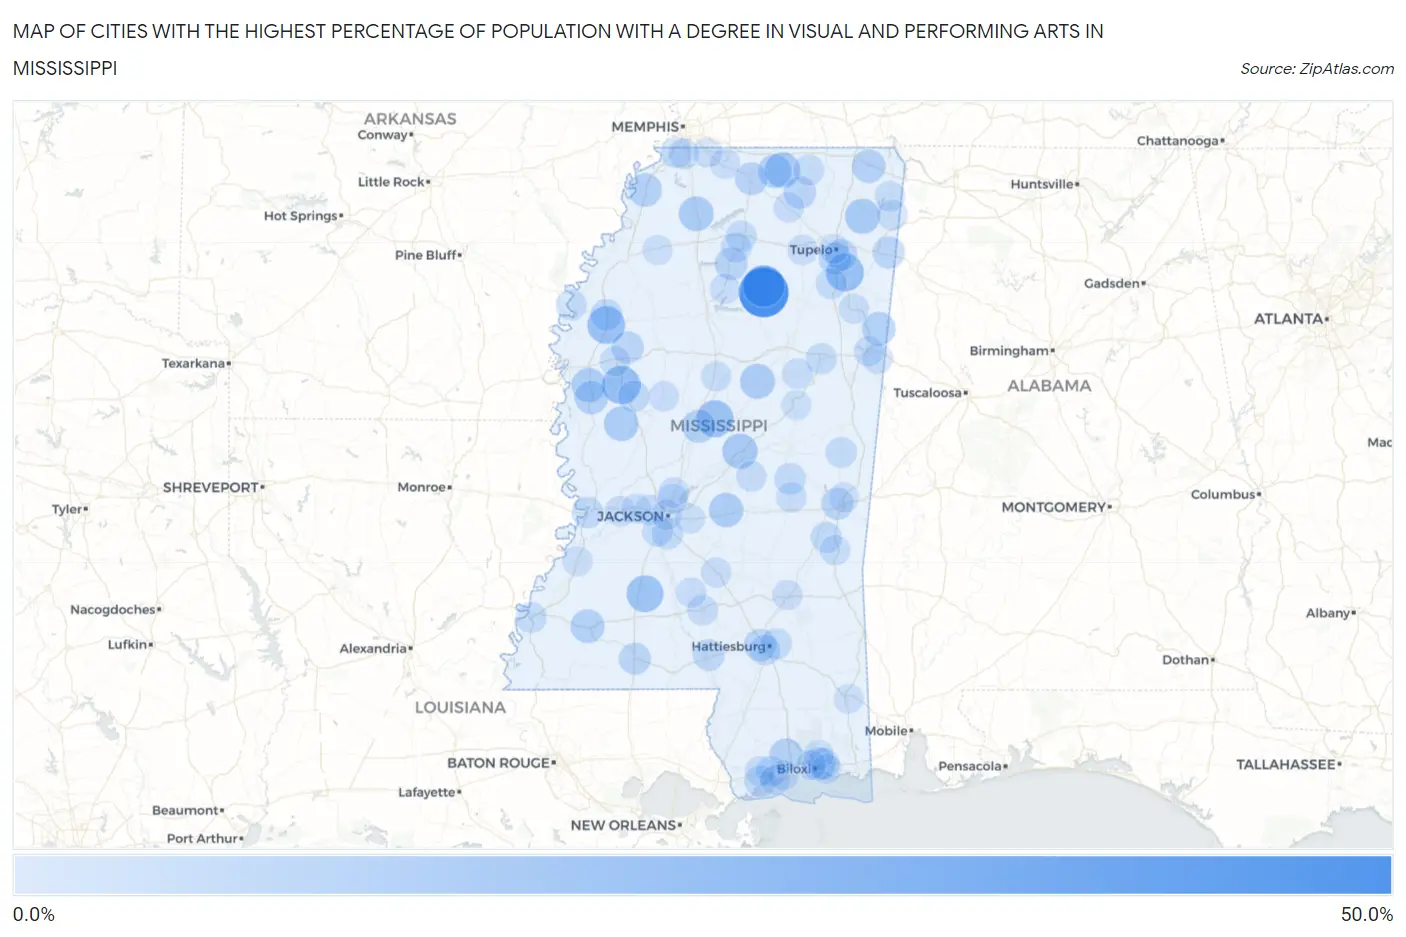
Cities with the Highest Percentage of Population with a Degree in Visual and Performing Arts in Mississippi
| City | % Graduates | vs State | vs National | |
| 1. | Pittsboro | 47.6% | 2.4%(+45.2)#1 | 4.3%(+43.4)#139 |
| 2. | Arkabutla | 32.4% | 2.4%(+30.1)#2 | 4.3%(+28.2)#278 |
| 3. | Bruce | 28.9% | 2.4%(+26.5)#3 | 4.3%(+24.7)#332 |
| 4. | Isola | 21.0% | 2.4%(+18.6)#4 | 4.3%(+16.7)#576 |
| 5. | Boyle | 19.7% | 2.4%(+17.3)#5 | 4.3%(+15.5)#657 |
| 6. | Nettleton | 19.7% | 2.4%(+17.3)#6 | 4.3%(+15.4)#659 |
| 7. | Sallis | 17.9% | 2.4%(+15.5)#7 | 4.3%(+13.6)#794 |
| 8. | Beauregard | 17.6% | 2.4%(+15.3)#8 | 4.3%(+13.4)#802 |
| 9. | Ashland | 14.0% | 2.4%(+11.6)#9 | 4.3%(+9.70)#1,201 |
| 10. | Redwater | 13.8% | 2.4%(+11.4)#10 | 4.3%(+9.54)#1,227 |
| 11. | Marietta | 13.3% | 2.4%(+11.0)#11 | 4.3%(+9.08)#1,301 |
| 12. | French Camp | 13.2% | 2.4%(+10.8)#12 | 4.3%(+8.91)#1,330 |
| 13. | Como | 12.9% | 2.4%(+10.6)#13 | 4.3%(+8.69)#1,351 |
| 14. | Louise | 12.5% | 2.4%(+10.1)#14 | 4.3%(+8.25)#1,429 |
| 15. | Arcola | 12.0% | 2.4%(+9.62)#15 | 4.3%(+7.75)#1,522 |
| 16. | Morton | 11.9% | 2.4%(+9.53)#16 | 4.3%(+7.65)#1,539 |
| 17. | Meadville | 10.7% | 2.4%(+8.30)#17 | 4.3%(+6.43)#1,844 |
| 18. | Snow Lake Shores | 10.4% | 2.4%(+8.01)#18 | 4.3%(+6.14)#1,932 |
| 19. | Caledonia | 10.3% | 2.4%(+7.91)#19 | 4.3%(+6.03)#1,966 |
| 20. | Tunica | 10.2% | 2.4%(+7.81)#20 | 4.3%(+5.94)#2,001 |
| 21. | Glen | 10.0% | 2.4%(+7.62)#21 | 4.3%(+5.75)#2,066 |
| 22. | Hollandale | 10.0% | 2.4%(+7.59)#22 | 4.3%(+5.71)#2,088 |
| 23. | Lyman | 9.9% | 2.4%(+7.54)#23 | 4.3%(+5.66)#2,102 |
| 24. | Goodman | 9.5% | 2.4%(+7.15)#24 | 4.3%(+5.27)#2,231 |
| 25. | St Martin | 9.2% | 2.4%(+6.81)#25 | 4.3%(+4.93)#2,364 |
| 26. | Gluckstadt | 8.7% | 2.4%(+6.33)#26 | 4.3%(+4.45)#2,594 |
| 27. | Water Valley | 8.5% | 2.4%(+6.10)#27 | 4.3%(+4.23)#2,703 |
| 28. | Holly Springs | 8.1% | 2.4%(+5.67)#28 | 4.3%(+3.80)#2,938 |
| 29. | Blue Mountain | 7.8% | 2.4%(+5.41)#29 | 4.3%(+3.54)#3,092 |
| 30. | Arnold Line | 7.6% | 2.4%(+5.19)#30 | 4.3%(+3.31)#3,254 |
| 31. | Sunflower | 7.5% | 2.4%(+5.16)#31 | 4.3%(+3.28)#3,276 |
| 32. | Verona | 7.4% | 2.4%(+5.03)#32 | 4.3%(+3.16)#3,349 |
| 33. | Tremont | 7.1% | 2.4%(+4.76)#33 | 4.3%(+2.89)#3,590 |
| 34. | Meridian | 7.0% | 2.4%(+4.62)#34 | 4.3%(+2.75)#3,706 |
| 35. | Mccomb | 6.7% | 2.4%(+4.31)#35 | 4.3%(+2.44)#4,009 |
| 36. | Plantersville | 6.5% | 2.4%(+4.14)#36 | 4.3%(+2.27)#4,174 |
| 37. | Columbia | 6.4% | 2.4%(+3.99)#37 | 4.3%(+2.11)#4,327 |
| 38. | Oak Grove | 6.3% | 2.4%(+3.96)#38 | 4.3%(+2.09)#4,350 |
| 39. | Renova | 6.0% | 2.4%(+3.62)#39 | 4.3%(+1.75)#4,724 |
| 40. | Bay St Louis | 5.9% | 2.4%(+3.52)#40 | 4.3%(+1.64)#4,819 |
| 41. | Belzoni | 5.8% | 2.4%(+3.42)#41 | 4.3%(+1.55)#4,942 |
| 42. | Union | 5.7% | 2.4%(+3.29)#42 | 4.3%(+1.42)#5,097 |
| 43. | Gulf Hills | 5.7% | 2.4%(+3.29)#43 | 4.3%(+1.41)#5,100 |
| 44. | Vicksburg | 5.7% | 2.4%(+3.28)#44 | 4.3%(+1.41)#5,102 |
| 45. | Stonewall | 5.1% | 2.4%(+2.77)#45 | 4.3%(+0.895)#5,778 |
| 46. | Starkville | 5.0% | 2.4%(+2.60)#46 | 4.3%(+0.723)#6,041 |
| 47. | Cleary | 4.8% | 2.4%(+2.46)#47 | 4.3%(+0.587)#6,274 |
| 48. | Petal | 4.8% | 2.4%(+2.44)#48 | 4.3%(+0.564)#6,326 |
| 49. | De Kalb | 4.8% | 2.4%(+2.38)#49 | 4.3%(+0.510)#6,412 |
| 50. | Oxford | 4.7% | 2.4%(+2.33)#50 | 4.3%(+0.458)#6,509 |
| 51. | Natchez | 4.7% | 2.4%(+2.28)#51 | 4.3%(+0.406)#6,608 |
| 52. | Lynchburg | 4.6% | 2.4%(+2.25)#52 | 4.3%(+0.373)#6,670 |
| 53. | Byram | 4.5% | 2.4%(+2.12)#53 | 4.3%(+0.245)#6,913 |
| 54. | Okolona | 4.4% | 2.4%(+2.04)#54 | 4.3%(+0.168)#7,060 |
| 55. | Hattiesburg | 4.4% | 2.4%(+2.01)#55 | 4.3%(+0.141)#7,109 |
| 56. | Rosedale | 4.3% | 2.4%(+1.92)#56 | 4.3%(+0.042)#7,307 |
| 57. | Falkner | 4.1% | 2.4%(+1.70)#57 | 4.3%(-0.170)#7,759 |
| 58. | Delisle | 4.0% | 2.4%(+1.66)#58 | 4.3%(-0.218)#7,854 |
| 59. | New Hope | 4.0% | 2.4%(+1.63)#59 | 4.3%(-0.246)#7,910 |
| 60. | Taylor | 4.0% | 2.4%(+1.62)#60 | 4.3%(-0.252)#7,941 |
| 61. | Horn Lake | 3.9% | 2.4%(+1.56)#61 | 4.3%(-0.310)#8,048 |
| 62. | Walnut Grove | 3.8% | 2.4%(+1.47)#62 | 4.3%(-0.406)#8,287 |
| 63. | Prentiss | 3.8% | 2.4%(+1.43)#63 | 4.3%(-0.443)#8,375 |
| 64. | Indianola | 3.8% | 2.4%(+1.37)#64 | 4.3%(-0.500)#8,487 |
| 65. | Tishomingo | 3.6% | 2.4%(+1.26)#65 | 4.3%(-0.616)#8,740 |
| 66. | Sturgis | 3.6% | 2.4%(+1.19)#66 | 4.3%(-0.681)#8,904 |
| 67. | Clinton | 3.5% | 2.4%(+1.15)#67 | 4.3%(-0.728)#9,025 |
| 68. | Belmont | 3.4% | 2.4%(+1.06)#68 | 4.3%(-0.817)#9,233 |
| 69. | Decatur | 3.4% | 2.4%(+1.03)#69 | 4.3%(-0.843)#9,297 |
| 70. | Edwards | 3.3% | 2.4%(+0.955)#70 | 4.3%(-0.919)#9,500 |
| 71. | Tchula | 3.3% | 2.4%(+0.914)#71 | 4.3%(-0.960)#9,611 |
| 72. | New Hebron | 3.3% | 2.4%(+0.901)#72 | 4.3%(-0.973)#9,648 |
| 73. | Quitman | 3.2% | 2.4%(+0.829)#73 | 4.3%(-1.05)#9,823 |
| 74. | Coffeeville | 3.1% | 2.4%(+0.747)#74 | 4.3%(-1.13)#10,023 |
| 75. | Myrtle | 3.1% | 2.4%(+0.747)#75 | 4.3%(-1.13)#10,025 |
| 76. | Jackson | 3.1% | 2.4%(+0.724)#76 | 4.3%(-1.15)#10,082 |
| 77. | Magee | 3.1% | 2.4%(+0.699)#77 | 4.3%(-1.18)#10,146 |
| 78. | Long Beach | 3.1% | 2.4%(+0.692)#78 | 4.3%(-1.18)#10,163 |
| 79. | Aberdeen | 3.1% | 2.4%(+0.688)#79 | 4.3%(-1.19)#10,173 |
| 80. | Madison | 3.1% | 2.4%(+0.683)#80 | 4.3%(-1.19)#10,196 |
| 81. | Ridgeland | 3.1% | 2.4%(+0.672)#81 | 4.3%(-1.20)#10,219 |
| 82. | Laurel | 3.0% | 2.4%(+0.657)#82 | 4.3%(-1.22)#10,252 |
| 83. | Byhalia | 3.0% | 2.4%(+0.634)#83 | 4.3%(-1.24)#10,331 |
| 84. | Pontotoc | 3.0% | 2.4%(+0.607)#84 | 4.3%(-1.27)#10,395 |
| 85. | Bolton | 2.9% | 2.4%(+0.546)#85 | 4.3%(-1.33)#10,552 |
| 86. | Columbus | 2.8% | 2.4%(+0.416)#86 | 4.3%(-1.46)#10,878 |
| 87. | Vaiden | 2.8% | 2.4%(+0.381)#87 | 4.3%(-1.49)#10,985 |
| 88. | Diamondhead | 2.7% | 2.4%(+0.361)#88 | 4.3%(-1.51)#11,047 |
| 89. | Latimer | 2.7% | 2.4%(+0.329)#89 | 4.3%(-1.55)#11,099 |
| 90. | Olive Branch | 2.7% | 2.4%(+0.298)#90 | 4.3%(-1.58)#11,196 |
| 91. | Marion | 2.6% | 2.4%(+0.261)#91 | 4.3%(-1.61)#11,288 |
| 92. | Brandon | 2.6% | 2.4%(+0.193)#92 | 4.3%(-1.68)#11,454 |
| 93. | Louisville | 2.5% | 2.4%(+0.170)#93 | 4.3%(-1.70)#11,522 |
| 94. | Lucedale | 2.5% | 2.4%(+0.115)#94 | 4.3%(-1.76)#11,686 |
| 95. | Port Gibson | 2.5% | 2.4%(+0.113)#95 | 4.3%(-1.76)#11,689 |
| 96. | Marks | 2.4% | 2.4%(+0.041)#96 | 4.3%(-1.83)#11,864 |
| 97. | Pass Christian | 2.4% | 2.4%(+0.035)#97 | 4.3%(-1.84)#11,876 |
| 98. | Ocean Springs | 2.4% | 2.4%(+0.023)#98 | 4.3%(-1.85)#11,903 |
| 99. | Tupelo | 2.4% | 2.4%(-0.011)#99 | 4.3%(-1.89)#11,995 |
| 100. | Biloxi | 2.3% | 2.4%(-0.030)#100 | 4.3%(-1.90)#12,036 |
Common Questions
What are the Top 10 Cities with the Highest Percentage of Population with a Degree in Visual and Performing Arts in Mississippi?
Top 10 Cities with the Highest Percentage of Population with a Degree in Visual and Performing Arts in Mississippi are:
What city has the Highest Percentage of Population with a Degree in Visual and Performing Arts in Mississippi?
Pittsboro has the Highest Percentage of Population with a Degree in Visual and Performing Arts in Mississippi with 47.6%.
What is the Percentage of Population with a Degree in Visual and Performing Arts in the State of Mississippi?
Percentage of Population with a Degree in Visual and Performing Arts in Mississippi is 2.4%.
What is the Percentage of Population with a Degree in Visual and Performing Arts in the United States?
Percentage of Population with a Degree in Visual and Performing Arts in the United States is 4.3%.