River Pines, CA Map & Demographics
River Pines Map
River Pines Overview
$23,738
PER CAPITA INCOME
0.37
INEQUALITY / GINI INDEX
487
TOTAL POPULATION
264
MALE POPULATION
223
FEMALE POPULATION
118.39
MALES / 100 FEMALES
84.47
FEMALES / 100 MALES
37.7
MEDIAN AGE
3.6
AVG FAMILY SIZE
3.5
AVG HOUSEHOLD SIZE
146
LABOR FORCE [ PEOPLE ]
38.5%
PERCENT IN LABOR FORCE
River Pines Zip Codes
River Pines Area Codes
Income in River Pines
Income Overview in River Pines
| Characteristic | Number | Measure |
| Per Capita Income | 487 | $23,738 |
| Median Family Income | 117 | $0 |
| Mean Family Income | 117 | $103,108 |
| Median Household Income | 140 | $0 |
| Mean Household Income | 140 | $86,464 |
| Income Deficit | 117 | $0 |
| Wage / Income Gap (%) | 487 | 0.00% |
| Wage / Income Gap ($) | 487 | 100.00¢ per $1 |
| Gini / Inequality Index | 487 | 0.37 |
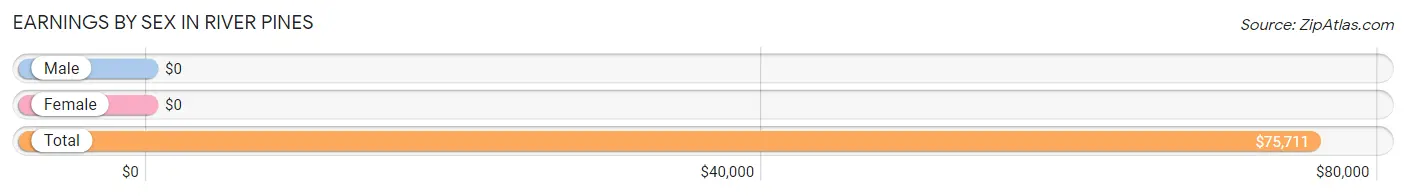
Earnings by Sex in River Pines
| Sex | Number | Average Earnings |
| Male | 105 (71.9%) | $0 |
| Female | 41 (28.1%) | $0 |
| Total | 146 (100.0%) | $75,711 |
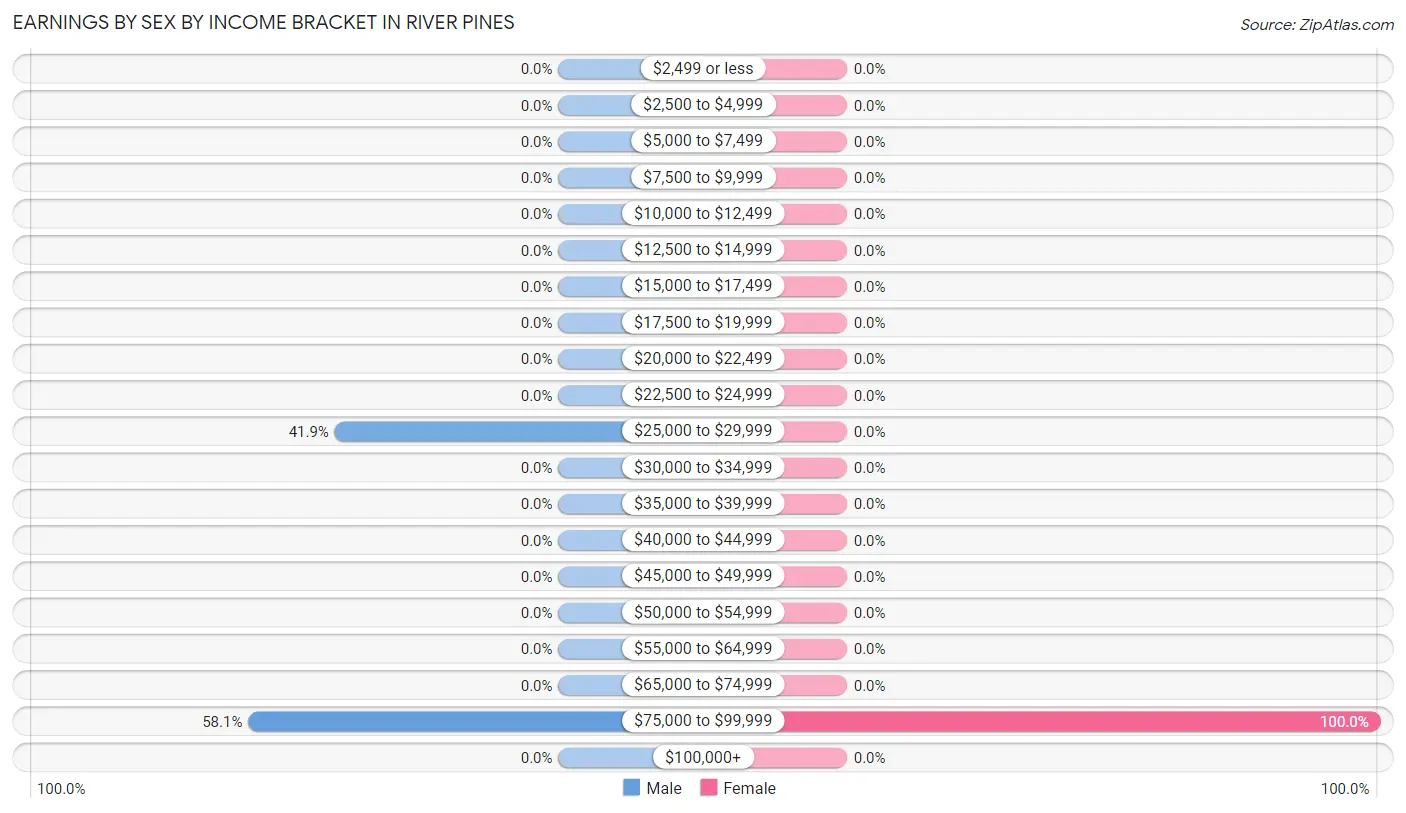
Earnings by Sex by Income Bracket in River Pines
The most common earnings brackets in River Pines are $75,000 to $99,999 for men (61 | 58.1%) and $75,000 to $99,999 for women (41 | 100.0%).
| Income | Male | Female |
| $2,499 or less | 0 (0.0%) | 0 (0.0%) |
| $2,500 to $4,999 | 0 (0.0%) | 0 (0.0%) |
| $5,000 to $7,499 | 0 (0.0%) | 0 (0.0%) |
| $7,500 to $9,999 | 0 (0.0%) | 0 (0.0%) |
| $10,000 to $12,499 | 0 (0.0%) | 0 (0.0%) |
| $12,500 to $14,999 | 0 (0.0%) | 0 (0.0%) |
| $15,000 to $17,499 | 0 (0.0%) | 0 (0.0%) |
| $17,500 to $19,999 | 0 (0.0%) | 0 (0.0%) |
| $20,000 to $22,499 | 0 (0.0%) | 0 (0.0%) |
| $22,500 to $24,999 | 0 (0.0%) | 0 (0.0%) |
| $25,000 to $29,999 | 44 (41.9%) | 0 (0.0%) |
| $30,000 to $34,999 | 0 (0.0%) | 0 (0.0%) |
| $35,000 to $39,999 | 0 (0.0%) | 0 (0.0%) |
| $40,000 to $44,999 | 0 (0.0%) | 0 (0.0%) |
| $45,000 to $49,999 | 0 (0.0%) | 0 (0.0%) |
| $50,000 to $54,999 | 0 (0.0%) | 0 (0.0%) |
| $55,000 to $64,999 | 0 (0.0%) | 0 (0.0%) |
| $65,000 to $74,999 | 0 (0.0%) | 0 (0.0%) |
| $75,000 to $99,999 | 61 (58.1%) | 41 (100.0%) |
| $100,000+ | 0 (0.0%) | 0 (0.0%) |
| Total | 105 (100.0%) | 41 (100.0%) |
Earnings by Sex by Educational Attainment in River Pines
| Educational Attainment | Male Income | Female Income |
| Less than High School | - | - |
| High School Diploma | - | - |
| College or Associate's Degree | - | - |
| Bachelor's Degree | - | - |
| Graduate Degree | - | - |
| Total | - | - |
Family Income in River Pines
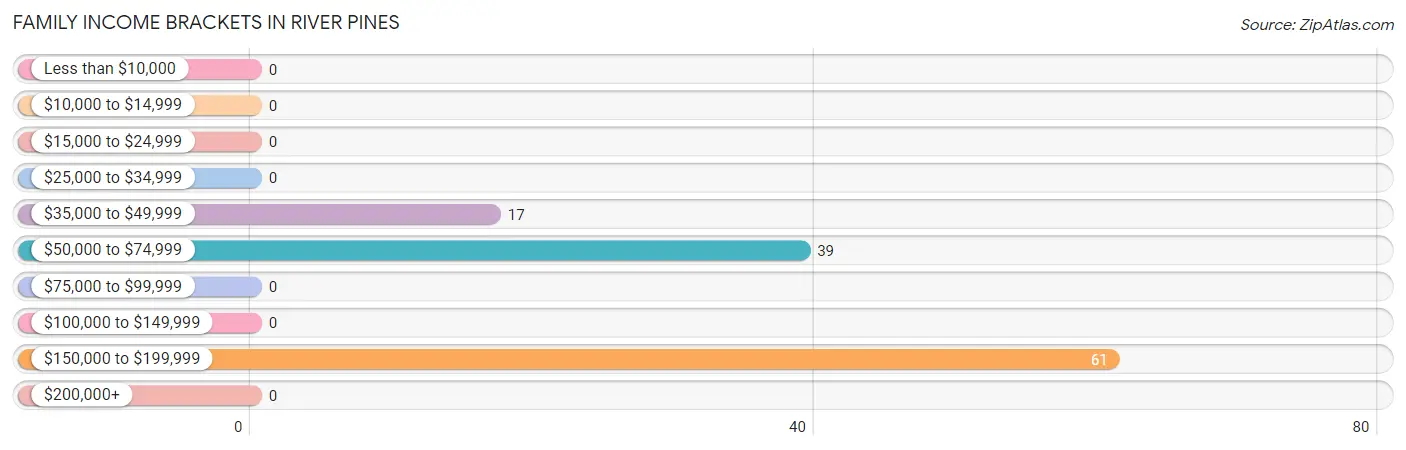
Family Income Brackets in River Pines
According to the River Pines family income data, there are 61 families falling into the $150,000 to $199,999 income range, which is the most common income bracket and makes up 52.1% of all families.
| Income Bracket | # Families | % Families |
| Less than $10,000 | 0 | 0.0% |
| $10,000 to $14,999 | 0 | 0.0% |
| $15,000 to $24,999 | 0 | 0.0% |
| $25,000 to $34,999 | 0 | 0.0% |
| $35,000 to $49,999 | 17 | 14.5% |
| $50,000 to $74,999 | 39 | 33.3% |
| $75,000 to $99,999 | 0 | 0.0% |
| $100,000 to $149,999 | 0 | 0.0% |
| $150,000 to $199,999 | 61 | 52.1% |
| $200,000+ | 0 | 0.0% |
Family Income by Famaliy Size in River Pines
| Income Bracket | # Families | Median Income |
| 2-Person Families | 0 (0.0%) | $0 |
| 3-Person Families | 56 (47.9%) | $0 |
| 4-Person Families | 0 (0.0%) | $0 |
| 5-Person Families | 61 (52.1%) | $0 |
| 6-Person Families | 0 (0.0%) | $0 |
| 7+ Person Families | 0 (0.0%) | $0 |
| Total | 117 (100.0%) | $0 |
Family Income by Number of Earners in River Pines
| Number of Earners | # Families | Median Income |
| No Earners | 39 (33.3%) | $0 |
| 1 Earner | 17 (14.5%) | $0 |
| 2 Earners | 61 (52.1%) | $0 |
| 3+ Earners | 0 (0.0%) | $0 |
| Total | 117 (100.0%) | $0 |
Household Income in River Pines
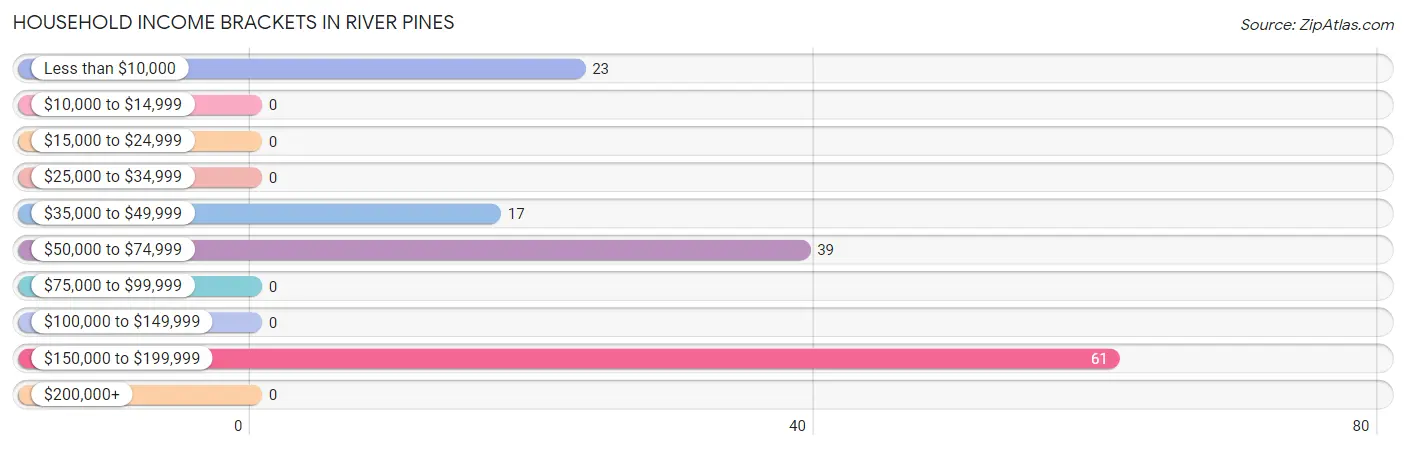
Household Income Brackets in River Pines
With 61 households falling in the category, the $150,000 to $199,999 income range is the most frequent in River Pines, accounting for 43.6% of all households.
| Income Bracket | # Households | % Households |
| Less than $10,000 | 23 | 16.4% |
| $10,000 to $14,999 | 0 | 0.0% |
| $15,000 to $24,999 | 0 | 0.0% |
| $25,000 to $34,999 | 0 | 0.0% |
| $35,000 to $49,999 | 17 | 12.1% |
| $50,000 to $74,999 | 39 | 27.9% |
| $75,000 to $99,999 | 0 | 0.0% |
| $100,000 to $149,999 | 0 | 0.0% |
| $150,000 to $199,999 | 61 | 43.6% |
| $200,000+ | 0 | 0.0% |
Household Income by Householder Age in River Pines
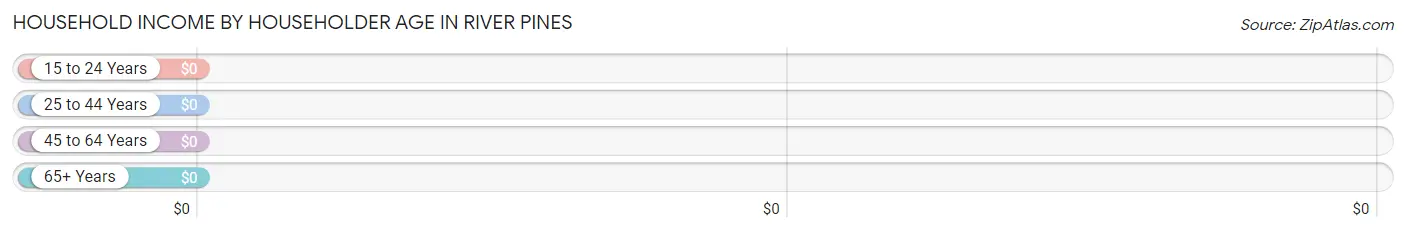
| Income Bracket | # Households | Median Income |
| 15 to 24 Years | 0 (0.0%) | $0 |
| 25 to 44 Years | 78 (55.7%) | $0 |
| 45 to 64 Years | 23 (16.4%) | $0 |
| 65+ Years | 39 (27.9%) | $0 |
| Total | 140 (100.0%) | $0 |
Poverty in River Pines
Income Below Poverty by Sex and Age in River Pines
With 8.7% poverty level for males and 19.3% for females among the residents of River Pines, 55 to 64 year old males and 55 to 64 year old females are the most vulnerable to poverty, with 23 males (100.0%) and 43 females (100.0%) in their respective age groups living below the poverty level.
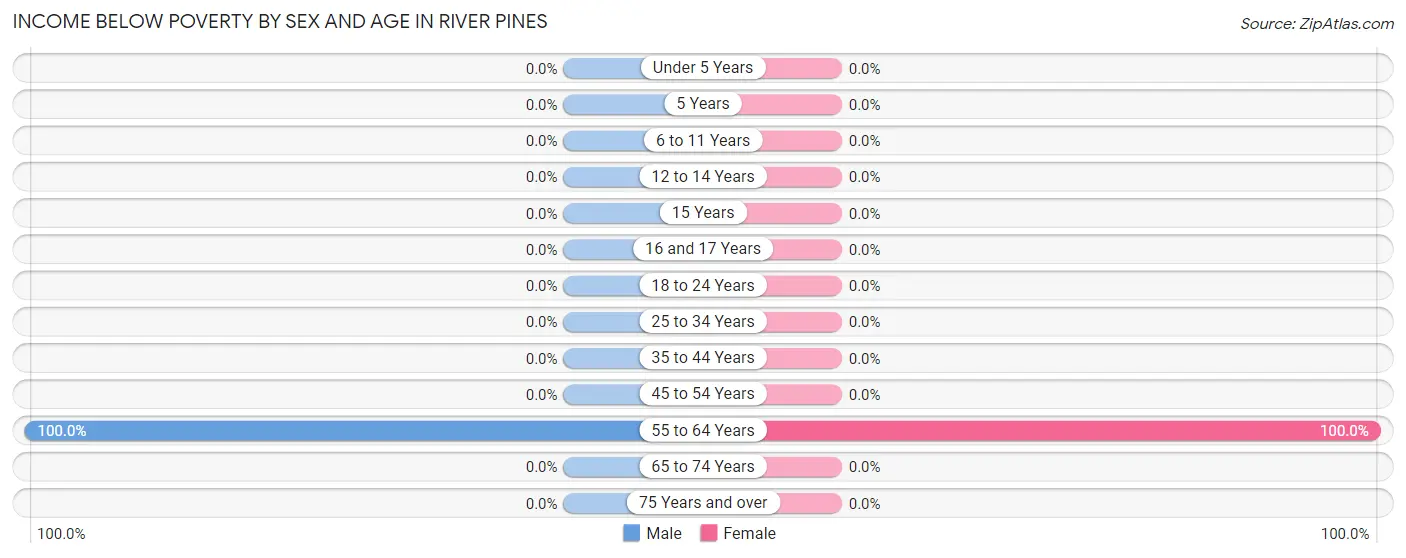
| Age Bracket | Male | Female |
| Under 5 Years | 0 (0.0%) | 0 (0.0%) |
| 5 Years | 0 (0.0%) | 0 (0.0%) |
| 6 to 11 Years | 0 (0.0%) | 0 (0.0%) |
| 12 to 14 Years | 0 (0.0%) | 0 (0.0%) |
| 15 Years | 0 (0.0%) | 0 (0.0%) |
| 16 and 17 Years | 0 (0.0%) | 0 (0.0%) |
| 18 to 24 Years | 0 (0.0%) | 0 (0.0%) |
| 25 to 34 Years | 0 (0.0%) | 0 (0.0%) |
| 35 to 44 Years | 0 (0.0%) | 0 (0.0%) |
| 45 to 54 Years | 0 (0.0%) | 0 (0.0%) |
| 55 to 64 Years | 23 (100.0%) | 43 (100.0%) |
| 65 to 74 Years | 0 (0.0%) | 0 (0.0%) |
| 75 Years and over | 0 (0.0%) | 0 (0.0%) |
| Total | 23 (8.7%) | 43 (19.3%) |
Income Above Poverty by Sex and Age in River Pines
According to the poverty statistics in River Pines, males aged 12 to 14 years and females aged 6 to 11 years are the age groups that are most secure financially, with 100.0% of males and 100.0% of females in these age groups living above the poverty line.
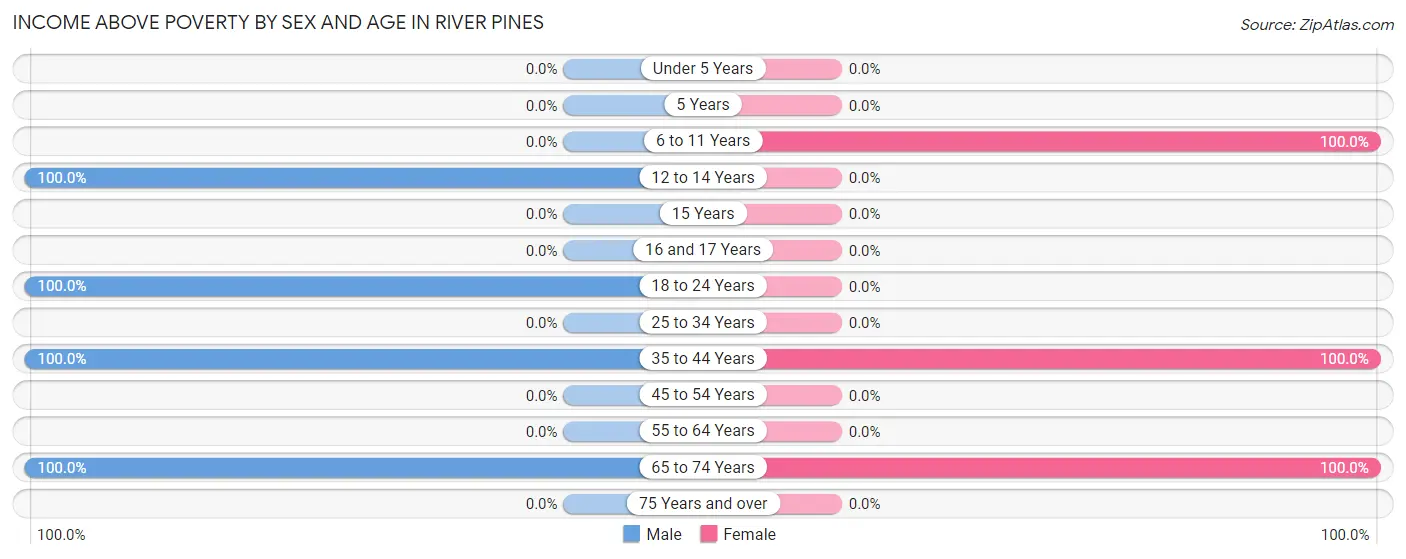
| Age Bracket | Male | Female |
| Under 5 Years | 0 (0.0%) | 0 (0.0%) |
| 5 Years | 0 (0.0%) | 0 (0.0%) |
| 6 to 11 Years | 0 (0.0%) | 28 (100.0%) |
| 12 to 14 Years | 80 (100.0%) | 0 (0.0%) |
| 15 Years | 0 (0.0%) | 0 (0.0%) |
| 16 and 17 Years | 0 (0.0%) | 0 (0.0%) |
| 18 to 24 Years | 44 (100.0%) | 0 (0.0%) |
| 25 to 34 Years | 0 (0.0%) | 0 (0.0%) |
| 35 to 44 Years | 78 (100.0%) | 58 (100.0%) |
| 45 to 54 Years | 0 (0.0%) | 0 (0.0%) |
| 55 to 64 Years | 0 (0.0%) | 0 (0.0%) |
| 65 to 74 Years | 39 (100.0%) | 94 (100.0%) |
| 75 Years and over | 0 (0.0%) | 0 (0.0%) |
| Total | 241 (91.3%) | 180 (80.7%) |
Income Below Poverty Among Married-Couple Families in River Pines
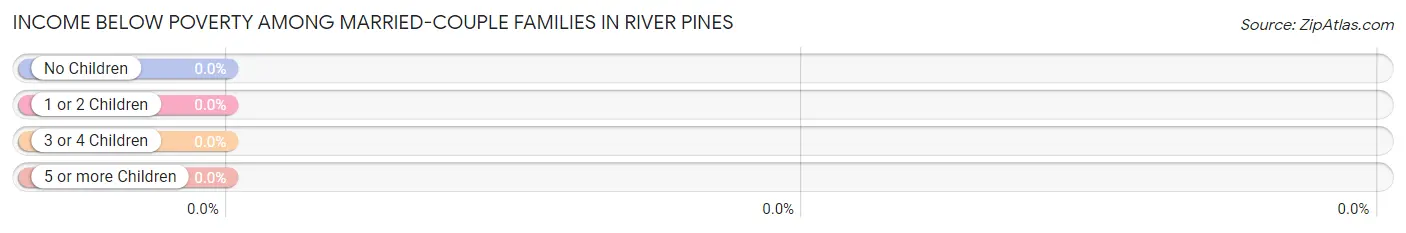
| Children | Above Poverty | Below Poverty |
| No Children | 56 (100.0%) | 0 (0.0%) |
| 1 or 2 Children | 0 (0.0%) | 0 (0.0%) |
| 3 or 4 Children | 61 (100.0%) | 0 (0.0%) |
| 5 or more Children | 0 (0.0%) | 0 (0.0%) |
| Total | 117 (100.0%) | 0 (0.0%) |
Income Below Poverty Among Single-Parent Households in River Pines
| Children | Single Father | Single Mother |
| No Children | 0 (0.0%) | 0 (0.0%) |
| 1 or 2 Children | 0 (0.0%) | 0 (0.0%) |
| 3 or 4 Children | 0 (0.0%) | 0 (0.0%) |
| 5 or more Children | 0 (0.0%) | 0 (0.0%) |
| Total | 0 (0.0%) | 0 (0.0%) |
Income Below Poverty Among Married-Couple vs Single-Parent Households in River Pines
| Children | Married-Couple Families | Single-Parent Households |
| No Children | 0 (0.0%) | 0 (0.0%) |
| 1 or 2 Children | 0 (0.0%) | 0 (0.0%) |
| 3 or 4 Children | 0 (0.0%) | 0 (0.0%) |
| 5 or more Children | 0 (0.0%) | 0 (0.0%) |
| Total | 0 (0.0%) | 0 (0.0%) |
Race in River Pines
The most populous races in River Pines are White / Caucasian (366 | 75.1%), Two or more Races (78 | 16.0%), and Black / African American (43 | 8.8%).
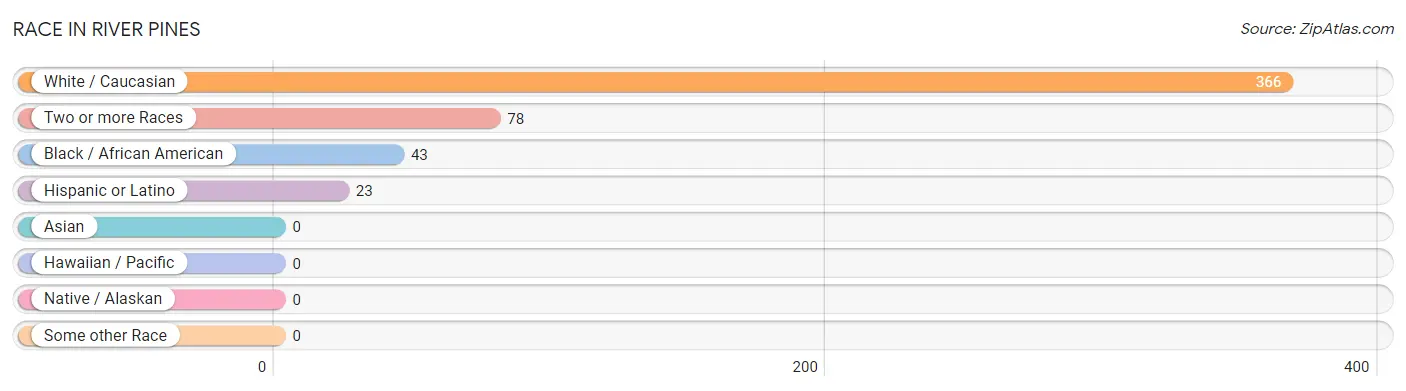
| Race | # Population | % Population |
| Asian | 0 | 0.0% |
| Black / African American | 43 | 8.8% |
| Hawaiian / Pacific | 0 | 0.0% |
| Hispanic or Latino | 23 | 4.7% |
| Native / Alaskan | 0 | 0.0% |
| White / Caucasian | 366 | 75.1% |
| Two or more Races | 78 | 16.0% |
| Some other Race | 0 | 0.0% |
| Total | 487 | 100.0% |
Ancestry in River Pines
The most populous ancestries reported in River Pines are Ukrainian (149 | 30.6%), Irish (121 | 24.8%), Russian (108 | 22.2%), Cherokee (78 | 16.0%), and Blackfeet (61 | 12.5%), together accounting for 106.2% of all River Pines residents.
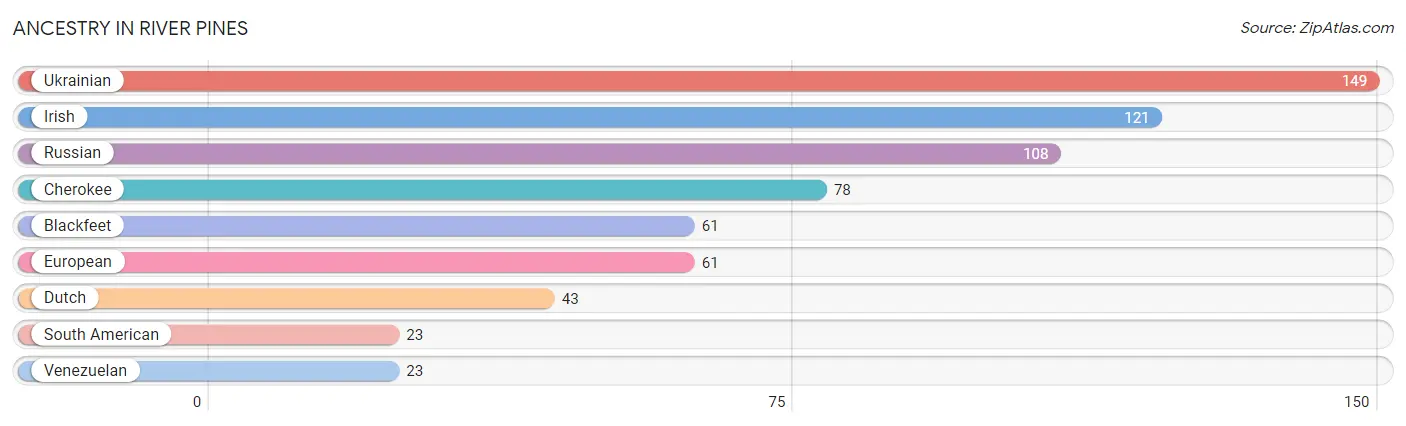
| Ancestry | # Population | % Population |
| Blackfeet | 61 | 12.5% |
| Cherokee | 78 | 16.0% |
| Dutch | 43 | 8.8% |
| European | 61 | 12.5% |
| Irish | 121 | 24.8% |
| Russian | 108 | 22.2% |
| South American | 23 | 4.7% |
| Ukrainian | 149 | 30.6% |
| Venezuelan | 23 | 4.7% | View All 9 Rows |
Immigrants in River Pines
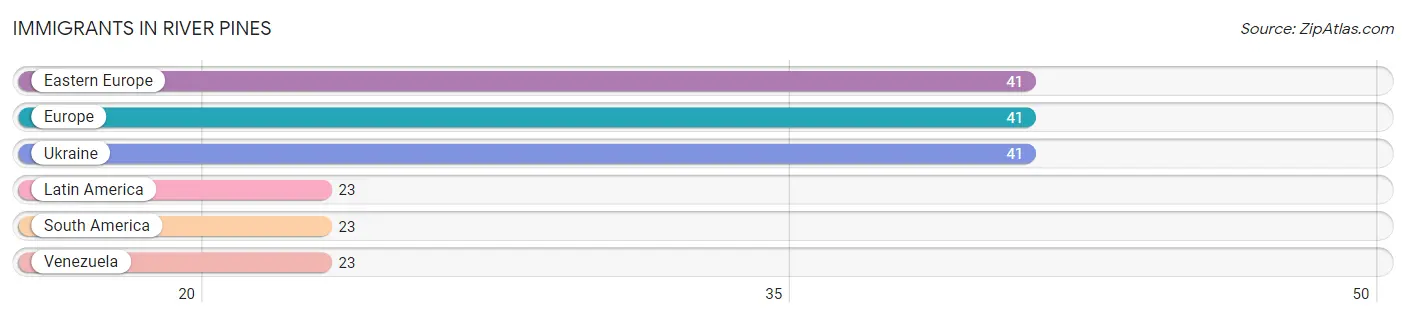
The most numerous immigrant groups reported in River Pines came from Eastern Europe (41 | 8.4%), Europe (41 | 8.4%), Ukraine (41 | 8.4%), Latin America (23 | 4.7%), and South America (23 | 4.7%), together accounting for 34.7% of all River Pines residents.
| Immigration Origin | # Population | % Population |
| Eastern Europe | 41 | 8.4% |
| Europe | 41 | 8.4% |
| Latin America | 23 | 4.7% |
| South America | 23 | 4.7% |
| Ukraine | 41 | 8.4% |
| Venezuela | 23 | 4.7% | View All 6 Rows |
Sex and Age in River Pines
Sex and Age in River Pines
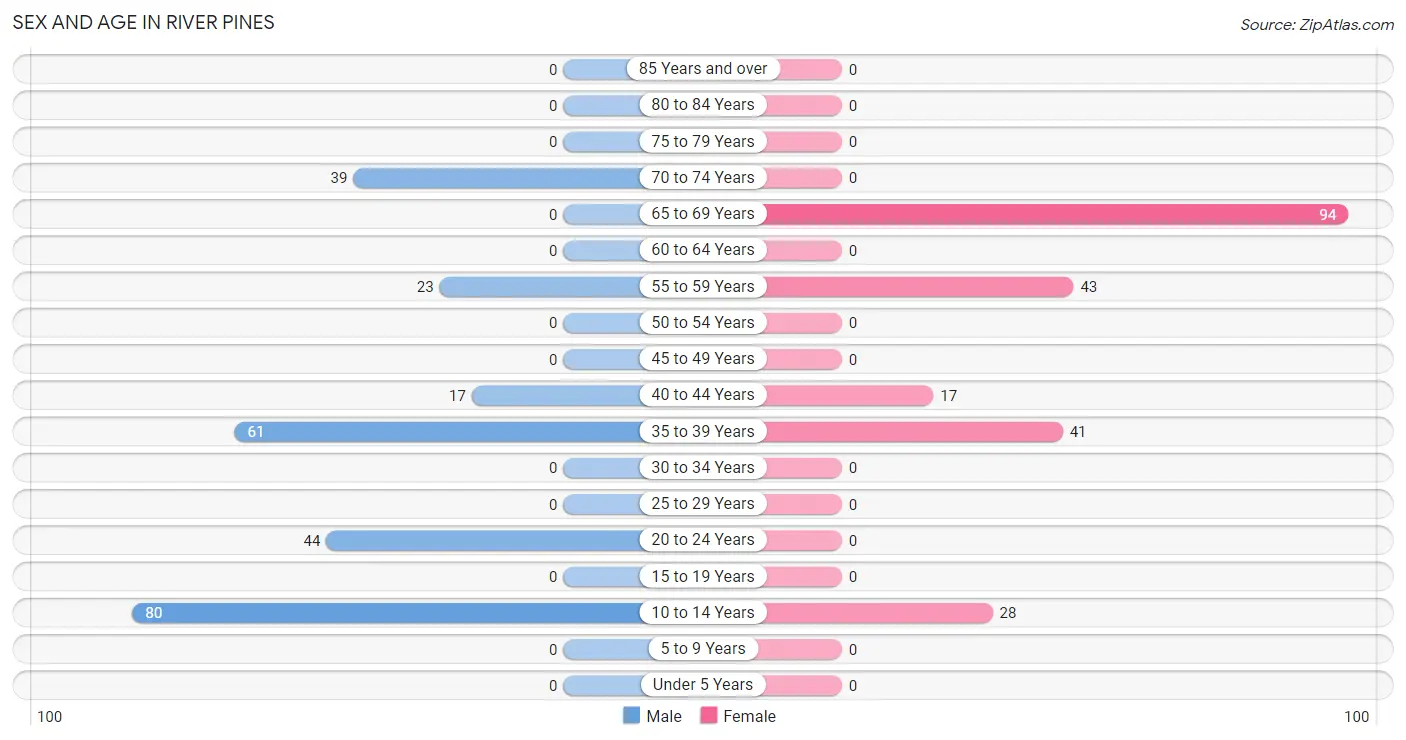
The most populous age groups in River Pines are 10 to 14 Years (80 | 30.3%) for men and 65 to 69 Years (94 | 42.1%) for women.
| Age Bracket | Male | Female |
| Under 5 Years | 0 (0.0%) | 0 (0.0%) |
| 5 to 9 Years | 0 (0.0%) | 0 (0.0%) |
| 10 to 14 Years | 80 (30.3%) | 28 (12.6%) |
| 15 to 19 Years | 0 (0.0%) | 0 (0.0%) |
| 20 to 24 Years | 44 (16.7%) | 0 (0.0%) |
| 25 to 29 Years | 0 (0.0%) | 0 (0.0%) |
| 30 to 34 Years | 0 (0.0%) | 0 (0.0%) |
| 35 to 39 Years | 61 (23.1%) | 41 (18.4%) |
| 40 to 44 Years | 17 (6.4%) | 17 (7.6%) |
| 45 to 49 Years | 0 (0.0%) | 0 (0.0%) |
| 50 to 54 Years | 0 (0.0%) | 0 (0.0%) |
| 55 to 59 Years | 23 (8.7%) | 43 (19.3%) |
| 60 to 64 Years | 0 (0.0%) | 0 (0.0%) |
| 65 to 69 Years | 0 (0.0%) | 94 (42.1%) |
| 70 to 74 Years | 39 (14.8%) | 0 (0.0%) |
| 75 to 79 Years | 0 (0.0%) | 0 (0.0%) |
| 80 to 84 Years | 0 (0.0%) | 0 (0.0%) |
| 85 Years and over | 0 (0.0%) | 0 (0.0%) |
| Total | 264 (100.0%) | 223 (100.0%) |
Families and Households in River Pines
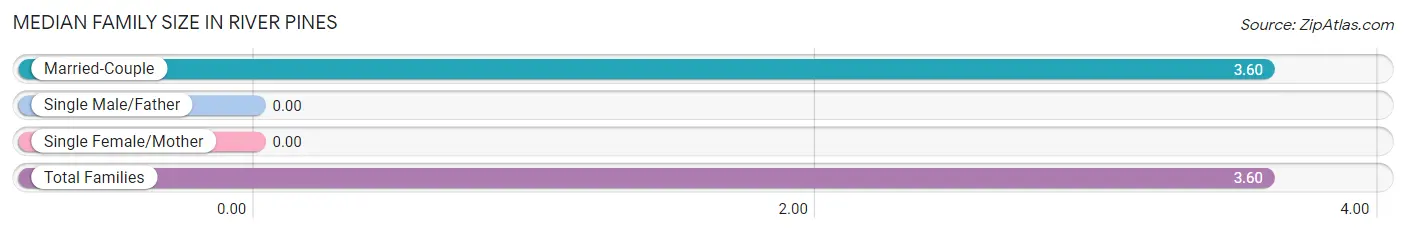
Median Family Size in River Pines
| Family Type | # Families | Family Size |
| Married-Couple | 117 (100.0%) | 3.60 |
| Single Male/Father | 0 (0.0%) | - |
| Single Female/Mother | 0 (0.0%) | - |
| Total Families | 117 (100.0%) | 3.60 |
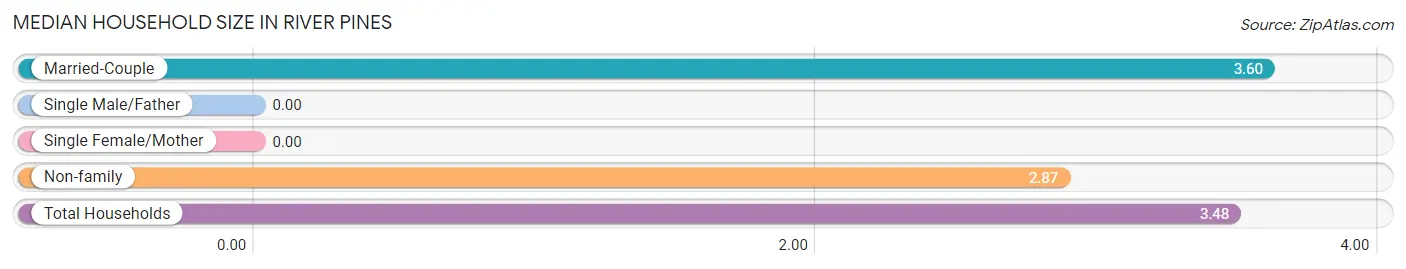
Median Household Size in River Pines
| Household Type | # Households | Household Size |
| Married-Couple | 117 (83.6%) | 3.60 |
| Single Male/Father | 0 (0.0%) | - |
| Single Female/Mother | 0 (0.0%) | - |
| Non-family | 23 (16.4%) | 2.87 |
| Total Households | 140 (100.0%) | 3.48 |
Household Size by Marriage Status in River Pines
Out of a total of 140 households in River Pines, 117 (83.6%) are family households, while 23 (16.4%) are nonfamily households. The most numerous type of family households are 5-person households, comprising 61, and the most common type of nonfamily households are 2-person households, comprising 23.
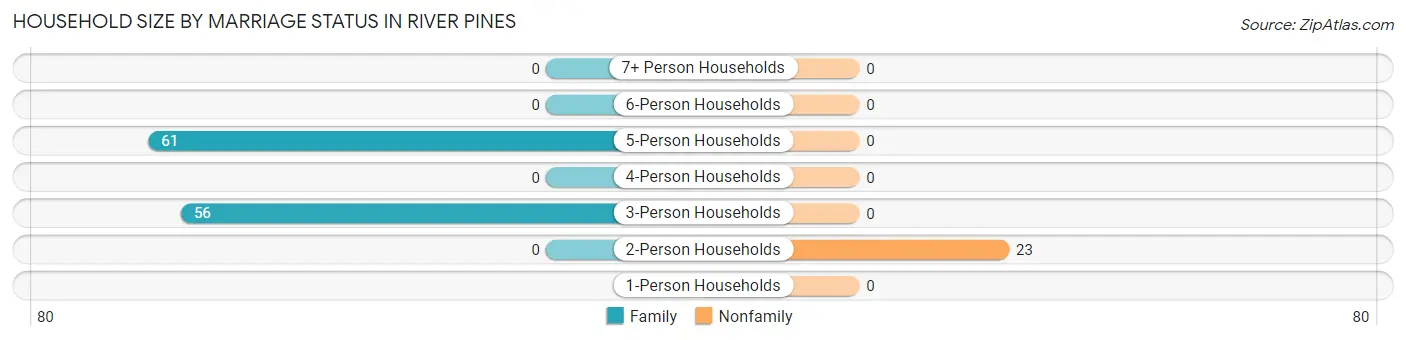
| Household Size | Family Households | Nonfamily Households |
| 1-Person Households | - | 0 (0.0%) |
| 2-Person Households | 0 (0.0%) | 23 (16.4%) |
| 3-Person Households | 56 (40.0%) | 0 (0.0%) |
| 4-Person Households | 0 (0.0%) | 0 (0.0%) |
| 5-Person Households | 61 (43.6%) | 0 (0.0%) |
| 6-Person Households | 0 (0.0%) | 0 (0.0%) |
| 7+ Person Households | 0 (0.0%) | 0 (0.0%) |
| Total | 117 (83.6%) | 23 (16.4%) |
Female Fertility in River Pines
Fertility by Age in River Pines
| Age Bracket | Women with Births | Births / 1,000 Women |
| 15 to 19 years | 0 (0.0%) | 0.0 |
| 20 to 34 years | 0 (0.0%) | 0.0 |
| 35 to 50 years | 0 (0.0%) | 0.0 |
| Total | 0 (0.0%) | 0.0 |
Fertility by Age by Marriage Status in River Pines
| Age Bracket | Married | Unmarried |
| 15 to 19 years | 0 (0.0%) | 0 (0.0%) |
| 20 to 34 years | 0 (0.0%) | 0 (0.0%) |
| 35 to 50 years | 0 (0.0%) | 0 (0.0%) |
| Total | 0 (0.0%) | 0 (0.0%) |
Fertility by Education in River Pines
| Educational Attainment | Women with Births | Births / 1,000 Women |
| Less than High School | 0 (0.0%) | 0.0 |
| High School Diploma | 0 (0.0%) | 0.0 |
| College or Associate's Degree | 0 (0.0%) | 0.0 |
| Bachelor's Degree | 0 (0.0%) | 0.0 |
| Graduate Degree | 0 (0.0%) | 0.0 |
| Total | 0 (0.0%) | 0.0 |
Fertility by Education by Marriage Status in River Pines
| Educational Attainment | Married | Unmarried |
| Less than High School | 0 (0.0%) | 0 (0.0%) |
| High School Diploma | 0 (0.0%) | 0 (0.0%) |
| College or Associate's Degree | 0 (0.0%) | 0 (0.0%) |
| Bachelor's Degree | 0 (0.0%) | 0 (0.0%) |
| Graduate Degree | 0 (0.0%) | 0 (0.0%) |
| Total | 0 (0.0%) | 0 (0.0%) |
Employment Characteristics in River Pines
Employment by Class of Employer in River Pines
Among the 146 employed individuals in River Pines, local government employees (61 | 41.8%), private company employees (44 | 30.1%), and not-for-profit organizations (41 | 28.1%) make up the most common classes of employment.
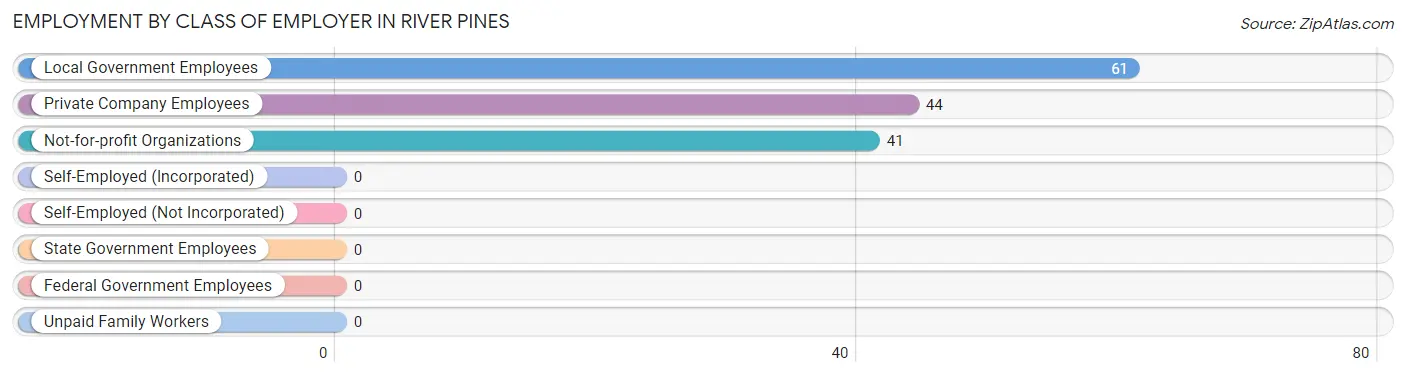
| Employer Class | # Employees | % Employees |
| Private Company Employees | 44 | 30.1% |
| Self-Employed (Incorporated) | 0 | 0.0% |
| Self-Employed (Not Incorporated) | 0 | 0.0% |
| Not-for-profit Organizations | 41 | 28.1% |
| Local Government Employees | 61 | 41.8% |
| State Government Employees | 0 | 0.0% |
| Federal Government Employees | 0 | 0.0% |
| Unpaid Family Workers | 0 | 0.0% |
| Total | 146 | 100.0% |
Employment Status by Age in River Pines
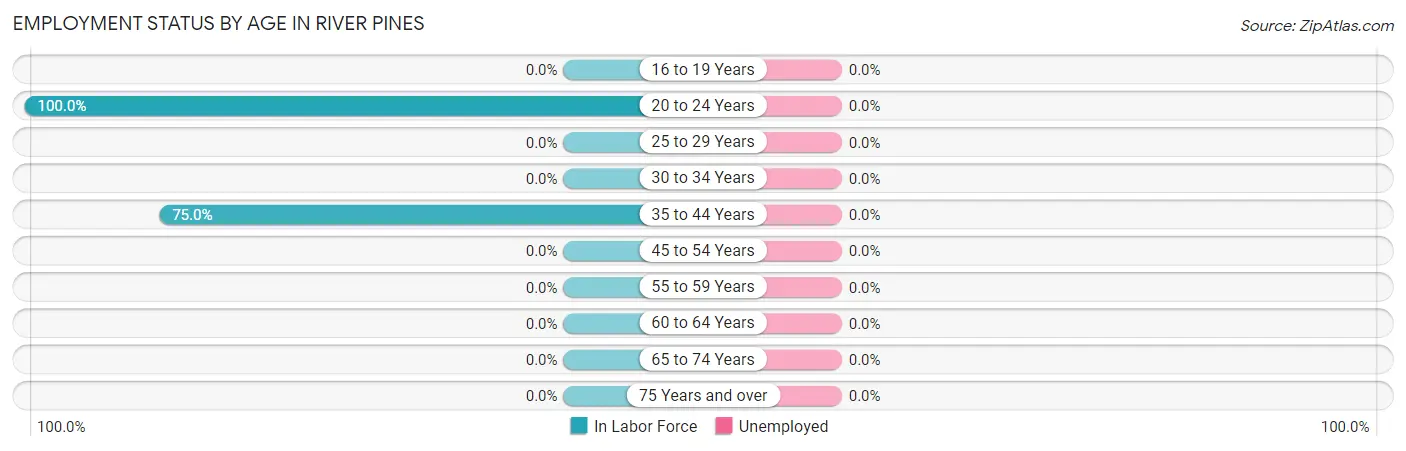
| Age Bracket | In Labor Force | Unemployed |
| 16 to 19 Years | 0 (0.0%) | 0 (0.0%) |
| 20 to 24 Years | 44 (100.0%) | 0 (0.0%) |
| 25 to 29 Years | 0 (0.0%) | 0 (0.0%) |
| 30 to 34 Years | 0 (0.0%) | 0 (0.0%) |
| 35 to 44 Years | 102 (75.0%) | 0 (0.0%) |
| 45 to 54 Years | 0 (0.0%) | 0 (0.0%) |
| 55 to 59 Years | 0 (0.0%) | 0 (0.0%) |
| 60 to 64 Years | 0 (0.0%) | 0 (0.0%) |
| 65 to 74 Years | 0 (0.0%) | 0 (0.0%) |
| 75 Years and over | 0 (0.0%) | 0 (0.0%) |
| Total | 146 (38.5%) | 0 (0.0%) |
Employment Status by Educational Attainment in River Pines
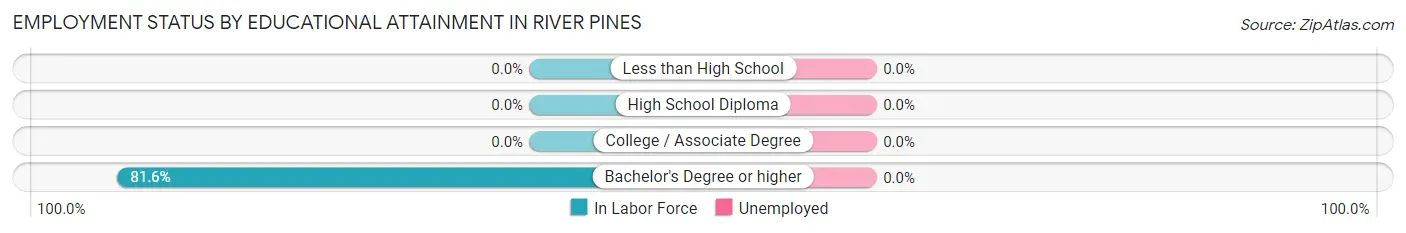
| Educational Attainment | In Labor Force | Unemployed |
| Less than High School | 0 (0.0%) | 0 (0.0%) |
| High School Diploma | 0 (0.0%) | 0 (0.0%) |
| College / Associate Degree | 0 (0.0%) | 0 (0.0%) |
| Bachelor's Degree or higher | 102 (81.6%) | 0 (0.0%) |
| Total | 102 (50.5%) | 0 (0.0%) |
Employment Occupations by Sex in River Pines
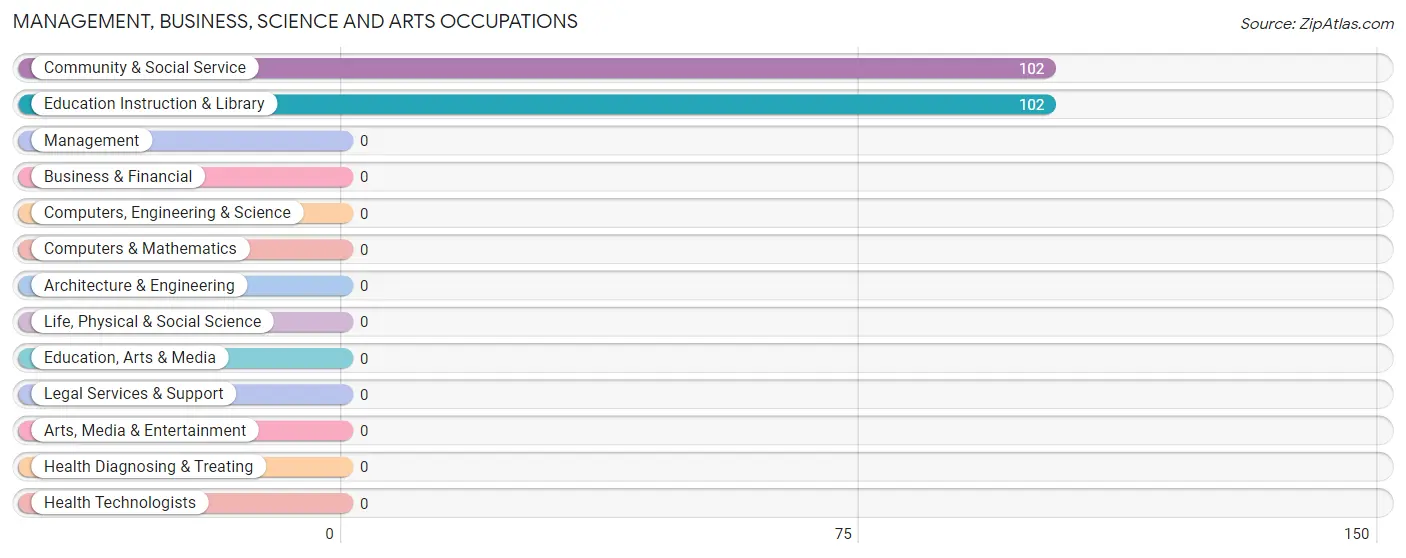
Management, Business, Science and Arts Occupations
The most common Management, Business, Science and Arts occupations in River Pines are Community & Social Service (102 | 69.9%), and Education Instruction & Library (102 | 69.9%).
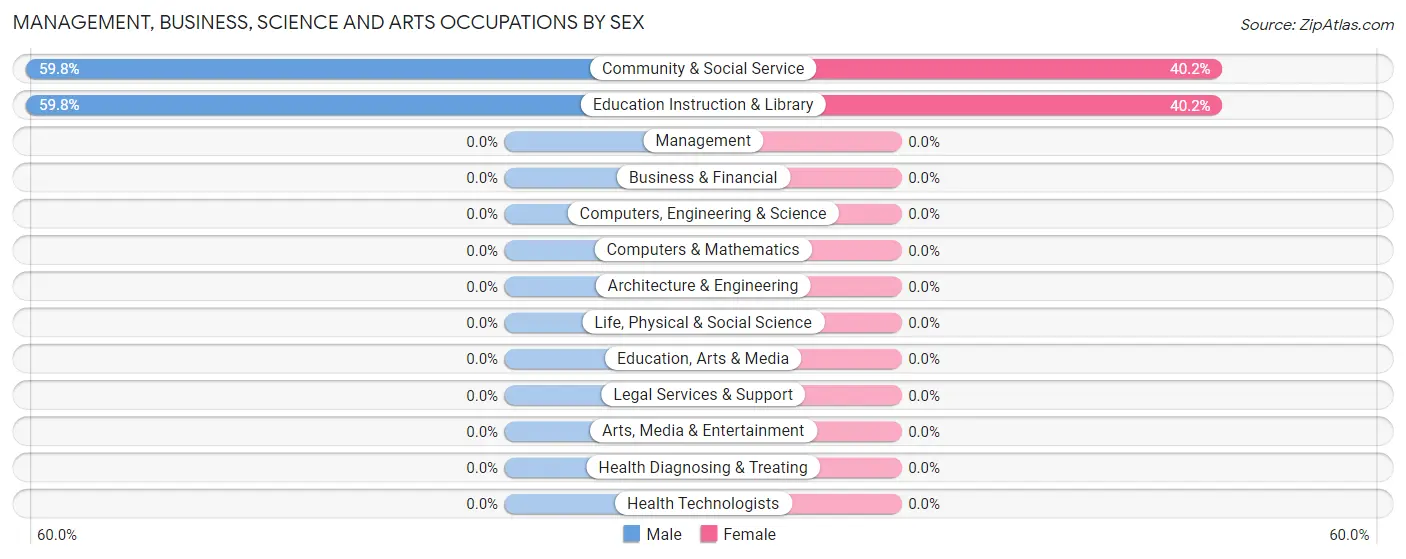
Management, Business, Science and Arts Occupations by Sex
Within the Management, Business, Science and Arts occupations in River Pines, the most male-oriented occupations are Community & Social Service (59.8%), and Education Instruction & Library (59.8%), while the most female-oriented occupations are Community & Social Service (40.2%), and Education Instruction & Library (40.2%).
| Occupation | Male | Female |
| Management | 0 (0.0%) | 0 (0.0%) |
| Business & Financial | 0 (0.0%) | 0 (0.0%) |
| Computers, Engineering & Science | 0 (0.0%) | 0 (0.0%) |
| Computers & Mathematics | 0 (0.0%) | 0 (0.0%) |
| Architecture & Engineering | 0 (0.0%) | 0 (0.0%) |
| Life, Physical & Social Science | 0 (0.0%) | 0 (0.0%) |
| Community & Social Service | 61 (59.8%) | 41 (40.2%) |
| Education, Arts & Media | 0 (0.0%) | 0 (0.0%) |
| Legal Services & Support | 0 (0.0%) | 0 (0.0%) |
| Education Instruction & Library | 61 (59.8%) | 41 (40.2%) |
| Arts, Media & Entertainment | 0 (0.0%) | 0 (0.0%) |
| Health Diagnosing & Treating | 0 (0.0%) | 0 (0.0%) |
| Health Technologists | 0 (0.0%) | 0 (0.0%) |
| Total (Category) | 61 (59.8%) | 41 (40.2%) |
| Total (Overall) | 105 (71.9%) | 41 (28.1%) |
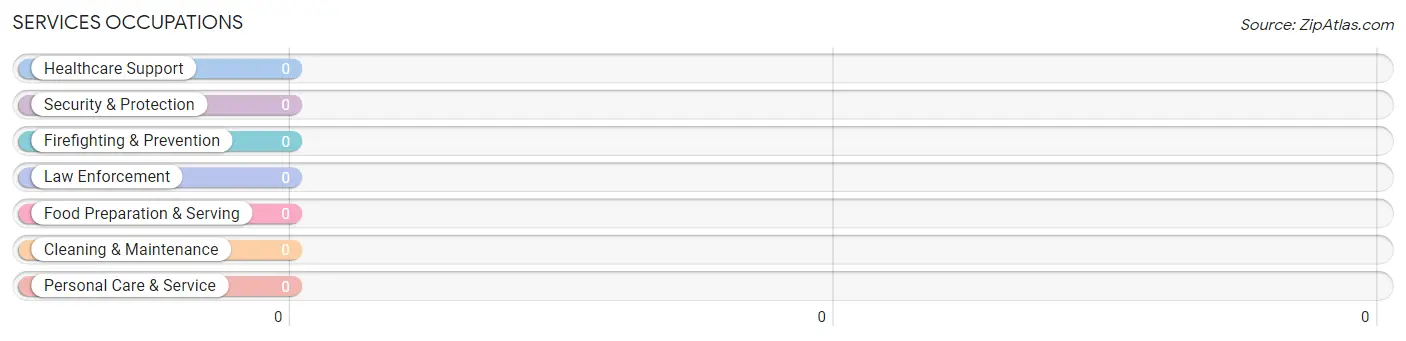
Services Occupations
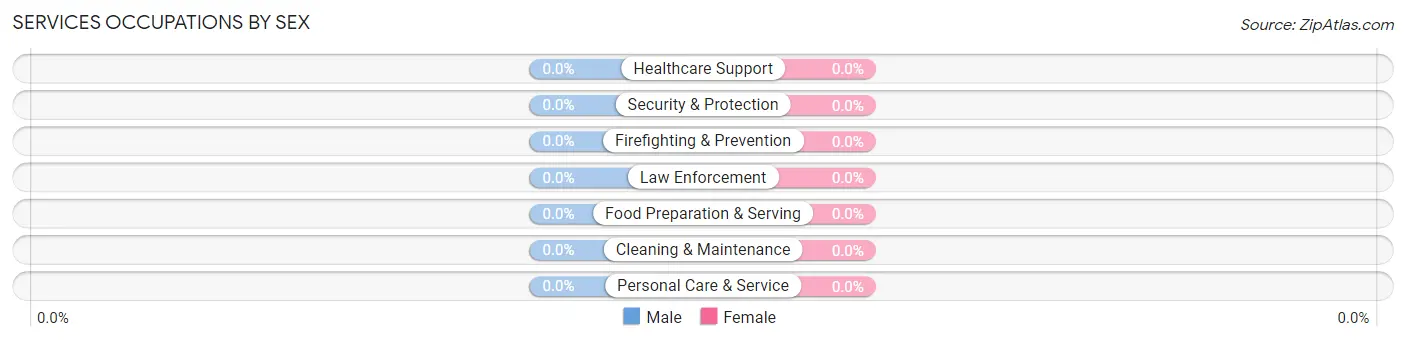
Services Occupations by Sex
| Occupation | Male | Female |
| Healthcare Support | 0 (0.0%) | 0 (0.0%) |
| Security & Protection | 0 (0.0%) | 0 (0.0%) |
| Firefighting & Prevention | 0 (0.0%) | 0 (0.0%) |
| Law Enforcement | 0 (0.0%) | 0 (0.0%) |
| Food Preparation & Serving | 0 (0.0%) | 0 (0.0%) |
| Cleaning & Maintenance | 0 (0.0%) | 0 (0.0%) |
| Personal Care & Service | 0 (0.0%) | 0 (0.0%) |
| Total (Category) | 0 (0.0%) | 0 (0.0%) |
| Total (Overall) | 105 (71.9%) | 41 (28.1%) |
Sales and Office Occupations

Sales and Office Occupations by Sex

| Occupation | Male | Female |
| Sales & Related | 0 (0.0%) | 0 (0.0%) |
| Office & Administration | 0 (0.0%) | 0 (0.0%) |
| Total (Category) | 0 (0.0%) | 0 (0.0%) |
| Total (Overall) | 105 (71.9%) | 41 (28.1%) |
Natural Resources, Construction and Maintenance Occupations
Natural Resources, Construction and Maintenance Occupations by Sex
| Occupation | Male | Female |
| Farming, Fishing & Forestry | 0 (0.0%) | 0 (0.0%) |
| Construction & Extraction | 0 (0.0%) | 0 (0.0%) |
| Installation, Maintenance & Repair | 0 (0.0%) | 0 (0.0%) |
| Total (Category) | 0 (0.0%) | 0 (0.0%) |
| Total (Overall) | 105 (71.9%) | 41 (28.1%) |
Production, Transportation and Moving Occupations
The most common Production, Transportation and Moving occupations in River Pines are , and Material Moving (44 | 30.1%).
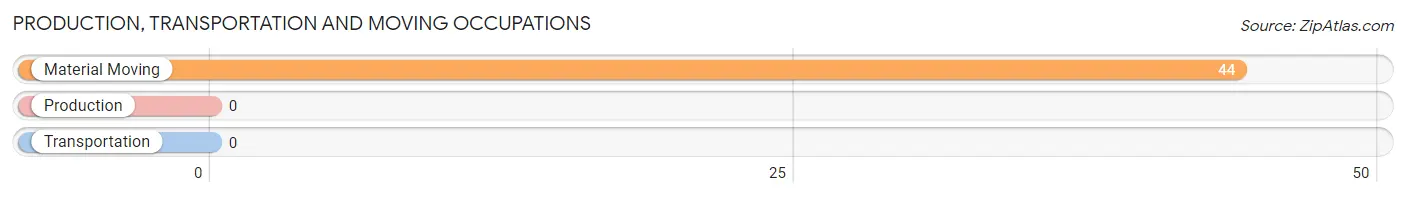
Production, Transportation and Moving Occupations by Sex
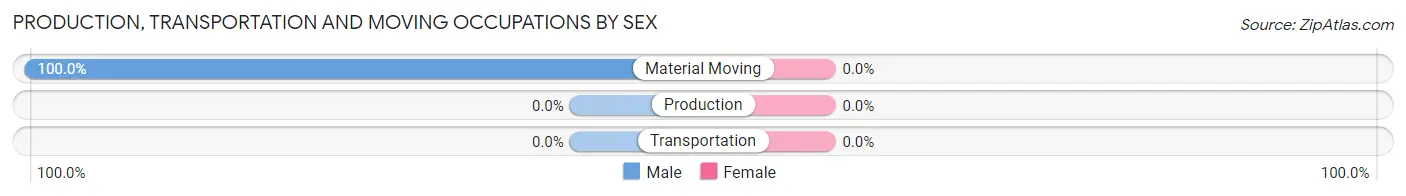
| Occupation | Male | Female |
| Production | 0 (0.0%) | 0 (0.0%) |
| Transportation | 0 (0.0%) | 0 (0.0%) |
| Material Moving | 44 (100.0%) | 0 (0.0%) |
| Total (Category) | 44 (100.0%) | 0 (0.0%) |
| Total (Overall) | 105 (71.9%) | 41 (28.1%) |
Employment Industries by Sex in River Pines
Employment Industries in River Pines
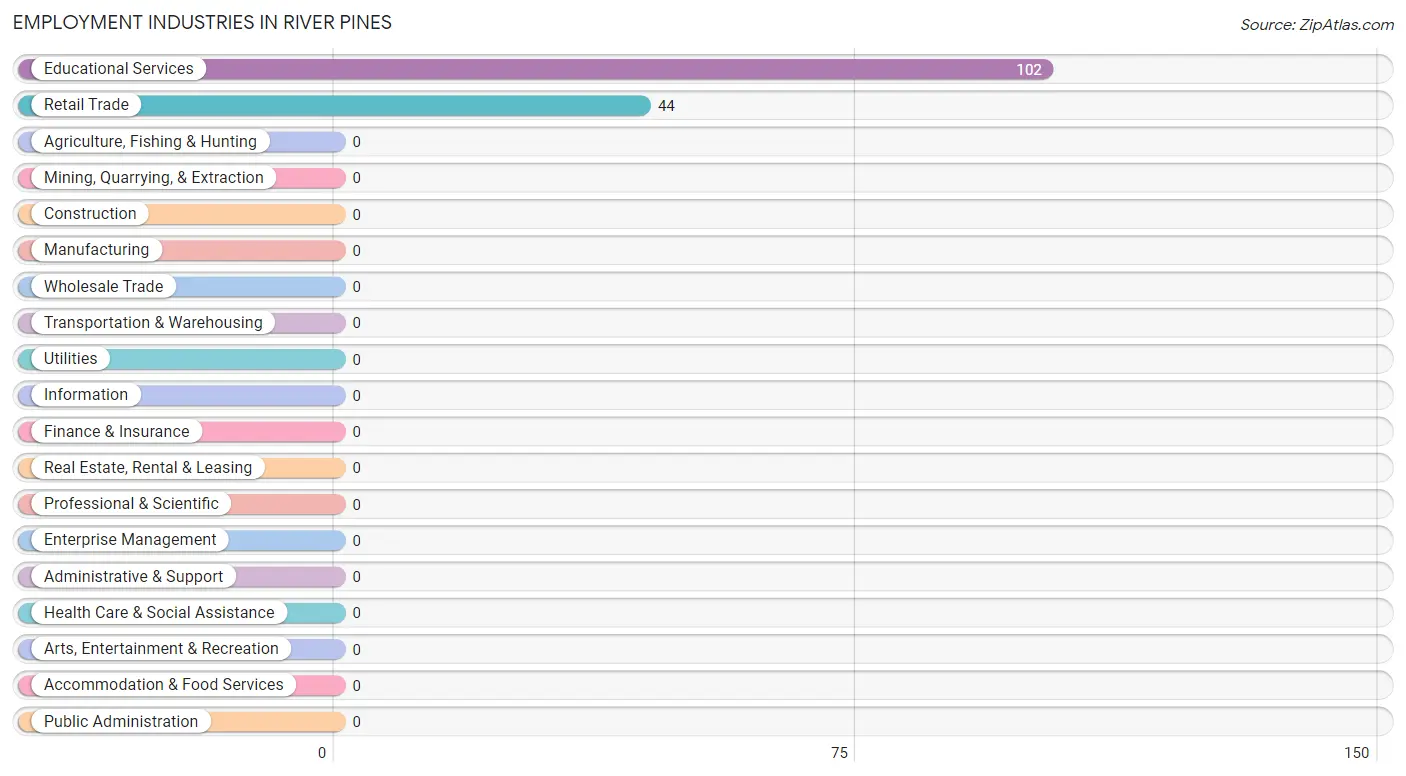
The major employment industries in River Pines include Educational Services (102 | 69.9%), and Retail Trade (44 | 30.1%).
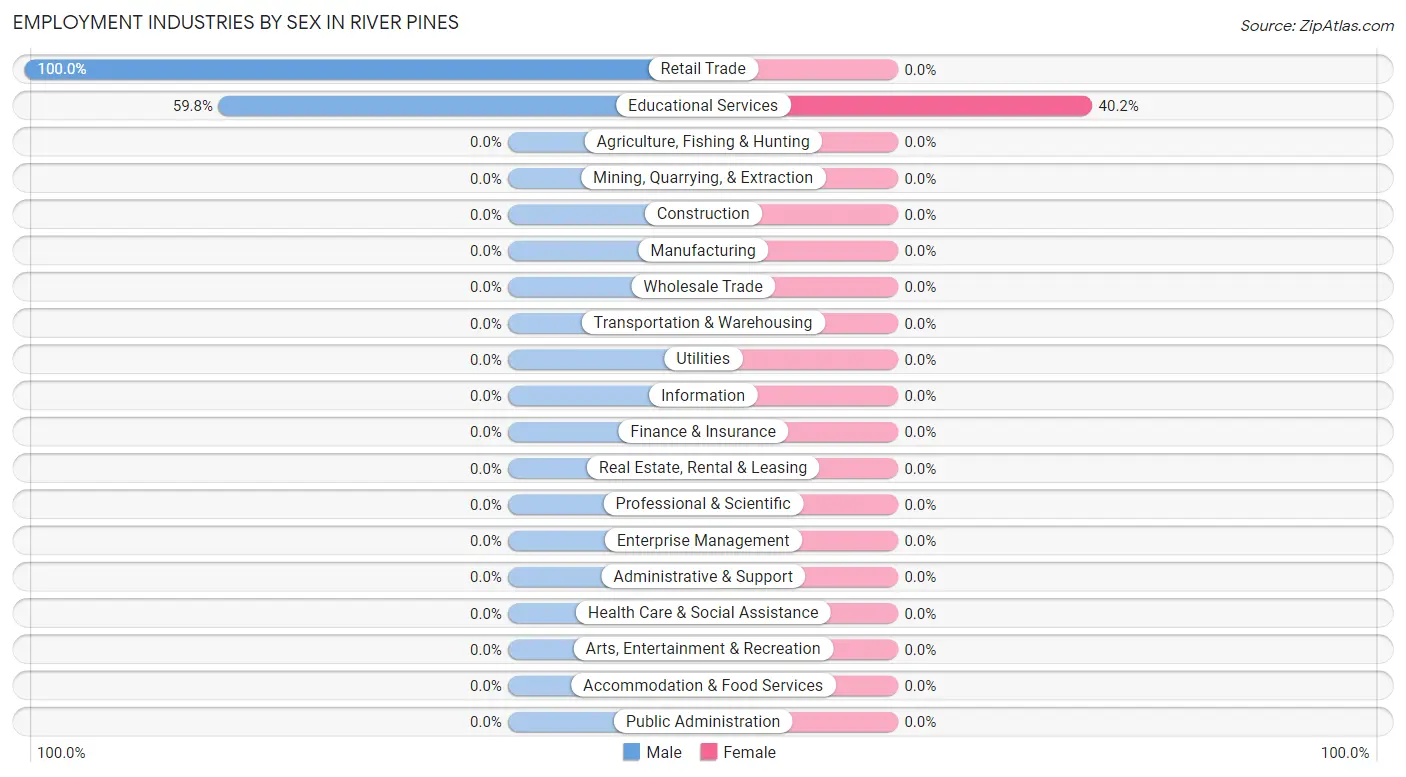
Employment Industries by Sex in River Pines
| Industry | Male | Female |
| Agriculture, Fishing & Hunting | 0 (0.0%) | 0 (0.0%) |
| Mining, Quarrying, & Extraction | 0 (0.0%) | 0 (0.0%) |
| Construction | 0 (0.0%) | 0 (0.0%) |
| Manufacturing | 0 (0.0%) | 0 (0.0%) |
| Wholesale Trade | 0 (0.0%) | 0 (0.0%) |
| Retail Trade | 44 (100.0%) | 0 (0.0%) |
| Transportation & Warehousing | 0 (0.0%) | 0 (0.0%) |
| Utilities | 0 (0.0%) | 0 (0.0%) |
| Information | 0 (0.0%) | 0 (0.0%) |
| Finance & Insurance | 0 (0.0%) | 0 (0.0%) |
| Real Estate, Rental & Leasing | 0 (0.0%) | 0 (0.0%) |
| Professional & Scientific | 0 (0.0%) | 0 (0.0%) |
| Enterprise Management | 0 (0.0%) | 0 (0.0%) |
| Administrative & Support | 0 (0.0%) | 0 (0.0%) |
| Educational Services | 61 (59.8%) | 41 (40.2%) |
| Health Care & Social Assistance | 0 (0.0%) | 0 (0.0%) |
| Arts, Entertainment & Recreation | 0 (0.0%) | 0 (0.0%) |
| Accommodation & Food Services | 0 (0.0%) | 0 (0.0%) |
| Public Administration | 0 (0.0%) | 0 (0.0%) |
| Total | 105 (71.9%) | 41 (28.1%) |
Education in River Pines
School Enrollment in River Pines
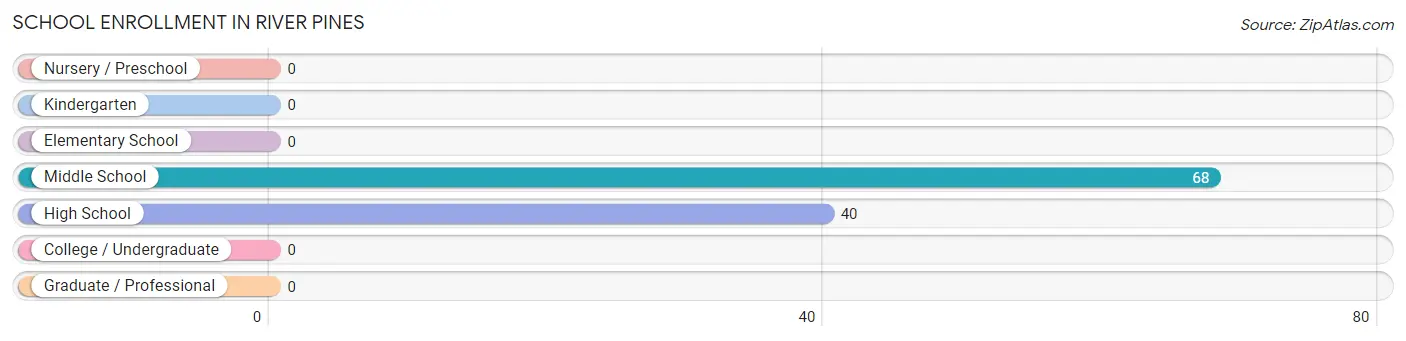
The most common levels of schooling among the 108 students in River Pines are middle school (68 | 63.0%), and high school (40 | 37.0%).
| School Level | # Students | % Students |
| Nursery / Preschool | 0 | 0.0% |
| Kindergarten | 0 | 0.0% |
| Elementary School | 0 | 0.0% |
| Middle School | 68 | 63.0% |
| High School | 40 | 37.0% |
| College / Undergraduate | 0 | 0.0% |
| Graduate / Professional | 0 | 0.0% |
| Total | 108 | 100.0% |
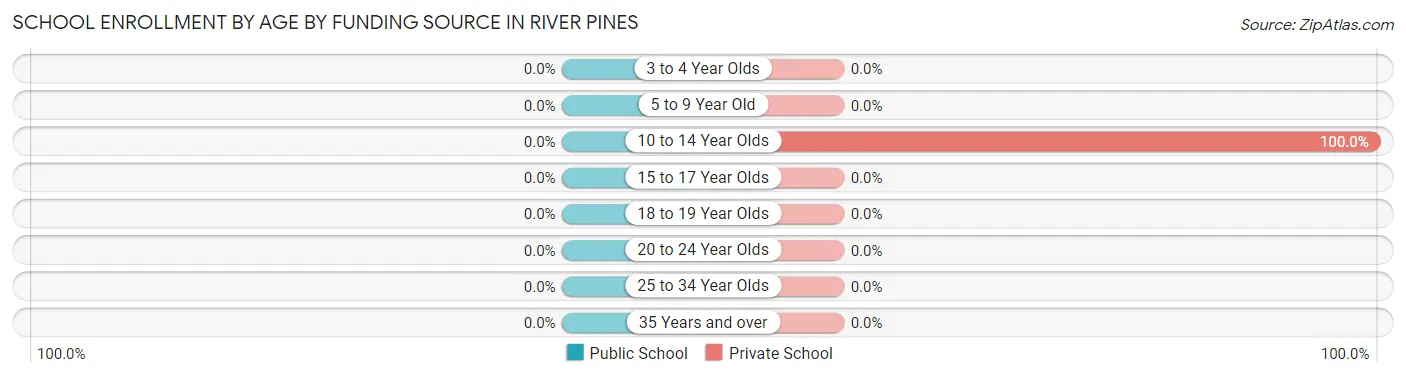
School Enrollment by Age by Funding Source in River Pines
| Age Bracket | Public School | Private School |
| 3 to 4 Year Olds | 0 (0.0%) | 0 (0.0%) |
| 5 to 9 Year Old | 0 (0.0%) | 0 (0.0%) |
| 10 to 14 Year Olds | 0 (0.0%) | 108 (100.0%) |
| 15 to 17 Year Olds | 0 (0.0%) | 0 (0.0%) |
| 18 to 19 Year Olds | 0 (0.0%) | 0 (0.0%) |
| 20 to 24 Year Olds | 0 (0.0%) | 0 (0.0%) |
| 25 to 34 Year Olds | 0 (0.0%) | 0 (0.0%) |
| 35 Years and over | 0 (0.0%) | 0 (0.0%) |
| Total | 0 (0.0%) | 108 (100.0%) |
Educational Attainment by Field of Study in River Pines
Visual & performing arts (102 | 81.6%), and business (23 | 18.4%) are the most common fields of study among 125 individuals in River Pines who have obtained a bachelor's degree or higher.
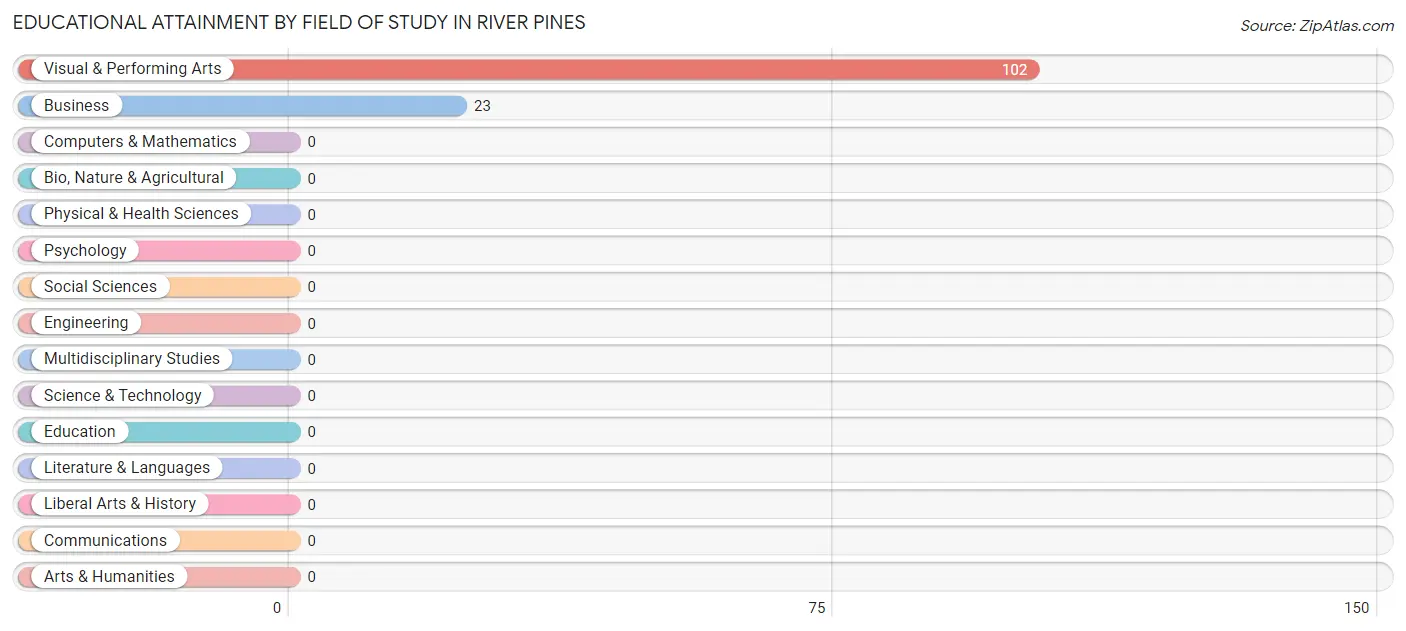
| Field of Study | # Graduates | % Graduates |
| Computers & Mathematics | 0 | 0.0% |
| Bio, Nature & Agricultural | 0 | 0.0% |
| Physical & Health Sciences | 0 | 0.0% |
| Psychology | 0 | 0.0% |
| Social Sciences | 0 | 0.0% |
| Engineering | 0 | 0.0% |
| Multidisciplinary Studies | 0 | 0.0% |
| Science & Technology | 0 | 0.0% |
| Business | 23 | 18.4% |
| Education | 0 | 0.0% |
| Literature & Languages | 0 | 0.0% |
| Liberal Arts & History | 0 | 0.0% |
| Visual & Performing Arts | 102 | 81.6% |
| Communications | 0 | 0.0% |
| Arts & Humanities | 0 | 0.0% |
| Total | 125 | 100.0% |
Transportation & Commute in River Pines
Vehicle Availability by Sex in River Pines
The most prevalent vehicle ownership categories in River Pines are males with 3 vehicles (61, accounting for 58.1%) and females with 3 vehicles (41, making up 148.8%).
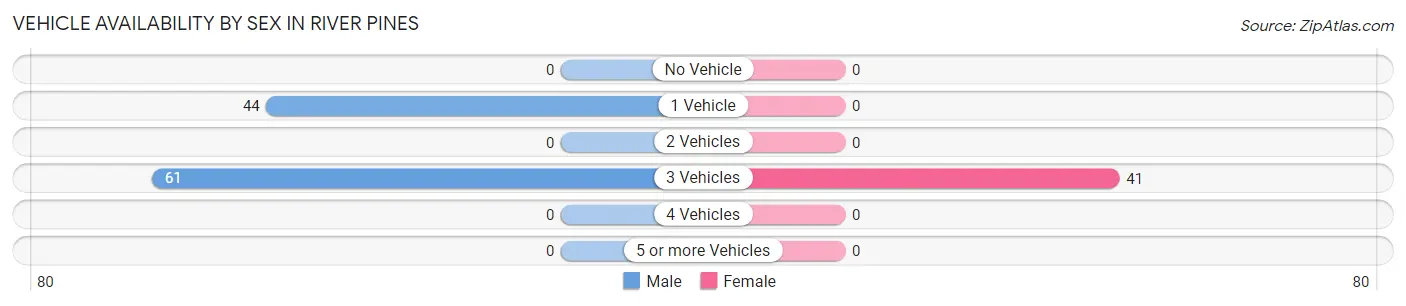
| Vehicles Available | Male | Female |
| No Vehicle | 0 (0.0%) | 0 (0.0%) |
| 1 Vehicle | 44 (41.9%) | 0 (0.0%) |
| 2 Vehicles | 0 (0.0%) | 0 (0.0%) |
| 3 Vehicles | 61 (58.1%) | 41 (100.0%) |
| 4 Vehicles | 0 (0.0%) | 0 (0.0%) |
| 5 or more Vehicles | 0 (0.0%) | 0 (0.0%) |
| Total | 105 (100.0%) | 41 (100.0%) |
Commute Time in River Pines
The most frequently occuring commute durations in River Pines are 25 to 29 minutes (61 commuters, 41.8%), 30 to 34 minutes (44 commuters, 30.1%), and 60 to 89 minutes (41 commuters, 28.1%).
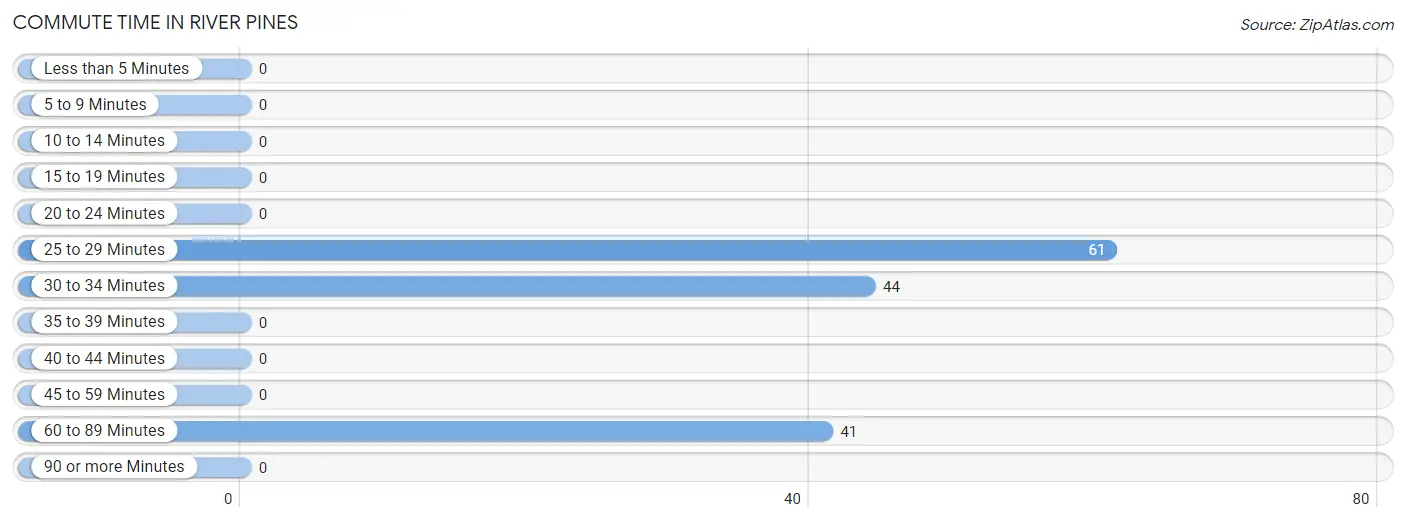
| Commute Time | # Commuters | % Commuters |
| Less than 5 Minutes | 0 | 0.0% |
| 5 to 9 Minutes | 0 | 0.0% |
| 10 to 14 Minutes | 0 | 0.0% |
| 15 to 19 Minutes | 0 | 0.0% |
| 20 to 24 Minutes | 0 | 0.0% |
| 25 to 29 Minutes | 61 | 41.8% |
| 30 to 34 Minutes | 44 | 30.1% |
| 35 to 39 Minutes | 0 | 0.0% |
| 40 to 44 Minutes | 0 | 0.0% |
| 45 to 59 Minutes | 0 | 0.0% |
| 60 to 89 Minutes | 41 | 28.1% |
| 90 or more Minutes | 0 | 0.0% |
Commute Time by Sex in River Pines
The most common commute times in River Pines are 25 to 29 minutes (61 commuters, 58.1%) for males and 60 to 89 minutes (41 commuters, 100.0%) for females.
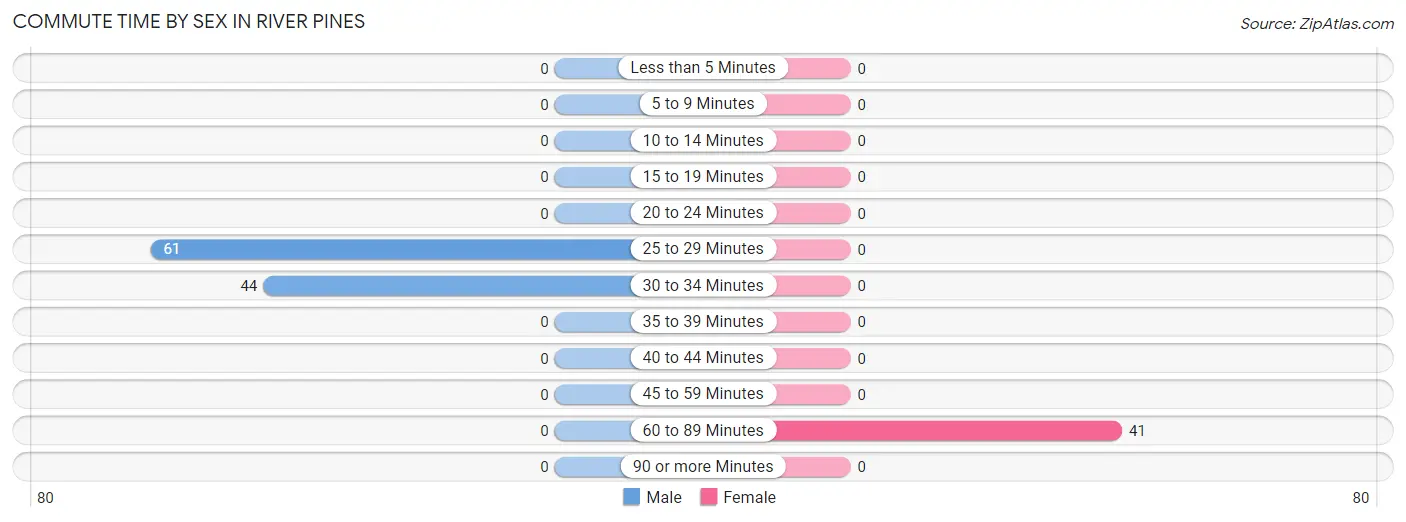
| Commute Time | Male | Female |
| Less than 5 Minutes | 0 (0.0%) | 0 (0.0%) |
| 5 to 9 Minutes | 0 (0.0%) | 0 (0.0%) |
| 10 to 14 Minutes | 0 (0.0%) | 0 (0.0%) |
| 15 to 19 Minutes | 0 (0.0%) | 0 (0.0%) |
| 20 to 24 Minutes | 0 (0.0%) | 0 (0.0%) |
| 25 to 29 Minutes | 61 (58.1%) | 0 (0.0%) |
| 30 to 34 Minutes | 44 (41.9%) | 0 (0.0%) |
| 35 to 39 Minutes | 0 (0.0%) | 0 (0.0%) |
| 40 to 44 Minutes | 0 (0.0%) | 0 (0.0%) |
| 45 to 59 Minutes | 0 (0.0%) | 0 (0.0%) |
| 60 to 89 Minutes | 0 (0.0%) | 41 (100.0%) |
| 90 or more Minutes | 0 (0.0%) | 0 (0.0%) |
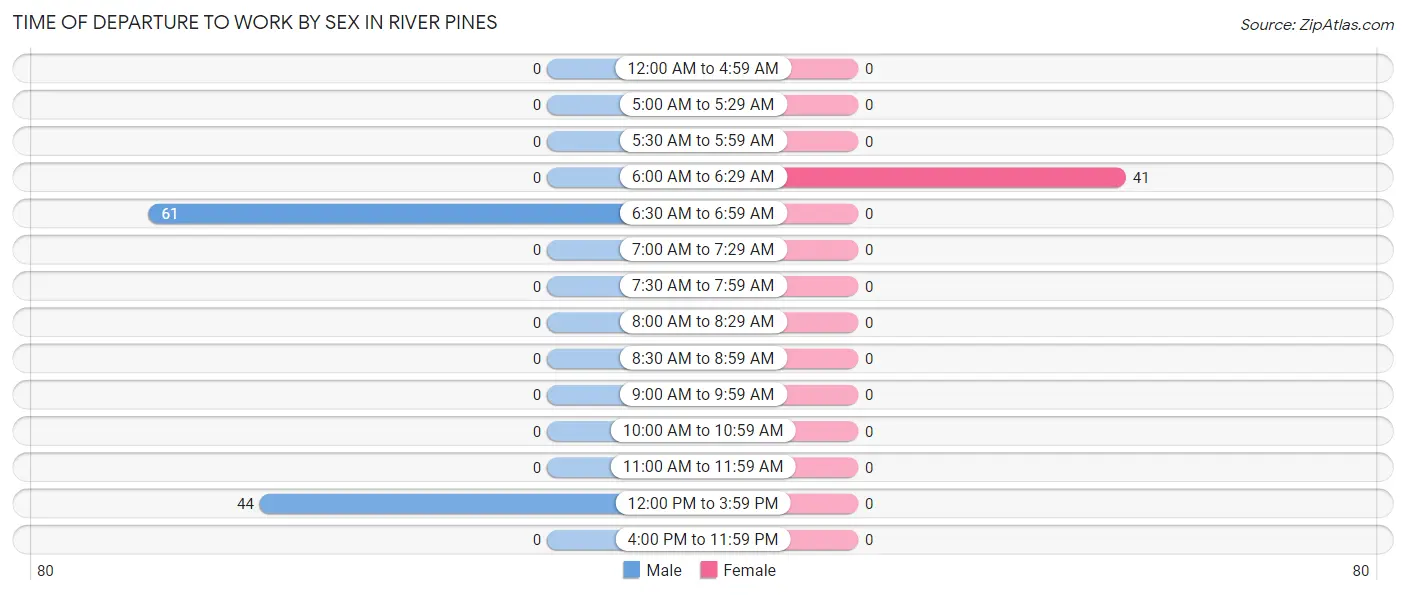
Time of Departure to Work by Sex in River Pines
The most frequent times of departure to work in River Pines are 6:30 AM to 6:59 AM (61, 58.1%) for males and 6:00 AM to 6:29 AM (41, 100.0%) for females.
| Time of Departure | Male | Female |
| 12:00 AM to 4:59 AM | 0 (0.0%) | 0 (0.0%) |
| 5:00 AM to 5:29 AM | 0 (0.0%) | 0 (0.0%) |
| 5:30 AM to 5:59 AM | 0 (0.0%) | 0 (0.0%) |
| 6:00 AM to 6:29 AM | 0 (0.0%) | 41 (100.0%) |
| 6:30 AM to 6:59 AM | 61 (58.1%) | 0 (0.0%) |
| 7:00 AM to 7:29 AM | 0 (0.0%) | 0 (0.0%) |
| 7:30 AM to 7:59 AM | 0 (0.0%) | 0 (0.0%) |
| 8:00 AM to 8:29 AM | 0 (0.0%) | 0 (0.0%) |
| 8:30 AM to 8:59 AM | 0 (0.0%) | 0 (0.0%) |
| 9:00 AM to 9:59 AM | 0 (0.0%) | 0 (0.0%) |
| 10:00 AM to 10:59 AM | 0 (0.0%) | 0 (0.0%) |
| 11:00 AM to 11:59 AM | 0 (0.0%) | 0 (0.0%) |
| 12:00 PM to 3:59 PM | 44 (41.9%) | 0 (0.0%) |
| 4:00 PM to 11:59 PM | 0 (0.0%) | 0 (0.0%) |
| Total | 105 (100.0%) | 41 (100.0%) |
Housing Occupancy in River Pines
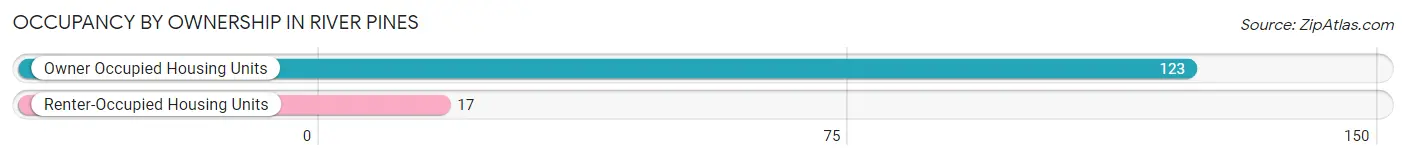
Occupancy by Ownership in River Pines
Of the total 140 dwellings in River Pines, owner-occupied units account for 123 (87.9%), while renter-occupied units make up 17 (12.1%).
| Occupancy | # Housing Units | % Housing Units |
| Owner Occupied Housing Units | 123 | 87.9% |
| Renter-Occupied Housing Units | 17 | 12.1% |
| Total Occupied Housing Units | 140 | 100.0% |
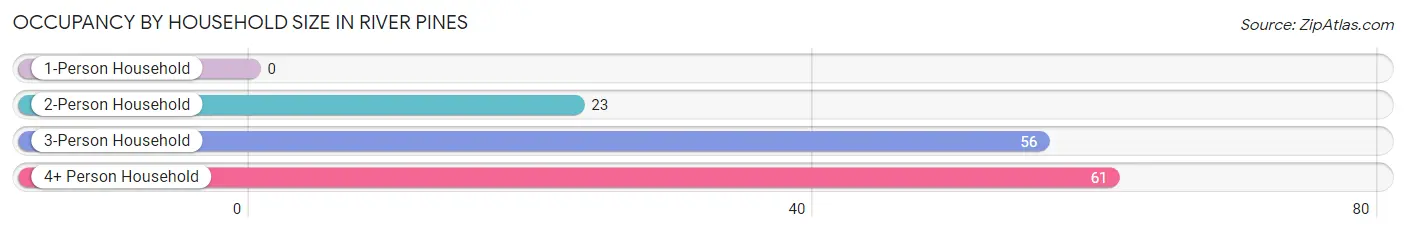
Occupancy by Household Size in River Pines
| Household Size | # Housing Units | % Housing Units |
| 1-Person Household | 0 | 0.0% |
| 2-Person Household | 23 | 16.4% |
| 3-Person Household | 56 | 40.0% |
| 4+ Person Household | 61 | 43.6% |
| Total Housing Units | 140 | 100.0% |
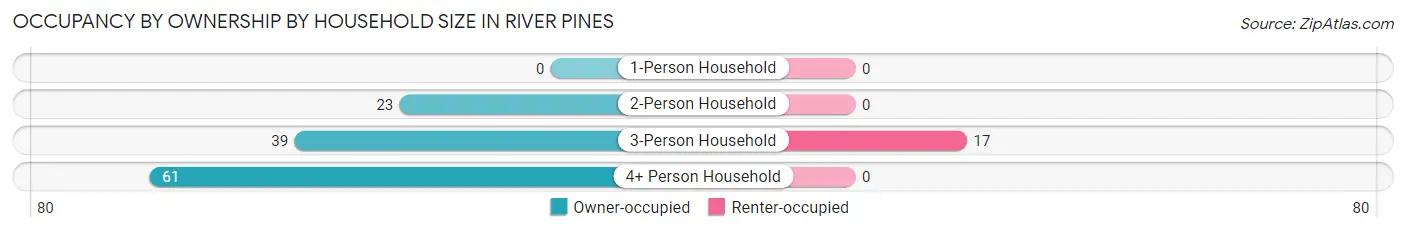
Occupancy by Ownership by Household Size in River Pines
| Household Size | Owner-occupied | Renter-occupied |
| 1-Person Household | 0 (0.0%) | 0 (0.0%) |
| 2-Person Household | 23 (100.0%) | 0 (0.0%) |
| 3-Person Household | 39 (69.6%) | 17 (30.4%) |
| 4+ Person Household | 61 (100.0%) | 0 (0.0%) |
| Total Housing Units | 123 (87.9%) | 17 (12.1%) |
Occupancy by Educational Attainment in River Pines
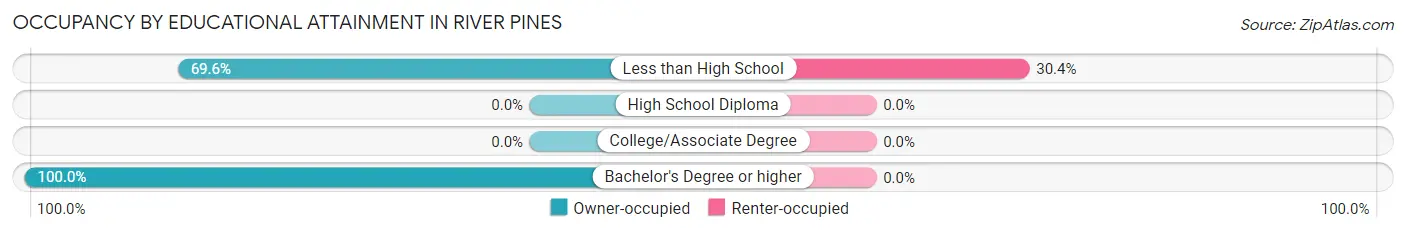
| Household Size | Owner-occupied | Renter-occupied |
| Less than High School | 39 (69.6%) | 17 (30.4%) |
| High School Diploma | 0 (0.0%) | 0 (0.0%) |
| College/Associate Degree | 0 (0.0%) | 0 (0.0%) |
| Bachelor's Degree or higher | 84 (100.0%) | 0 (0.0%) |
Occupancy by Age of Householder in River Pines
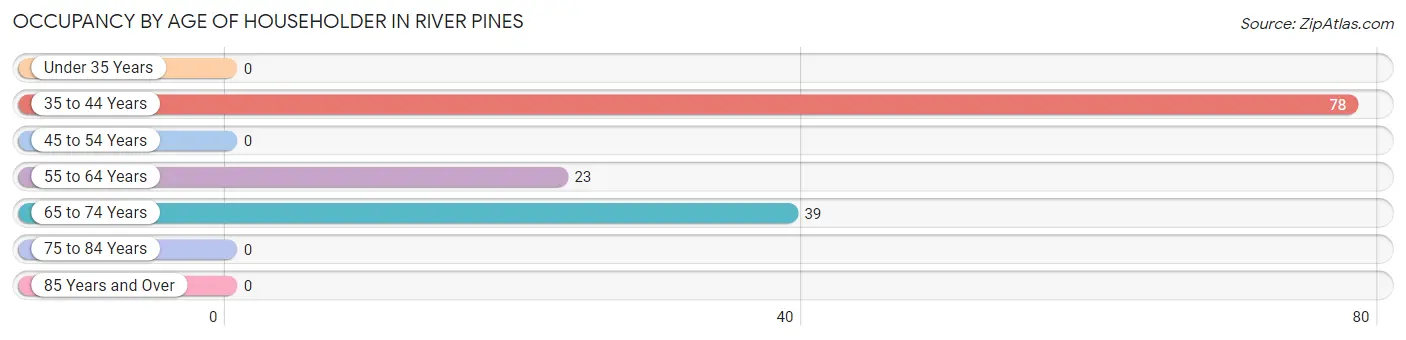
| Age Bracket | # Households | % Households |
| Under 35 Years | 0 | 0.0% |
| 35 to 44 Years | 78 | 55.7% |
| 45 to 54 Years | 0 | 0.0% |
| 55 to 64 Years | 23 | 16.4% |
| 65 to 74 Years | 39 | 27.9% |
| 75 to 84 Years | 0 | 0.0% |
| 85 Years and Over | 0 | 0.0% |
| Total | 140 | 100.0% |
Housing Finances in River Pines
Median Income by Occupancy in River Pines
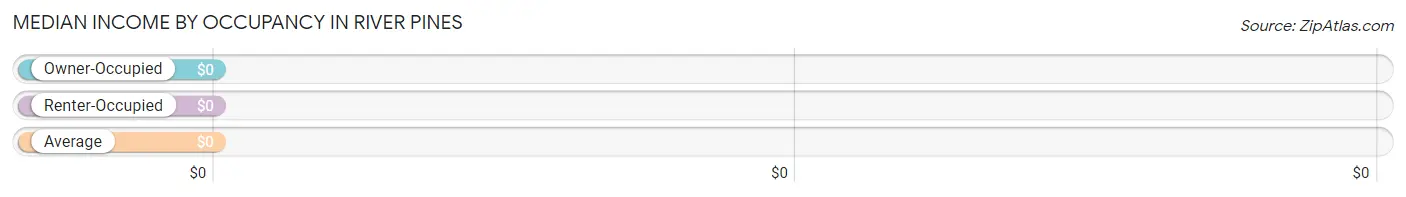
| Occupancy Type | # Households | Median Income |
| Owner-Occupied | 123 (87.9%) | $0 |
| Renter-Occupied | 17 (12.1%) | $0 |
| Average | 140 (100.0%) | $0 |
Occupancy by Householder Income Bracket in River Pines
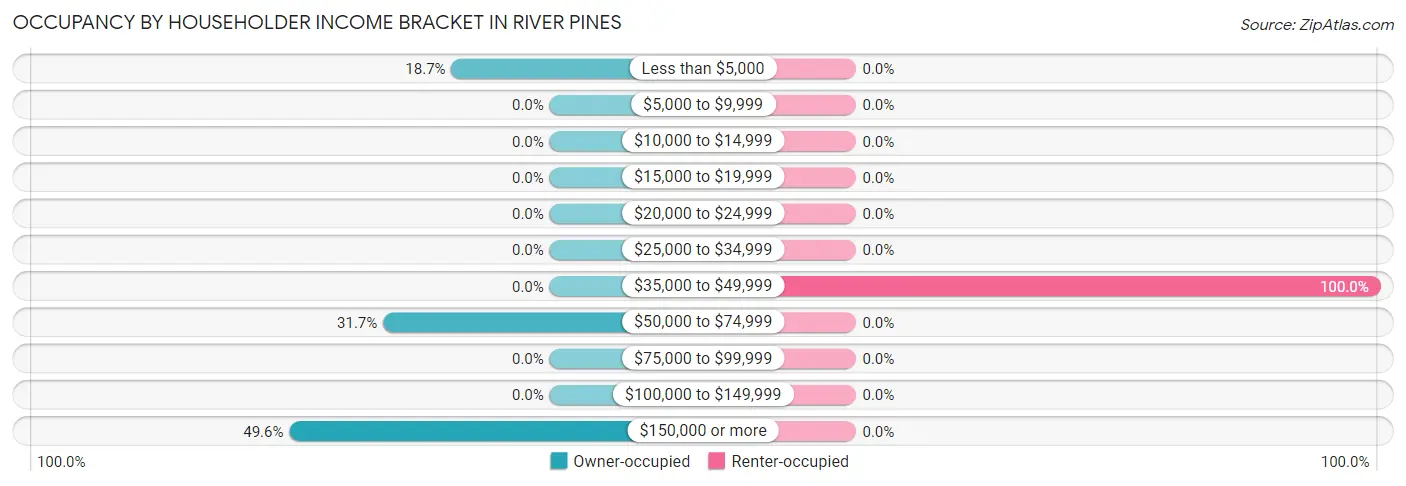
| Income Bracket | Owner-occupied | Renter-occupied |
| Less than $5,000 | 23 (18.7%) | 0 (0.0%) |
| $5,000 to $9,999 | 0 (0.0%) | 0 (0.0%) |
| $10,000 to $14,999 | 0 (0.0%) | 0 (0.0%) |
| $15,000 to $19,999 | 0 (0.0%) | 0 (0.0%) |
| $20,000 to $24,999 | 0 (0.0%) | 0 (0.0%) |
| $25,000 to $34,999 | 0 (0.0%) | 0 (0.0%) |
| $35,000 to $49,999 | 0 (0.0%) | 17 (100.0%) |
| $50,000 to $74,999 | 39 (31.7%) | 0 (0.0%) |
| $75,000 to $99,999 | 0 (0.0%) | 0 (0.0%) |
| $100,000 to $149,999 | 0 (0.0%) | 0 (0.0%) |
| $150,000 or more | 61 (49.6%) | 0 (0.0%) |
| Total | 123 (100.0%) | 17 (100.0%) |
Monthly Housing Cost Tiers in River Pines
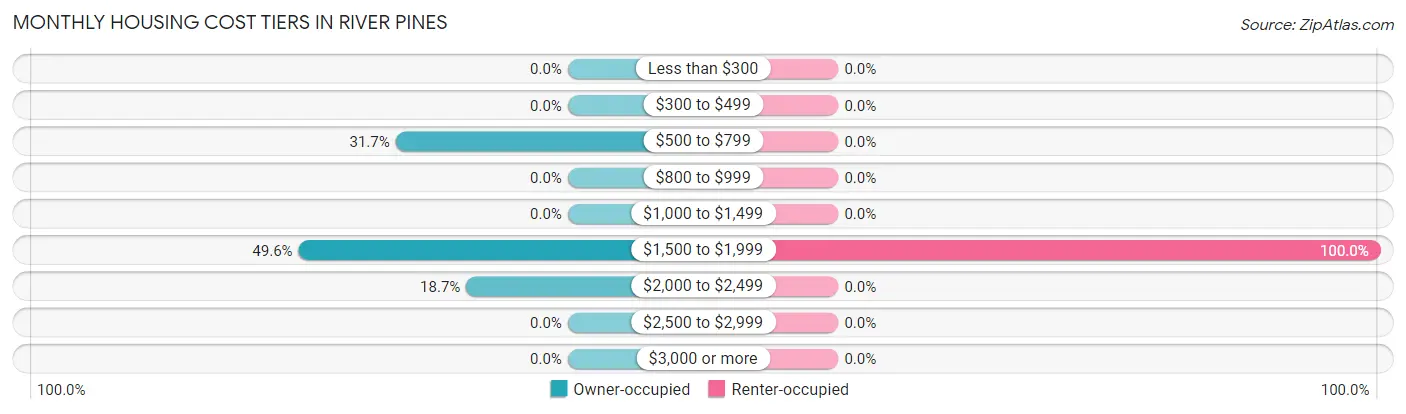
| Monthly Cost | Owner-occupied | Renter-occupied |
| Less than $300 | 0 (0.0%) | 0 (0.0%) |
| $300 to $499 | 0 (0.0%) | 0 (0.0%) |
| $500 to $799 | 39 (31.7%) | 0 (0.0%) |
| $800 to $999 | 0 (0.0%) | 0 (0.0%) |
| $1,000 to $1,499 | 0 (0.0%) | 0 (0.0%) |
| $1,500 to $1,999 | 61 (49.6%) | 17 (100.0%) |
| $2,000 to $2,499 | 23 (18.7%) | 0 (0.0%) |
| $2,500 to $2,999 | 0 (0.0%) | 0 (0.0%) |
| $3,000 or more | 0 (0.0%) | 0 (0.0%) |
| Total | 123 (100.0%) | 17 (100.0%) |
Physical Housing Characteristics in River Pines
Housing Structures in River Pines
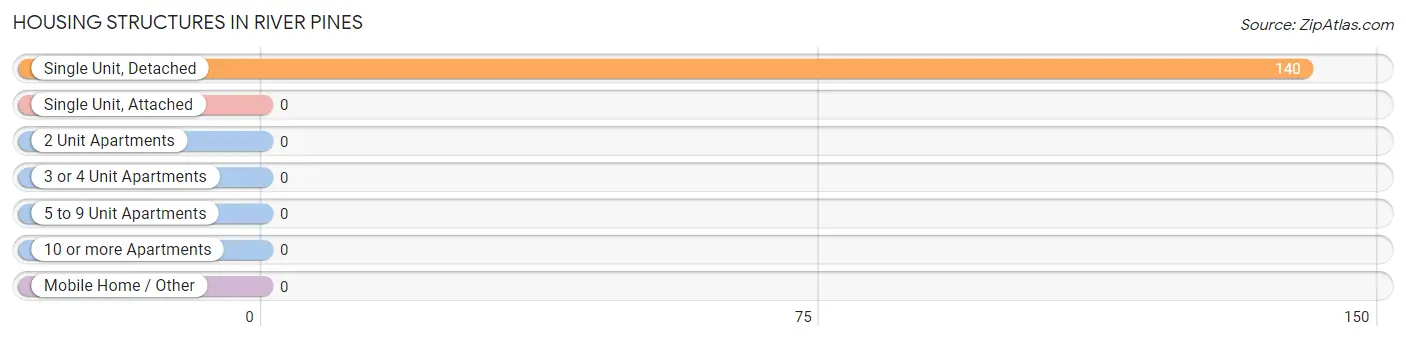
| Structure Type | # Housing Units | % Housing Units |
| Single Unit, Detached | 140 | 100.0% |
| Single Unit, Attached | 0 | 0.0% |
| 2 Unit Apartments | 0 | 0.0% |
| 3 or 4 Unit Apartments | 0 | 0.0% |
| 5 to 9 Unit Apartments | 0 | 0.0% |
| 10 or more Apartments | 0 | 0.0% |
| Mobile Home / Other | 0 | 0.0% |
| Total | 140 | 100.0% |
Housing Structures by Occupancy in River Pines
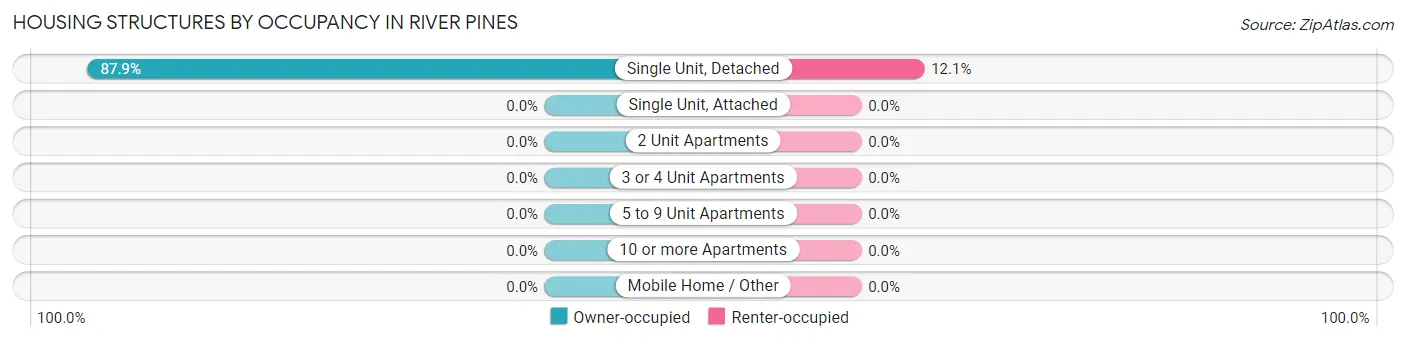
| Structure Type | Owner-occupied | Renter-occupied |
| Single Unit, Detached | 123 (87.9%) | 17 (12.1%) |
| Single Unit, Attached | 0 (0.0%) | 0 (0.0%) |
| 2 Unit Apartments | 0 (0.0%) | 0 (0.0%) |
| 3 or 4 Unit Apartments | 0 (0.0%) | 0 (0.0%) |
| 5 to 9 Unit Apartments | 0 (0.0%) | 0 (0.0%) |
| 10 or more Apartments | 0 (0.0%) | 0 (0.0%) |
| Mobile Home / Other | 0 (0.0%) | 0 (0.0%) |
| Total | 123 (87.9%) | 17 (12.1%) |
Housing Structures by Number of Rooms in River Pines
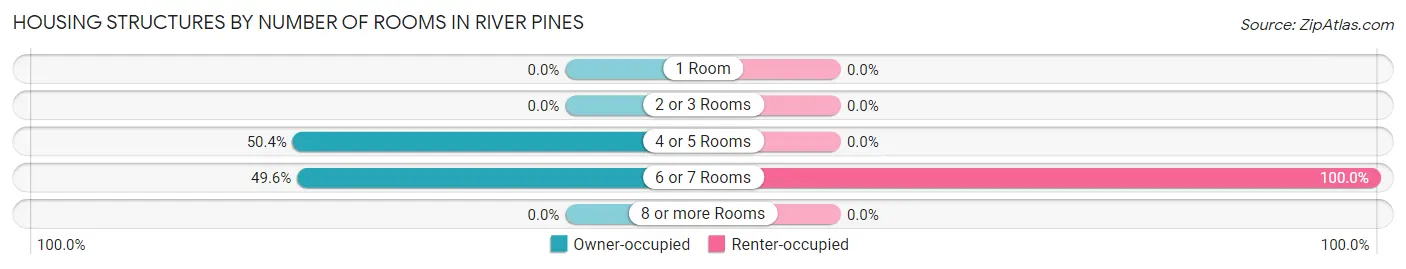
| Number of Rooms | Owner-occupied | Renter-occupied |
| 1 Room | 0 (0.0%) | 0 (0.0%) |
| 2 or 3 Rooms | 0 (0.0%) | 0 (0.0%) |
| 4 or 5 Rooms | 62 (50.4%) | 0 (0.0%) |
| 6 or 7 Rooms | 61 (49.6%) | 17 (100.0%) |
| 8 or more Rooms | 0 (0.0%) | 0 (0.0%) |
| Total | 123 (100.0%) | 17 (100.0%) |
Housing Structure by Heating Type in River Pines
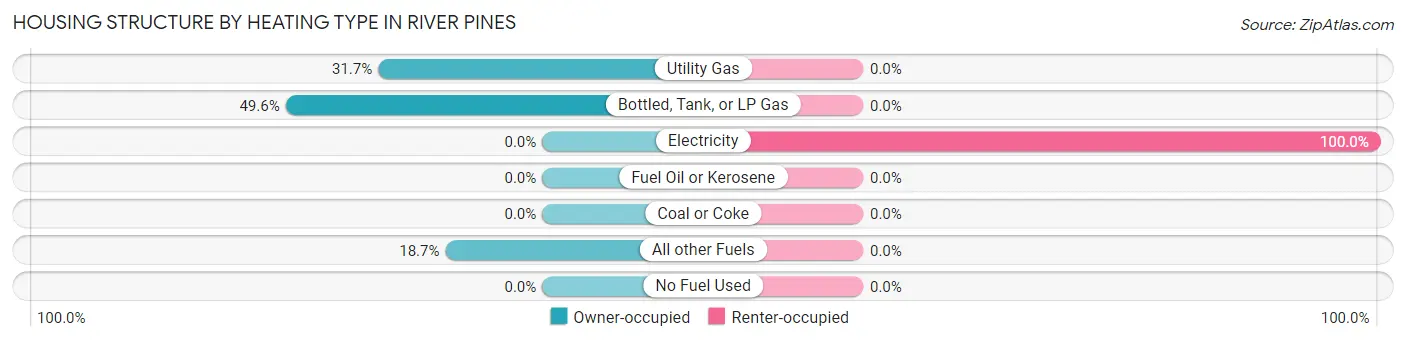
| Heating Type | Owner-occupied | Renter-occupied |
| Utility Gas | 39 (31.7%) | 0 (0.0%) |
| Bottled, Tank, or LP Gas | 61 (49.6%) | 0 (0.0%) |
| Electricity | 0 (0.0%) | 17 (100.0%) |
| Fuel Oil or Kerosene | 0 (0.0%) | 0 (0.0%) |
| Coal or Coke | 0 (0.0%) | 0 (0.0%) |
| All other Fuels | 23 (18.7%) | 0 (0.0%) |
| No Fuel Used | 0 (0.0%) | 0 (0.0%) |
| Total | 123 (100.0%) | 17 (100.0%) |
Household Vehicle Usage in River Pines
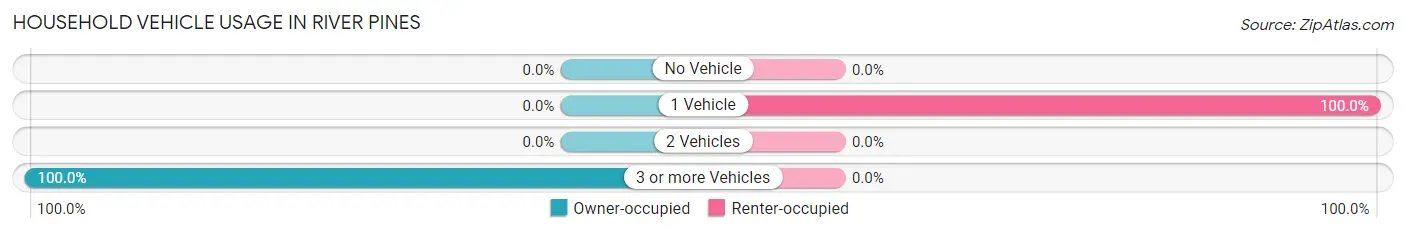
| Vehicles per Household | Owner-occupied | Renter-occupied |
| No Vehicle | 0 (0.0%) | 0 (0.0%) |
| 1 Vehicle | 0 (0.0%) | 17 (100.0%) |
| 2 Vehicles | 0 (0.0%) | 0 (0.0%) |
| 3 or more Vehicles | 123 (100.0%) | 0 (0.0%) |
| Total | 123 (100.0%) | 17 (100.0%) |
Real Estate & Mortgages in River Pines
Real Estate and Mortgage Overview in River Pines
| Characteristic | Without Mortgage | With Mortgage |
| Housing Units | 0 | 123 |
| Median Property Value | - | - |
| Median Household Income | - | - |
| Monthly Housing Costs | - | - |
| Real Estate Taxes | - | - |
Property Value by Mortgage Status in River Pines
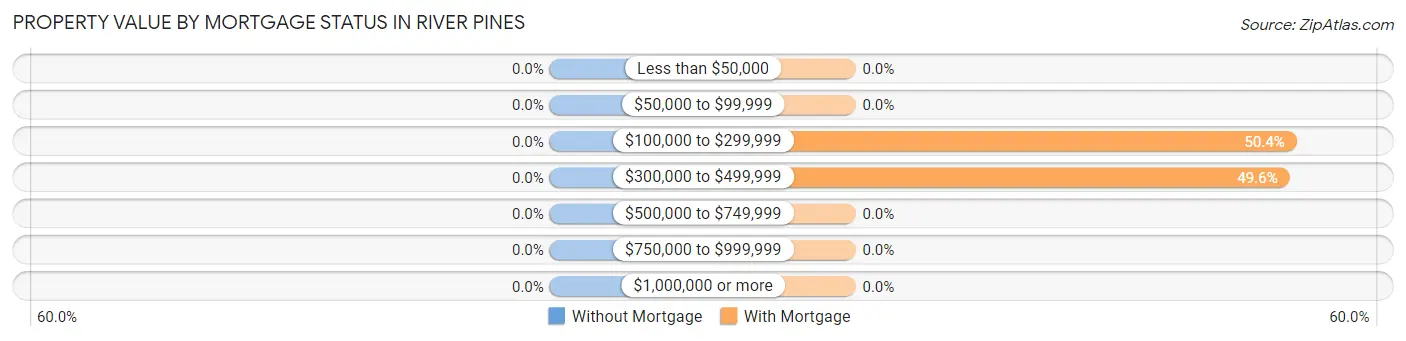
| Property Value | Without Mortgage | With Mortgage |
| Less than $50,000 | 0 (0.0%) | 0 (0.0%) |
| $50,000 to $99,999 | 0 (0.0%) | 0 (0.0%) |
| $100,000 to $299,999 | 0 (0.0%) | 62 (50.4%) |
| $300,000 to $499,999 | 0 (0.0%) | 61 (49.6%) |
| $500,000 to $749,999 | 0 (0.0%) | 0 (0.0%) |
| $750,000 to $999,999 | 0 (0.0%) | 0 (0.0%) |
| $1,000,000 or more | 0 (0.0%) | 0 (0.0%) |
| Total | 0 (0.0%) | 123 (100.0%) |
Household Income by Mortgage Status in River Pines
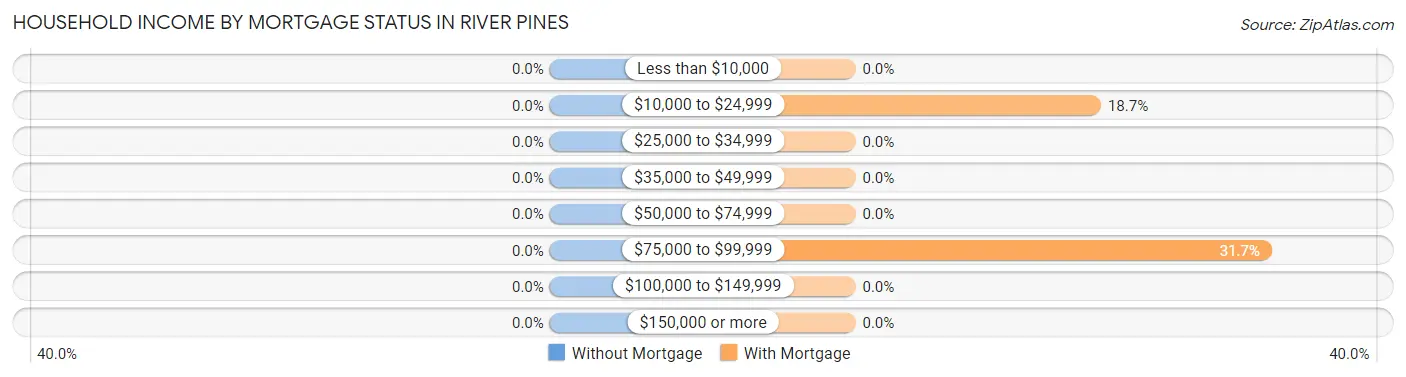
| Household Income | Without Mortgage | With Mortgage |
| Less than $10,000 | 0 (0.0%) | 0 (0.0%) |
| $10,000 to $24,999 | 0 (0.0%) | 23 (18.7%) |
| $25,000 to $34,999 | 0 (0.0%) | 0 (0.0%) |
| $35,000 to $49,999 | 0 (0.0%) | 0 (0.0%) |
| $50,000 to $74,999 | 0 (0.0%) | 0 (0.0%) |
| $75,000 to $99,999 | 0 (0.0%) | 39 (31.7%) |
| $100,000 to $149,999 | 0 (0.0%) | 0 (0.0%) |
| $150,000 or more | 0 (0.0%) | 0 (0.0%) |
| Total | 0 (0.0%) | 123 (100.0%) |
Property Value to Household Income Ratio in River Pines
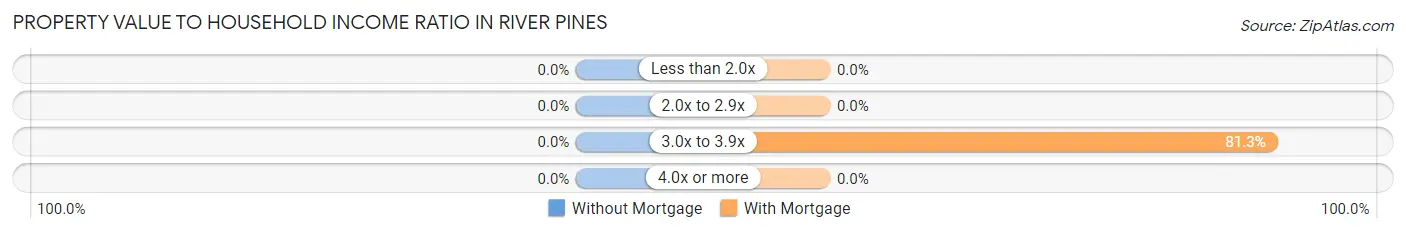
| Value-to-Income Ratio | Without Mortgage | With Mortgage |
| Less than 2.0x | 0 (0.0%) | 0 (0.0%) |
| 2.0x to 2.9x | 0 (0.0%) | 0 (0.0%) |
| 3.0x to 3.9x | 0 (0.0%) | 100 (81.3%) |
| 4.0x or more | 0 (0.0%) | 0 (0.0%) |
| Total | 0 (0.0%) | 123 (100.0%) |
Real Estate Taxes by Mortgage Status in River Pines
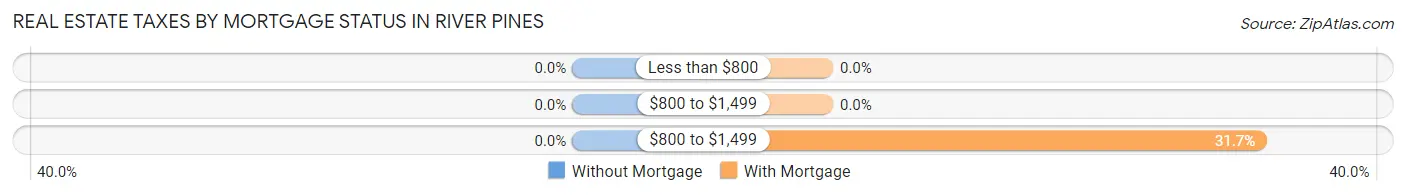
| Property Taxes | Without Mortgage | With Mortgage |
| Less than $800 | 0 (0.0%) | 0 (0.0%) |
| $800 to $1,499 | 0 (0.0%) | 0 (0.0%) |
| $800 to $1,499 | 0 (0.0%) | 39 (31.7%) |
| Total | 0 (0.0%) | 123 (100.0%) |
Health & Disability in River Pines
Health Insurance Coverage by Age in River Pines
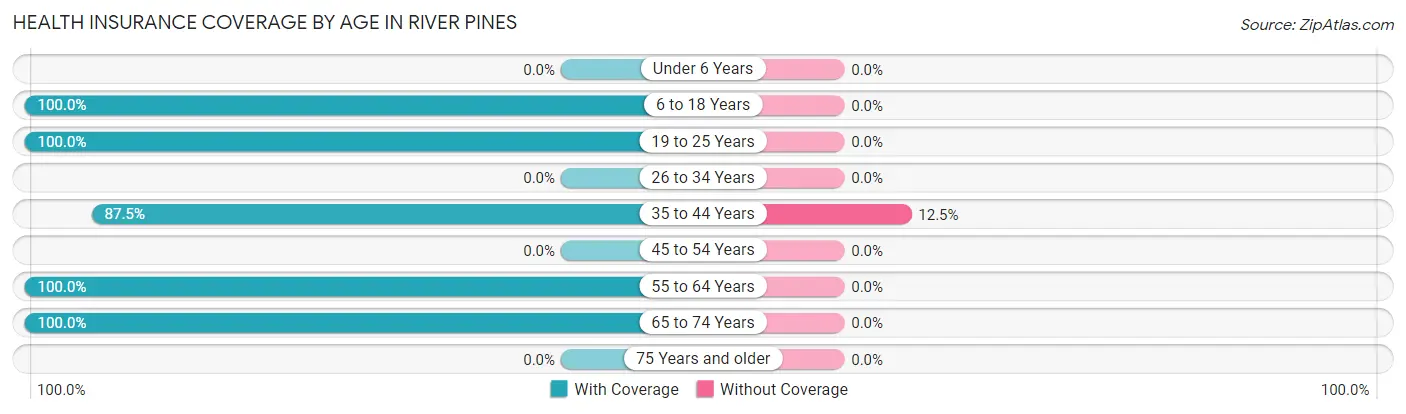
| Age Bracket | With Coverage | Without Coverage |
| Under 6 Years | 0 (0.0%) | 0 (0.0%) |
| 6 to 18 Years | 108 (100.0%) | 0 (0.0%) |
| 19 to 25 Years | 44 (100.0%) | 0 (0.0%) |
| 26 to 34 Years | 0 (0.0%) | 0 (0.0%) |
| 35 to 44 Years | 119 (87.5%) | 17 (12.5%) |
| 45 to 54 Years | 0 (0.0%) | 0 (0.0%) |
| 55 to 64 Years | 66 (100.0%) | 0 (0.0%) |
| 65 to 74 Years | 133 (100.0%) | 0 (0.0%) |
| 75 Years and older | 0 (0.0%) | 0 (0.0%) |
| Total | 470 (96.5%) | 17 (3.5%) |
Health Insurance Coverage by Citizenship Status in River Pines

| Citizenship Status | With Coverage | Without Coverage |
| Native Born | 0 (0.0%) | 0 (0.0%) |
| Foreign Born, Citizen | 108 (100.0%) | 0 (0.0%) |
| Foreign Born, not a Citizen | 44 (100.0%) | 0 (0.0%) |
Health Insurance Coverage by Household Income in River Pines
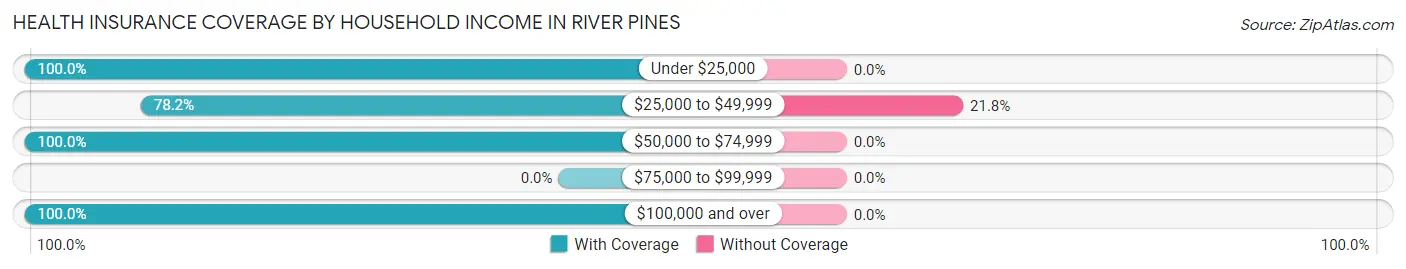
| Household Income | With Coverage | Without Coverage |
| Under $25,000 | 66 (100.0%) | 0 (0.0%) |
| $25,000 to $49,999 | 61 (78.2%) | 17 (21.8%) |
| $50,000 to $74,999 | 133 (100.0%) | 0 (0.0%) |
| $75,000 to $99,999 | 0 (0.0%) | 0 (0.0%) |
| $100,000 and over | 210 (100.0%) | 0 (0.0%) |
Public vs Private Health Insurance Coverage by Age in River Pines
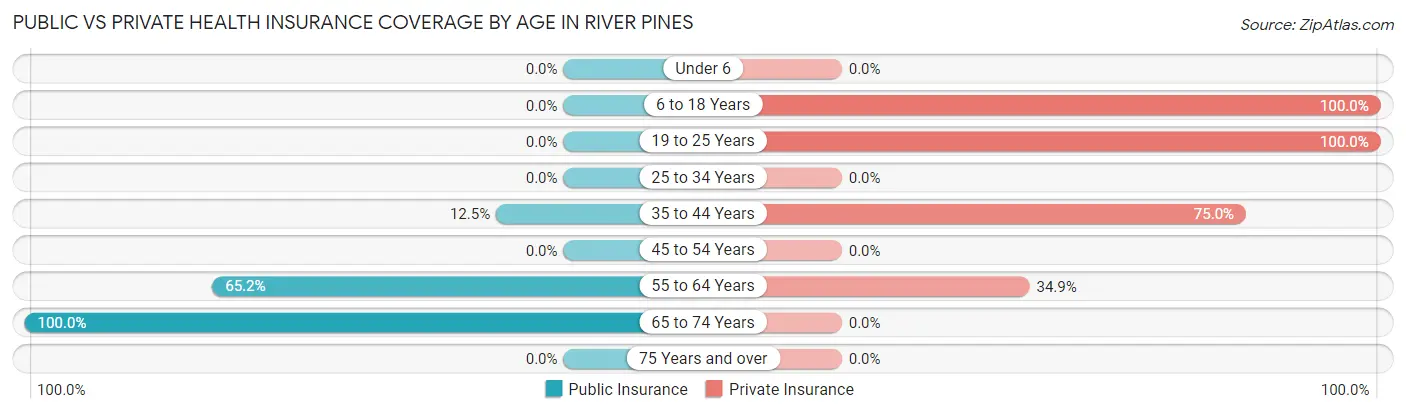
| Age Bracket | Public Insurance | Private Insurance |
| Under 6 | 0 (0.0%) | 0 (0.0%) |
| 6 to 18 Years | 0 (0.0%) | 108 (100.0%) |
| 19 to 25 Years | 0 (0.0%) | 44 (100.0%) |
| 25 to 34 Years | 0 (0.0%) | 0 (0.0%) |
| 35 to 44 Years | 17 (12.5%) | 102 (75.0%) |
| 45 to 54 Years | 0 (0.0%) | 0 (0.0%) |
| 55 to 64 Years | 43 (65.1%) | 23 (34.8%) |
| 65 to 74 Years | 133 (100.0%) | 0 (0.0%) |
| 75 Years and over | 0 (0.0%) | 0 (0.0%) |
| Total | 193 (39.6%) | 277 (56.9%) |
Disability Status by Sex by Age in River Pines
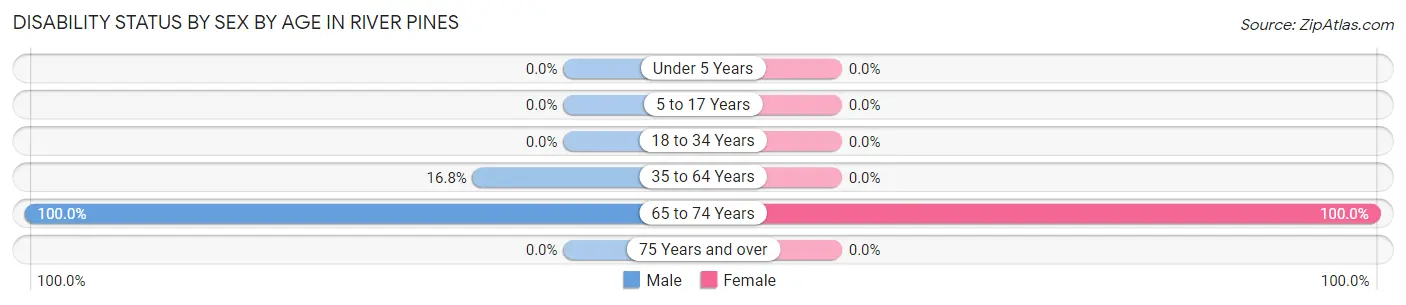
| Age Bracket | Male | Female |
| Under 5 Years | 0 (0.0%) | 0 (0.0%) |
| 5 to 17 Years | 0 (0.0%) | 0 (0.0%) |
| 18 to 34 Years | 0 (0.0%) | 0 (0.0%) |
| 35 to 64 Years | 17 (16.8%) | 0 (0.0%) |
| 65 to 74 Years | 39 (100.0%) | 94 (100.0%) |
| 75 Years and over | 0 (0.0%) | 0 (0.0%) |
Disability Class by Sex by Age in River Pines
Disability Class: Hearing Difficulty
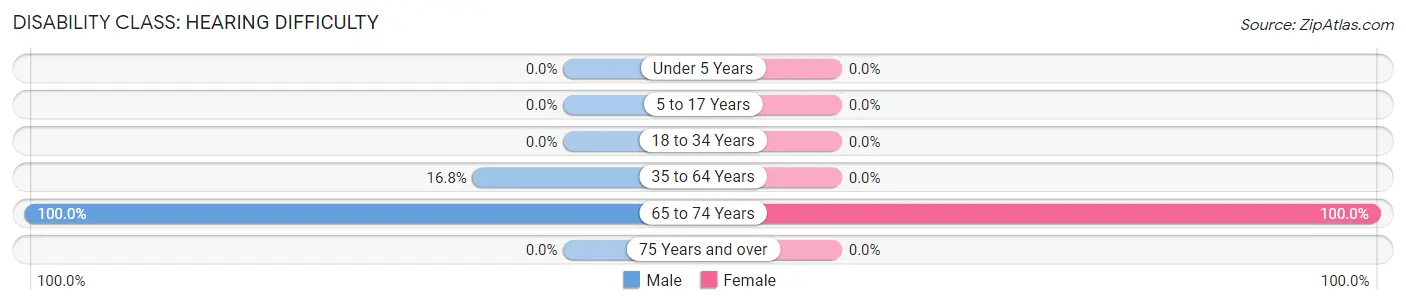
| Age Bracket | Male | Female |
| Under 5 Years | 0 (0.0%) | 0 (0.0%) |
| 5 to 17 Years | 0 (0.0%) | 0 (0.0%) |
| 18 to 34 Years | 0 (0.0%) | 0 (0.0%) |
| 35 to 64 Years | 17 (16.8%) | 0 (0.0%) |
| 65 to 74 Years | 39 (100.0%) | 94 (100.0%) |
| 75 Years and over | 0 (0.0%) | 0 (0.0%) |
Disability Class: Vision Difficulty
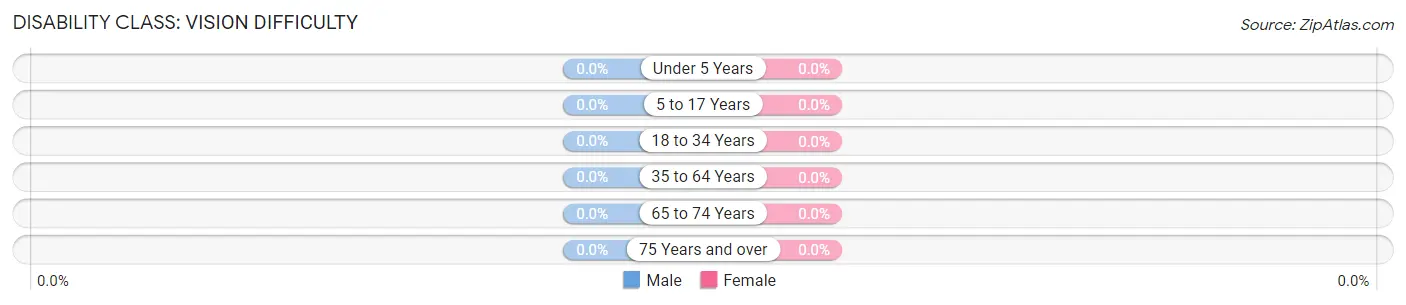
| Age Bracket | Male | Female |
| Under 5 Years | 0 (0.0%) | 0 (0.0%) |
| 5 to 17 Years | 0 (0.0%) | 0 (0.0%) |
| 18 to 34 Years | 0 (0.0%) | 0 (0.0%) |
| 35 to 64 Years | 0 (0.0%) | 0 (0.0%) |
| 65 to 74 Years | 0 (0.0%) | 0 (0.0%) |
| 75 Years and over | 0 (0.0%) | 0 (0.0%) |
Disability Class: Cognitive Difficulty

| Age Bracket | Male | Female |
| 5 to 17 Years | 0 (0.0%) | 0 (0.0%) |
| 18 to 34 Years | 0 (0.0%) | 0 (0.0%) |
| 35 to 64 Years | 0 (0.0%) | 0 (0.0%) |
| 65 to 74 Years | 0 (0.0%) | 51 (54.3%) |
| 75 Years and over | 0 (0.0%) | 0 (0.0%) |
Disability Class: Ambulatory Difficulty
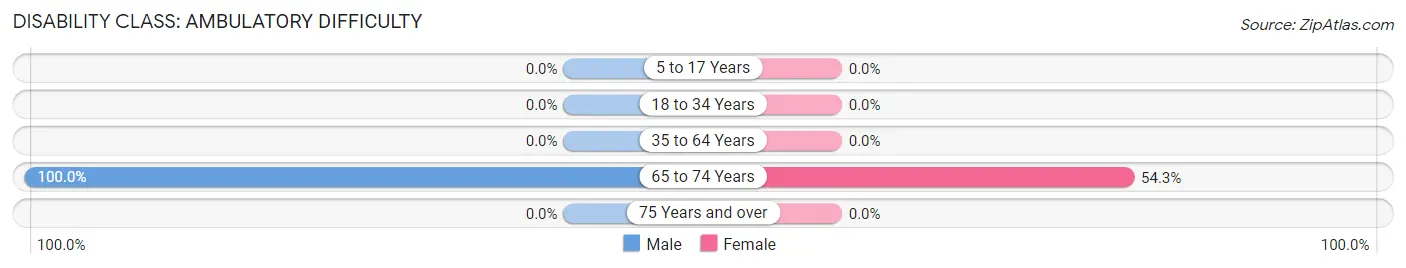
| Age Bracket | Male | Female |
| 5 to 17 Years | 0 (0.0%) | 0 (0.0%) |
| 18 to 34 Years | 0 (0.0%) | 0 (0.0%) |
| 35 to 64 Years | 0 (0.0%) | 0 (0.0%) |
| 65 to 74 Years | 39 (100.0%) | 51 (54.3%) |
| 75 Years and over | 0 (0.0%) | 0 (0.0%) |
Disability Class: Self-Care Difficulty
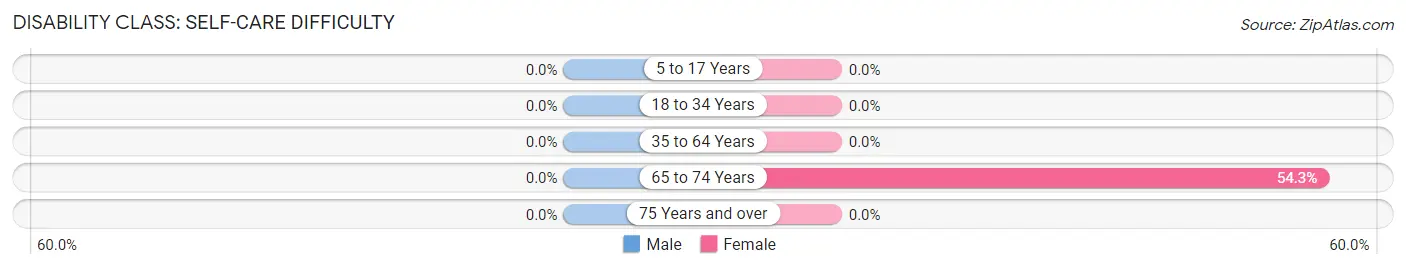
| Age Bracket | Male | Female |
| 5 to 17 Years | 0 (0.0%) | 0 (0.0%) |
| 18 to 34 Years | 0 (0.0%) | 0 (0.0%) |
| 35 to 64 Years | 0 (0.0%) | 0 (0.0%) |
| 65 to 74 Years | 0 (0.0%) | 51 (54.3%) |
| 75 Years and over | 0 (0.0%) | 0 (0.0%) |
Technology Access in River Pines
Computing Device Access in River Pines
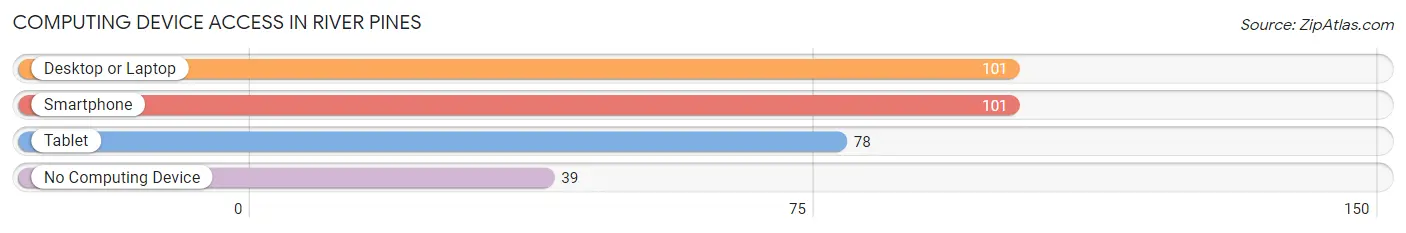
| Device Type | # Households | % Households |
| Desktop or Laptop | 101 | 72.1% |
| Smartphone | 101 | 72.1% |
| Tablet | 78 | 55.7% |
| No Computing Device | 39 | 27.9% |
| Total | 140 | 100.0% |
Internet Access in River Pines
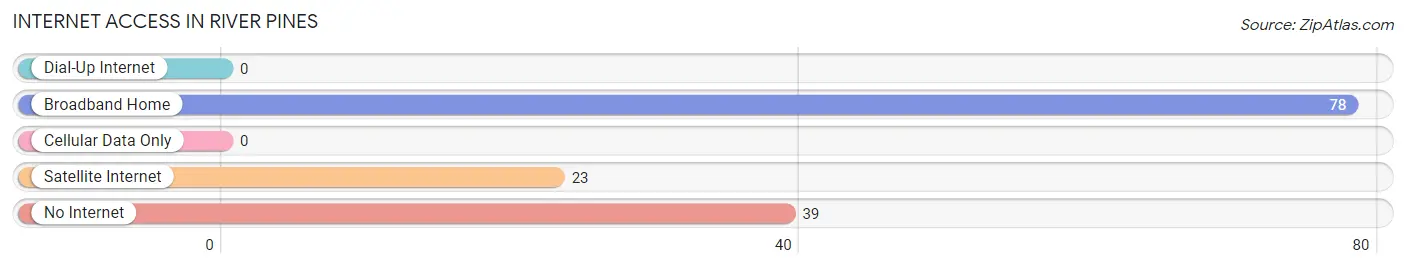
| Internet Type | # Households | % Households |
| Dial-Up Internet | 0 | 0.0% |
| Broadband Home | 78 | 55.7% |
| Cellular Data Only | 0 | 0.0% |
| Satellite Internet | 23 | 16.4% |
| No Internet | 39 | 27.9% |
| Total | 140 | 100.0% |
River Pines Summary
River Pines is a small unincorporated community located in Calaveras County, California. It is situated in the Sierra Nevada foothills, approximately 25 miles east of the city of Angels Camp. The community is located along the banks of the Mokelumne River, and is home to a population of approximately 1,000 people.
History
The area that is now River Pines was originally inhabited by the Miwok and Yokut Native American tribes. The first European settlers arrived in the area in the mid-1800s, and the town was officially established in 1854. The town was named after the abundance of pine trees in the area.
In the late 1800s, the town became a popular destination for gold miners, and the population grew rapidly. The town was also home to a number of businesses, including a hotel, saloon, and general store.
In the early 1900s, the town began to decline as the gold rush ended and the population dwindled. The town was eventually abandoned in the 1940s, and the buildings were left to decay.
In the 1970s, the town was rediscovered by a group of artists and musicians who were looking for a place to escape the hustle and bustle of city life. They began to restore the buildings and the town slowly began to come back to life.
Today, River Pines is a popular destination for outdoor enthusiasts, with a number of hiking trails, camping sites, and fishing spots. The town is also home to a number of art galleries, restaurants, and shops.
Geography
River Pines is located in the Sierra Nevada foothills, approximately 25 miles east of the city of Angels Camp. The town is situated along the banks of the Mokelumne River, and is surrounded by rolling hills and lush forests.
The climate in River Pines is mild, with hot summers and cool winters. The average temperature in the summer is around 80 degrees Fahrenheit, and the average temperature in the winter is around 40 degrees Fahrenheit.
Economy
The economy of River Pines is largely based on tourism. The town is a popular destination for outdoor enthusiasts, and there are a number of hiking trails, camping sites, and fishing spots in the area.
The town is also home to a number of art galleries, restaurants, and shops. The town is also home to a number of wineries, and the local wine industry is a major contributor to the economy.
Demographics
As of the 2010 census, the population of River Pines was 1,000 people. The racial makeup of the town was 94.2% White, 0.7% African American, 0.7% Native American, 0.7% Asian, 0.7% from other races, and 2.7% from two or more races.
The median household income in River Pines was $45,000, and the median family income was $50,000. The per capita income in the town was $20,000. The poverty rate in the town was 8.3%.
Common Questions
What is Per Capita Income in River Pines?
Per Capita income in River Pines is $23,738.
What is Inequality or Gini Index in River Pines?
Inequality or Gini Index in River Pines is 0.37.
What is the Total Population of River Pines?
Total Population of River Pines is 487.
What is the Total Male Population of River Pines?
Total Male Population of River Pines is 264.
What is the Total Female Population of River Pines?
Total Female Population of River Pines is 223.
What is the Ratio of Males per 100 Females in River Pines?
There are 118.39 Males per 100 Females in River Pines.
What is the Ratio of Females per 100 Males in River Pines?
There are 84.47 Females per 100 Males in River Pines.
What is the Median Population Age in River Pines?
Median Population Age in River Pines is 37.7 Years.
What is the Average Family Size in River Pines
Average Family Size in River Pines is 3.6 People.
What is the Average Household Size in River Pines
Average Household Size in River Pines is 3.5 People.
How Large is the Labor Force in River Pines?
There are 146 People in the Labor Forcein in River Pines.
What is the Percentage of People in the Labor Force in River Pines?
38.5% of People are in the Labor Force in River Pines.