Cities with the Highest Percentage of Population with a Degree in Visual and Performing Arts in Montana
RELATED REPORTS & OPTIONS
Visual and Performing Arts
Montana
Compare Cities
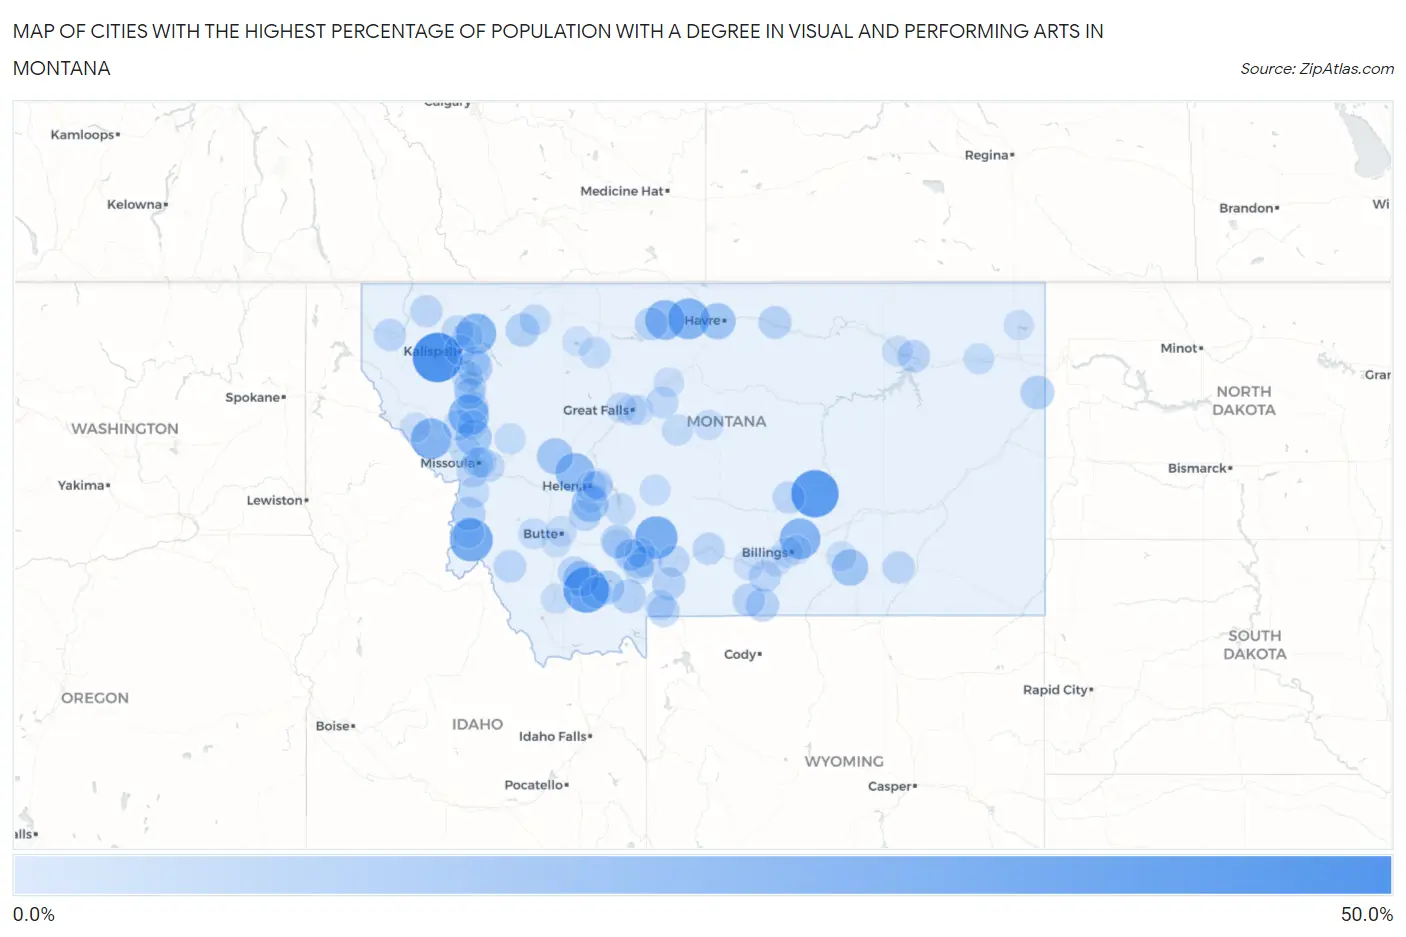
Map of Cities with the Highest Percentage of Population with a Degree in Visual and Performing Arts in Montana
0.0%
50.0%
Cities with the Highest Percentage of Population with a Degree in Visual and Performing Arts in Montana
| City | % Graduates | vs State | vs National | |
| 1. | Little Bitterroot Lake | 50.0% | 3.8%(+46.2)#1 | 4.3%(+45.7)#117 |
| 2. | Musselshell | 44.4% | 3.8%(+40.7)#2 | 4.3%(+40.2)#154 |
| 3. | Alder | 39.1% | 3.8%(+35.3)#3 | 4.3%(+34.9)#180 |
| 4. | Conner | 33.3% | 3.8%(+29.6)#4 | 4.3%(+29.1)#257 |
| 5. | Sedan | 32.1% | 3.8%(+28.4)#5 | 4.3%(+27.9)#280 |
| 6. | Gildford | 28.0% | 3.8%(+24.2)#6 | 4.3%(+23.7)#357 |
| 7. | Riverbend | 27.8% | 3.8%(+24.0)#7 | 4.3%(+23.5)#359 |
| 8. | Shepherd | 27.4% | 3.8%(+23.6)#8 | 4.3%(+23.1)#366 |
| 9. | Charlo | 26.9% | 3.8%(+23.1)#9 | 4.3%(+22.7)#377 |
| 10. | Martin City | 26.7% | 3.8%(+22.9)#10 | 4.3%(+22.4)#384 |
| 11. | Inverness | 25.0% | 3.8%(+21.2)#11 | 4.3%(+20.7)#448 |
| 12. | Marysville | 23.5% | 3.8%(+19.7)#12 | 4.3%(+19.3)#475 |
| 13. | Jefferson City | 17.6% | 3.8%(+13.9)#13 | 4.3%(+13.4)#803 |
| 14. | Crow Agency | 17.0% | 3.8%(+13.2)#14 | 4.3%(+12.8)#845 |
| 15. | Beaver Creek | 16.7% | 3.8%(+12.9)#15 | 4.3%(+12.4)#882 |
| 16. | Arlee | 16.4% | 3.8%(+12.6)#16 | 4.3%(+12.1)#923 |
| 17. | Lincoln | 16.0% | 3.8%(+12.3)#17 | 4.3%(+11.8)#950 |
| 18. | Sheridan | 15.6% | 3.8%(+11.8)#18 | 4.3%(+11.3)#1,003 |
| 19. | Woods Bay | 13.2% | 3.8%(+9.46)#19 | 4.3%(+8.99)#1,316 |
| 20. | Big Sky | 10.7% | 3.8%(+6.95)#20 | 4.3%(+6.48)#1,819 |
| 21. | Sidney | 10.7% | 3.8%(+6.94)#21 | 4.3%(+6.47)#1,824 |
| 22. | East Glacier Park Village | 10.4% | 3.8%(+6.66)#22 | 4.3%(+6.20)#1,918 |
| 23. | Ennis | 9.8% | 3.8%(+6.05)#23 | 4.3%(+5.58)#2,125 |
| 24. | Hamilton | 9.8% | 3.8%(+6.01)#24 | 4.3%(+5.54)#2,134 |
| 25. | Wheatland | 9.7% | 3.8%(+5.94)#25 | 4.3%(+5.48)#2,162 |
| 26. | Belfry | 9.3% | 3.8%(+5.52)#26 | 4.3%(+5.05)#2,326 |
| 27. | Pray | 8.9% | 3.8%(+5.13)#27 | 4.3%(+4.66)#2,501 |
| 28. | Chester | 8.7% | 3.8%(+4.88)#28 | 4.3%(+4.41)#2,619 |
| 29. | Harlem | 8.6% | 3.8%(+4.82)#29 | 4.3%(+4.35)#2,642 |
| 30. | Red Lodge | 7.9% | 3.8%(+4.08)#30 | 4.3%(+3.61)#3,049 |
| 31. | Nashua | 7.8% | 3.8%(+4.03)#31 | 4.3%(+3.56)#3,082 |
| 32. | Wisdom | 7.7% | 3.8%(+3.91)#32 | 4.3%(+3.44)#3,172 |
| 33. | Ronan | 7.5% | 3.8%(+3.75)#33 | 4.3%(+3.28)#3,278 |
| 34. | Lame Deer | 7.4% | 3.8%(+3.62)#34 | 4.3%(+3.16)#3,350 |
| 35. | Kings Point | 7.4% | 3.8%(+3.57)#35 | 4.3%(+3.10)#3,398 |
| 36. | Amsterdam | 7.3% | 3.8%(+3.53)#36 | 4.3%(+3.06)#3,436 |
| 37. | Roundup | 7.1% | 3.8%(+3.32)#37 | 4.3%(+2.85)#3,625 |
| 38. | Libby | 7.1% | 3.8%(+3.30)#38 | 4.3%(+2.83)#3,636 |
| 39. | Twin Creeks | 6.9% | 3.8%(+3.11)#39 | 4.3%(+2.64)#3,795 |
| 40. | Big Timber | 6.8% | 3.8%(+3.06)#40 | 4.3%(+2.59)#3,842 |
| 41. | Twin Bridges | 6.8% | 3.8%(+3.04)#41 | 4.3%(+2.57)#3,879 |
| 42. | Trego | 6.6% | 3.8%(+2.84)#42 | 4.3%(+2.37)#4,097 |
| 43. | Joliet | 6.6% | 3.8%(+2.83)#43 | 4.3%(+2.36)#4,109 |
| 44. | Lolo | 6.5% | 3.8%(+2.75)#44 | 4.3%(+2.28)#4,165 |
| 45. | Gardiner | 6.5% | 3.8%(+2.72)#45 | 4.3%(+2.25)#4,199 |
| 46. | Pine Creek | 6.5% | 3.8%(+2.67)#46 | 4.3%(+2.20)#4,243 |
| 47. | Boulder | 6.2% | 3.8%(+2.47)#47 | 4.3%(+2.00)#4,429 |
| 48. | Whitefish | 6.2% | 3.8%(+2.41)#48 | 4.3%(+1.94)#4,513 |
| 49. | Four Corners | 6.1% | 3.8%(+2.31)#49 | 4.3%(+1.84)#4,610 |
| 50. | Virginia City | 5.9% | 3.8%(+2.10)#50 | 4.3%(+1.63)#4,860 |
| 51. | Bozeman | 5.9% | 3.8%(+2.09)#51 | 4.3%(+1.62)#4,873 |
| 52. | Turah | 5.7% | 3.8%(+1.96)#52 | 4.3%(+1.50)#5,010 |
| 53. | Livingston | 5.6% | 3.8%(+1.85)#53 | 4.3%(+1.38)#5,136 |
| 54. | Highwood | 5.6% | 3.8%(+1.77)#54 | 4.3%(+1.30)#5,254 |
| 55. | Conrad | 5.2% | 3.8%(+1.40)#55 | 4.3%(+0.928)#5,733 |
| 56. | Frenchtown | 5.1% | 3.8%(+1.32)#56 | 4.3%(+0.847)#5,850 |
| 57. | Browning | 4.9% | 3.8%(+1.16)#57 | 4.3%(+0.686)#6,102 |
| 58. | Geyser | 4.8% | 3.8%(+0.979)#58 | 4.3%(+0.510)#6,435 |
| 59. | Missoula | 4.8% | 3.8%(+0.970)#59 | 4.3%(+0.501)#6,448 |
| 60. | Townsend | 4.7% | 3.8%(+0.905)#60 | 4.3%(+0.435)#6,550 |
| 61. | Dixon | 4.7% | 3.8%(+0.868)#61 | 4.3%(+0.399)#6,627 |
| 62. | Rollins | 4.6% | 3.8%(+0.815)#62 | 4.3%(+0.346)#6,725 |
| 63. | Corwin Springs | 4.5% | 3.8%(+0.695)#63 | 4.3%(+0.226)#6,954 |
| 64. | Churchill | 4.4% | 3.8%(+0.648)#64 | 4.3%(+0.178)#7,040 |
| 65. | Seeley Lake | 4.4% | 3.8%(+0.642)#65 | 4.3%(+0.173)#7,049 |
| 66. | Darby | 4.2% | 3.8%(+0.384)#66 | 4.3%(-0.085)#7,574 |
| 67. | Stevensville | 4.1% | 3.8%(+0.278)#67 | 4.3%(-0.191)#7,797 |
| 68. | White Sulphur Springs | 4.0% | 3.8%(+0.261)#68 | 4.3%(-0.208)#7,830 |
| 69. | Polson | 4.0% | 3.8%(+0.250)#69 | 4.3%(-0.219)#7,857 |
| 70. | East Missoula | 4.0% | 3.8%(+0.217)#70 | 4.3%(-0.252)#7,923 |
| 71. | Poplar | 4.0% | 3.8%(+0.217)#71 | 4.3%(-0.252)#7,928 |
| 72. | Anaconda Deer Lodge County | 4.0% | 3.8%(+0.198)#72 | 4.3%(-0.272)#7,974 |
| 73. | Great Falls | 3.7% | 3.8%(-0.034)#73 | 4.3%(-0.503)#8,503 |
| 74. | Kalispell | 3.7% | 3.8%(-0.038)#74 | 4.3%(-0.508)#8,510 |
| 75. | Glasgow | 3.7% | 3.8%(-0.038)#75 | 4.3%(-0.508)#8,511 |
| 76. | Helena | 3.5% | 3.8%(-0.294)#76 | 4.3%(-0.763)#9,101 |
| 77. | Columbia Falls | 3.4% | 3.8%(-0.354)#77 | 4.3%(-0.823)#9,244 |
| 78. | Billings | 3.3% | 3.8%(-0.455)#78 | 4.3%(-0.924)#9,532 |
| 79. | Walkerville | 3.3% | 3.8%(-0.477)#79 | 4.3%(-0.946)#9,584 |
| 80. | Clancy | 3.2% | 3.8%(-0.621)#80 | 4.3%(-1.09)#9,936 |
| 81. | Dillon | 3.1% | 3.8%(-0.643)#81 | 4.3%(-1.11)#9,990 |
| 82. | Sun Prairie | 3.0% | 3.8%(-0.787)#82 | 4.3%(-1.26)#10,376 |
| 83. | Gallatin Gateway | 3.0% | 3.8%(-0.787)#83 | 4.3%(-1.26)#10,377 |
| 84. | Helena Valley Southeast | 2.9% | 3.8%(-0.853)#84 | 4.3%(-1.32)#10,530 |
| 85. | East Helena | 2.8% | 3.8%(-0.948)#85 | 4.3%(-1.42)#10,783 |
| 86. | St Regis | 2.8% | 3.8%(-1.01)#86 | 4.3%(-1.47)#10,941 |
| 87. | Columbus | 2.7% | 3.8%(-1.07)#87 | 4.3%(-1.54)#11,092 |
| 88. | Laurel | 2.6% | 3.8%(-1.21)#88 | 4.3%(-1.68)#11,447 |
| 89. | Fort Benton | 2.5% | 3.8%(-1.28)#89 | 4.3%(-1.75)#11,639 |
| 90. | Bigfork | 2.5% | 3.8%(-1.28)#90 | 4.3%(-1.75)#11,675 |
| 91. | Denton | 2.4% | 3.8%(-1.34)#91 | 4.3%(-1.81)#11,824 |
| 92. | Belgrade | 2.4% | 3.8%(-1.38)#92 | 4.3%(-1.85)#11,904 |
| 93. | Hardin | 2.3% | 3.8%(-1.50)#93 | 4.3%(-1.97)#12,200 |
| 94. | St Ignatius | 2.3% | 3.8%(-1.51)#94 | 4.3%(-1.98)#12,224 |
| 95. | Medicine Lake | 2.2% | 3.8%(-1.56)#95 | 4.3%(-2.03)#12,348 |
| 96. | Malmstrom Afb | 2.1% | 3.8%(-1.67)#96 | 4.3%(-2.14)#12,621 |
| 97. | Butte Silver Bow Balance | 1.9% | 3.8%(-1.85)#97 | 4.3%(-2.32)#13,061 |
| 98. | Lockwood | 1.9% | 3.8%(-1.91)#98 | 4.3%(-2.38)#13,205 |
| 99. | Valier | 1.8% | 3.8%(-1.98)#99 | 4.3%(-2.45)#13,376 |
| 100. | Three Forks | 1.8% | 3.8%(-2.01)#100 | 4.3%(-2.48)#13,451 |
Common Questions
What are the Top 10 Cities with the Highest Percentage of Population with a Degree in Visual and Performing Arts in Montana?
Top 10 Cities with the Highest Percentage of Population with a Degree in Visual and Performing Arts in Montana are:
#1
50.0%
#2
44.4%
#3
39.1%
#4
33.3%
#5
32.1%
#6
28.0%
#7
27.8%
#8
27.4%
#9
26.9%
#10
26.7%
What city has the Highest Percentage of Population with a Degree in Visual and Performing Arts in Montana?
Little Bitterroot Lake has the Highest Percentage of Population with a Degree in Visual and Performing Arts in Montana with 50.0%.
What is the Percentage of Population with a Degree in Visual and Performing Arts in the State of Montana?
Percentage of Population with a Degree in Visual and Performing Arts in Montana is 3.8%.
What is the Percentage of Population with a Degree in Visual and Performing Arts in the United States?
Percentage of Population with a Degree in Visual and Performing Arts in the United States is 4.3%.