Zip Codes with the Highest Percentage of Population with a Degree in Visual and Performing Arts in Chula Vista, CA
RELATED REPORTS & OPTIONS
Visual and Performing Arts
Chula Vista
Compare Zip Codes
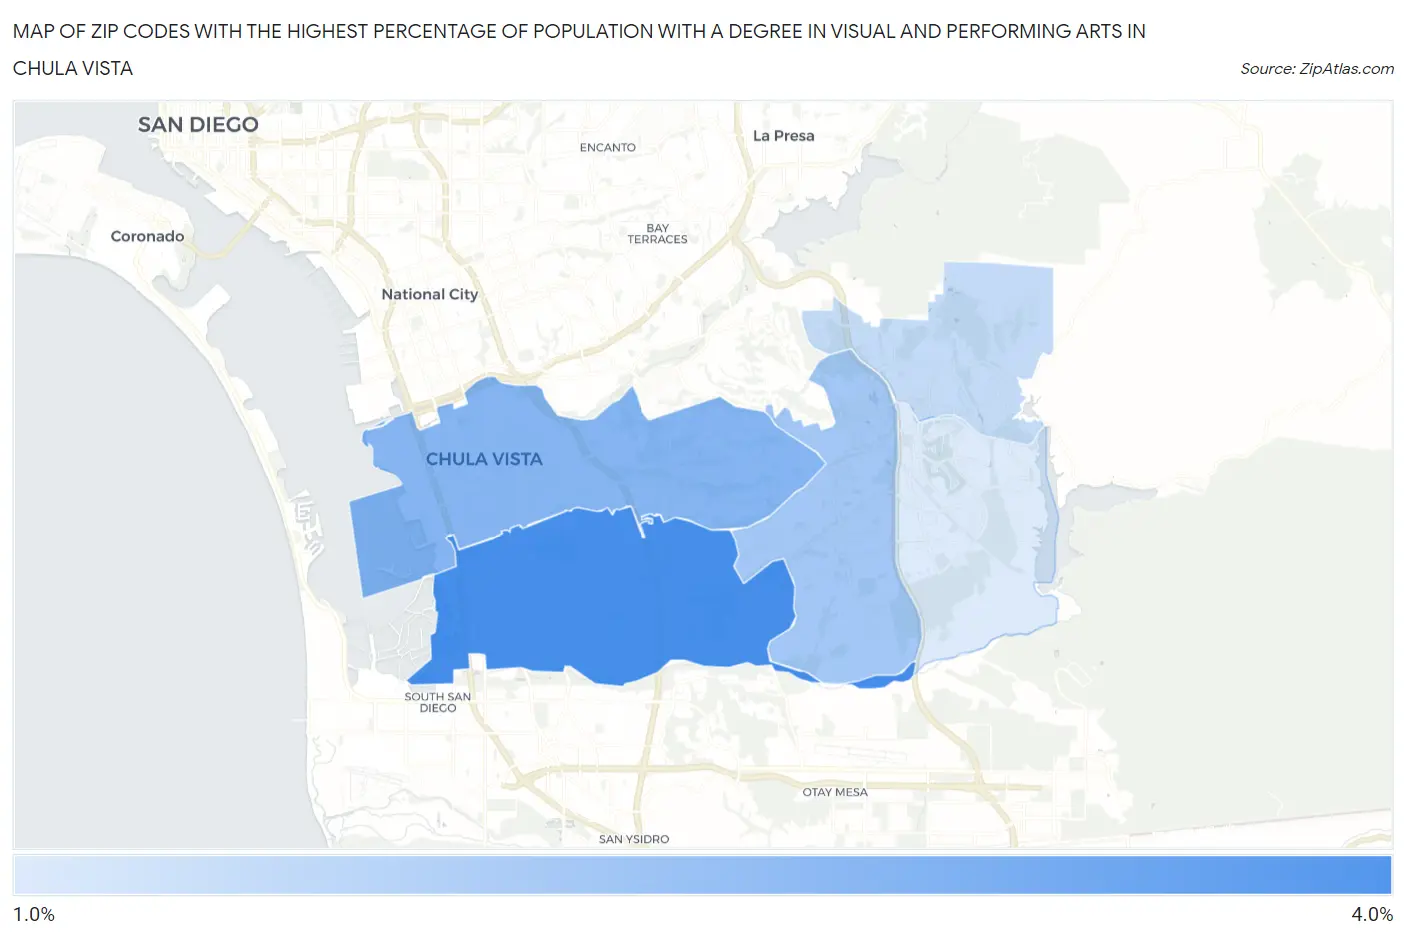
Map of Zip Codes with the Highest Percentage of Population with a Degree in Visual and Performing Arts in Chula Vista
1.5%
3.3%
Zip Codes with the Highest Percentage of Population with a Degree in Visual and Performing Arts in Chula Vista, CA
| Zip Code | % Graduates | vs State | vs National | |
| 1. | 91911 | 3.3% | 5.7%(-2.43)#1,034 | 4.3%(-0.942)#11,568 |
| 2. | 91910 | 2.5% | 5.7%(-3.20)#1,187 | 4.3%(-1.71)#14,492 |
| 3. | 91913 | 2.2% | 5.7%(-3.55)#1,249 | 4.3%(-2.07)#15,765 |
| 4. | 91914 | 1.8% | 5.7%(-3.94)#1,297 | 4.3%(-2.45)#17,133 |
| 5. | 91915 | 1.5% | 5.7%(-4.25)#1,337 | 4.3%(-2.77)#18,214 |
1
Common Questions
What are the Top 3 Zip Codes with the Highest Percentage of Population with a Degree in Visual and Performing Arts in Chula Vista, CA?
Top 3 Zip Codes with the Highest Percentage of Population with a Degree in Visual and Performing Arts in Chula Vista, CA are:
What zip code has the Highest Percentage of Population with a Degree in Visual and Performing Arts in Chula Vista, CA?
91911 has the Highest Percentage of Population with a Degree in Visual and Performing Arts in Chula Vista, CA with 3.3%.
What is the Percentage of Population with a Degree in Visual and Performing Arts in Chula Vista, CA?
Percentage of Population with a Degree in Visual and Performing Arts in Chula Vista is 2.3%.
What is the Percentage of Population with a Degree in Visual and Performing Arts in California?
Percentage of Population with a Degree in Visual and Performing Arts in California is 5.7%.
What is the Percentage of Population with a Degree in Visual and Performing Arts in the United States?
Percentage of Population with a Degree in Visual and Performing Arts in the United States is 4.3%.