Manchester, CA Map & Demographics
Manchester Map
Manchester Overview
$26,763
PER CAPITA INCOME
$58,342
AVG HOUSEHOLD INCOME
65.9%
WAGE / INCOME GAP [ % ]
34.1¢/ $1
WAGE / INCOME GAP [ $ ]
0.37
INEQUALITY / GINI INDEX
298
TOTAL POPULATION
162
MALE POPULATION
136
FEMALE POPULATION
119.12
MALES / 100 FEMALES
83.95
FEMALES / 100 MALES
44.1
MEDIAN AGE
2.8
AVG FAMILY SIZE
2.7
AVG HOUSEHOLD SIZE
250
LABOR FORCE [ PEOPLE ]
90.9%
PERCENT IN LABOR FORCE
5.6%
UNEMPLOYMENT RATE
Manchester Zip Codes
Manchester Area Codes
Income in Manchester
Income Overview in Manchester
| Characteristic | Number | Measure |
| Per Capita Income | 298 | $26,763 |
| Median Family Income | 75 | $0 |
| Mean Family Income | 75 | $68,209 |
| Median Household Income | 111 | $58,342 |
| Mean Household Income | 111 | $67,183 |
| Income Deficit | 75 | $0 |
| Wage / Income Gap (%) | 298 | 65.93% |
| Wage / Income Gap ($) | 298 | 34.07¢ per $1 |
| Gini / Inequality Index | 298 | 0.37 |
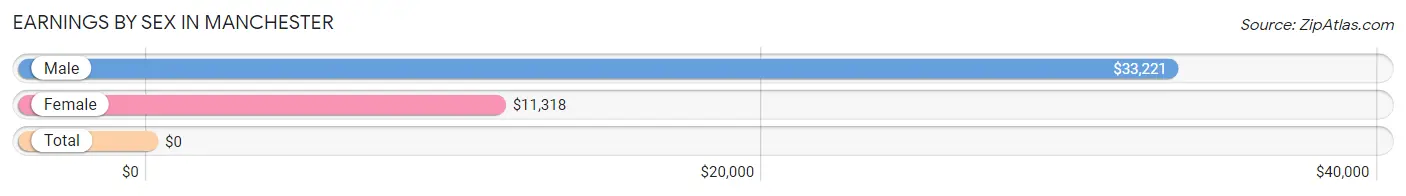
Earnings by Sex in Manchester
| Sex | Number | Average Earnings |
| Male | 120 (49.4%) | $33,221 |
| Female | 123 (50.6%) | $11,318 |
| Total | 243 (100.0%) | $0 |
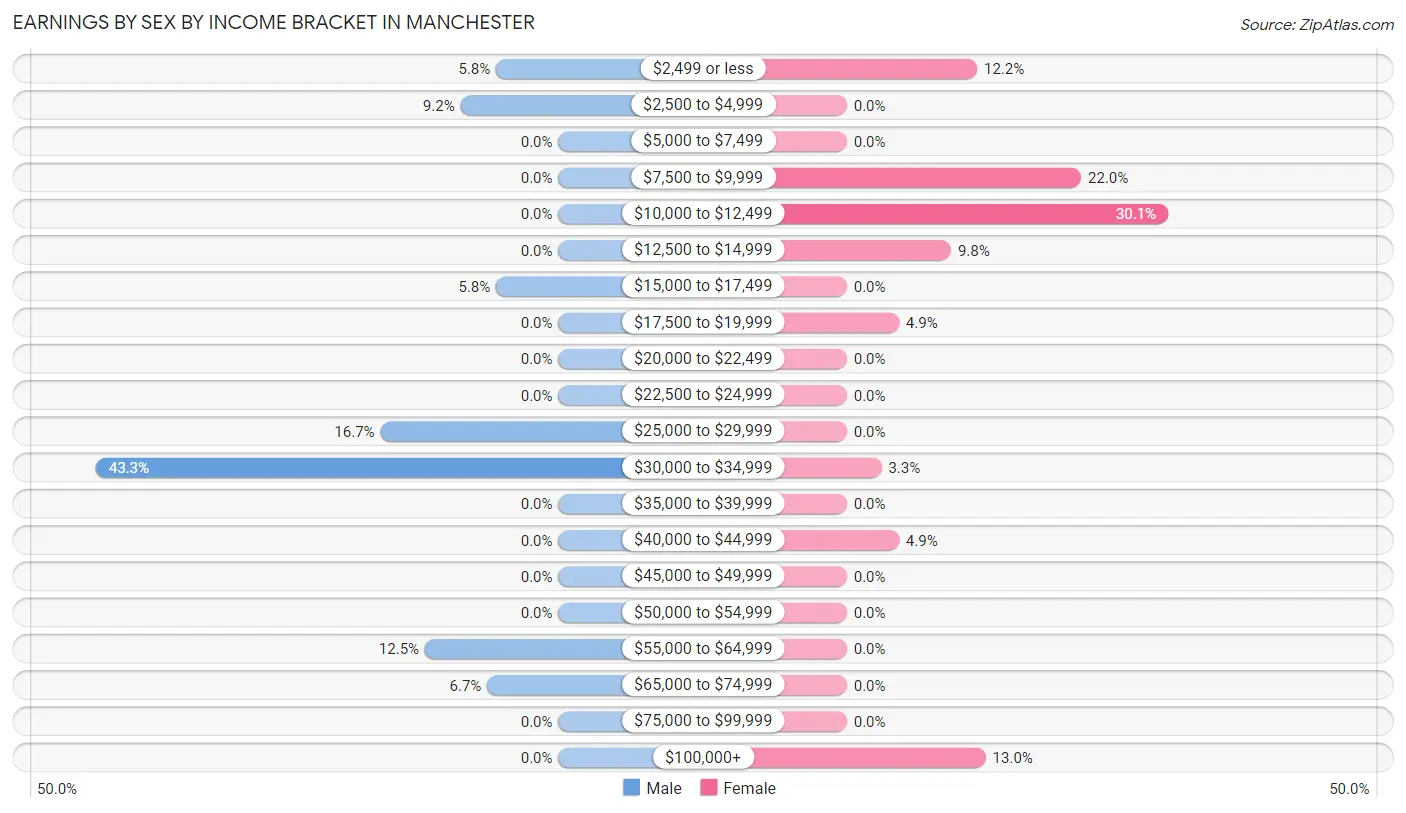
Earnings by Sex by Income Bracket in Manchester
The most common earnings brackets in Manchester are $30,000 to $34,999 for men (52 | 43.3%) and $10,000 to $12,499 for women (37 | 30.1%).
| Income | Male | Female |
| $2,499 or less | 7 (5.8%) | 15 (12.2%) |
| $2,500 to $4,999 | 11 (9.2%) | 0 (0.0%) |
| $5,000 to $7,499 | 0 (0.0%) | 0 (0.0%) |
| $7,500 to $9,999 | 0 (0.0%) | 27 (22.0%) |
| $10,000 to $12,499 | 0 (0.0%) | 37 (30.1%) |
| $12,500 to $14,999 | 0 (0.0%) | 12 (9.8%) |
| $15,000 to $17,499 | 7 (5.8%) | 0 (0.0%) |
| $17,500 to $19,999 | 0 (0.0%) | 6 (4.9%) |
| $20,000 to $22,499 | 0 (0.0%) | 0 (0.0%) |
| $22,500 to $24,999 | 0 (0.0%) | 0 (0.0%) |
| $25,000 to $29,999 | 20 (16.7%) | 0 (0.0%) |
| $30,000 to $34,999 | 52 (43.3%) | 4 (3.3%) |
| $35,000 to $39,999 | 0 (0.0%) | 0 (0.0%) |
| $40,000 to $44,999 | 0 (0.0%) | 6 (4.9%) |
| $45,000 to $49,999 | 0 (0.0%) | 0 (0.0%) |
| $50,000 to $54,999 | 0 (0.0%) | 0 (0.0%) |
| $55,000 to $64,999 | 15 (12.5%) | 0 (0.0%) |
| $65,000 to $74,999 | 8 (6.7%) | 0 (0.0%) |
| $75,000 to $99,999 | 0 (0.0%) | 0 (0.0%) |
| $100,000+ | 0 (0.0%) | 16 (13.0%) |
| Total | 120 (100.0%) | 123 (100.0%) |
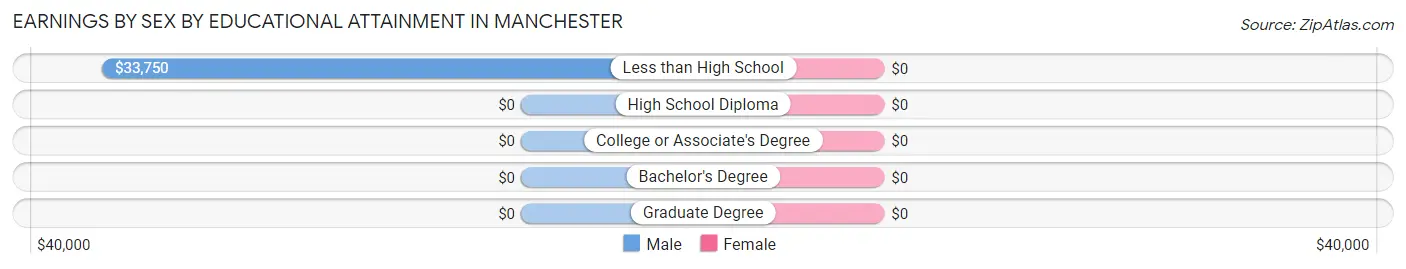
Earnings by Sex by Educational Attainment in Manchester
| Educational Attainment | Male Income | Female Income |
| Less than High School | $33,750 | $0 |
| High School Diploma | - | - |
| College or Associate's Degree | - | - |
| Bachelor's Degree | - | - |
| Graduate Degree | - | - |
| Total | $33,486 | $0 |
Family Income in Manchester
Family Income Brackets in Manchester
According to the Manchester family income data, there are 37 families falling into the $15,000 to $24,999 income range, which is the most common income bracket and makes up 49.3% of all families.
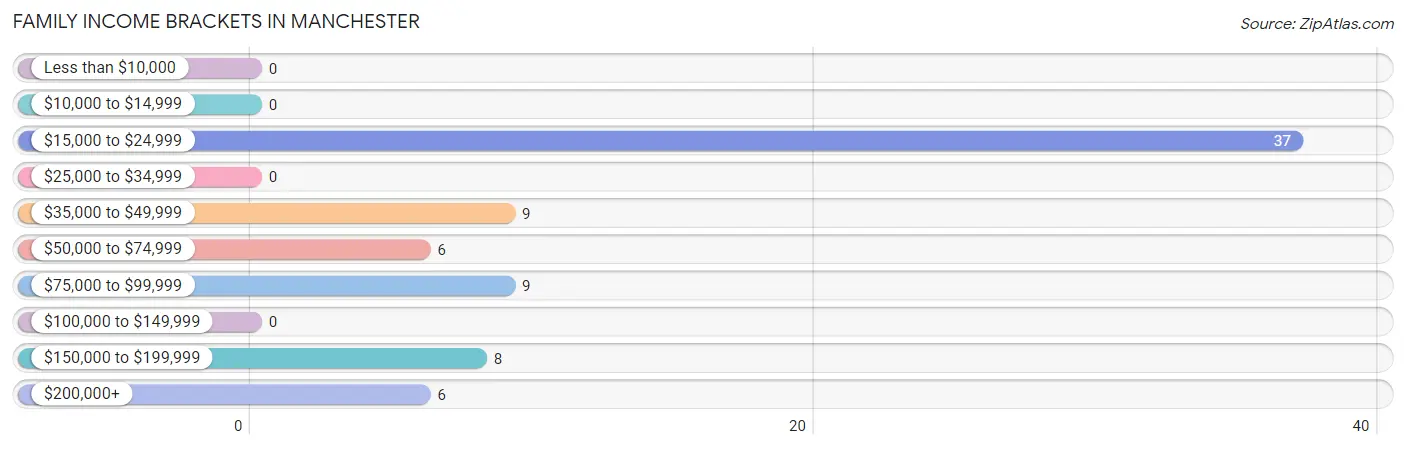
| Income Bracket | # Families | % Families |
| Less than $10,000 | 0 | 0.0% |
| $10,000 to $14,999 | 0 | 0.0% |
| $15,000 to $24,999 | 37 | 49.3% |
| $25,000 to $34,999 | 0 | 0.0% |
| $35,000 to $49,999 | 9 | 12.0% |
| $50,000 to $74,999 | 6 | 8.0% |
| $75,000 to $99,999 | 9 | 12.0% |
| $100,000 to $149,999 | 0 | 0.0% |
| $150,000 to $199,999 | 8 | 10.7% |
| $200,000+ | 6 | 8.0% |
Family Income by Famaliy Size in Manchester
4-person families (24 | 32.0%) account for the highest median family income in Manchester with $58,750 per family, while 4-person families (24 | 32.0%) have the highest median income of $14,688 per family member.
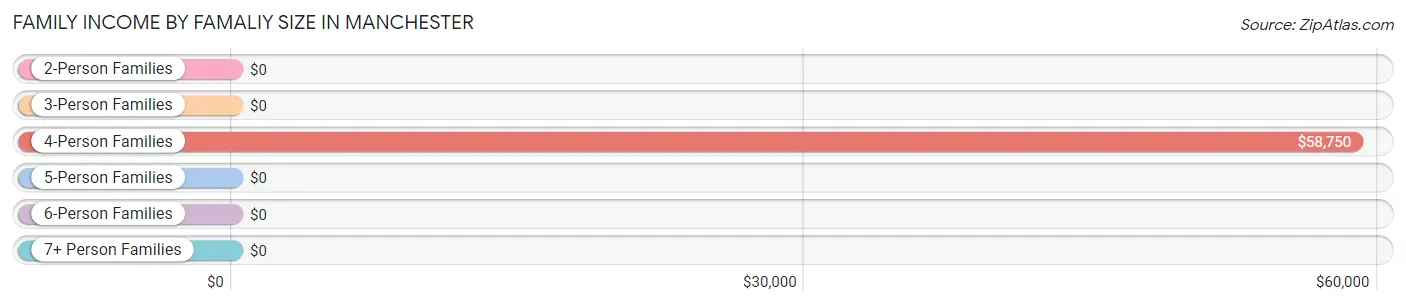
| Income Bracket | # Families | Median Income |
| 2-Person Families | 51 (68.0%) | $0 |
| 3-Person Families | 0 (0.0%) | $0 |
| 4-Person Families | 24 (32.0%) | $58,750 |
| 5-Person Families | 0 (0.0%) | $0 |
| 6-Person Families | 0 (0.0%) | $0 |
| 7+ Person Families | 0 (0.0%) | $0 |
| Total | 75 (100.0%) | $0 |
Family Income by Number of Earners in Manchester
| Number of Earners | # Families | Median Income |
| No Earners | 0 (0.0%) | $0 |
| 1 Earner | 6 (8.0%) | $0 |
| 2 Earners | 60 (80.0%) | $0 |
| 3+ Earners | 9 (12.0%) | $0 |
| Total | 75 (100.0%) | $0 |
Household Income in Manchester
Household Income Brackets in Manchester
With 49 households falling in the category, the $50,000 to $74,999 income range is the most frequent in Manchester, accounting for 44.1% of all households.
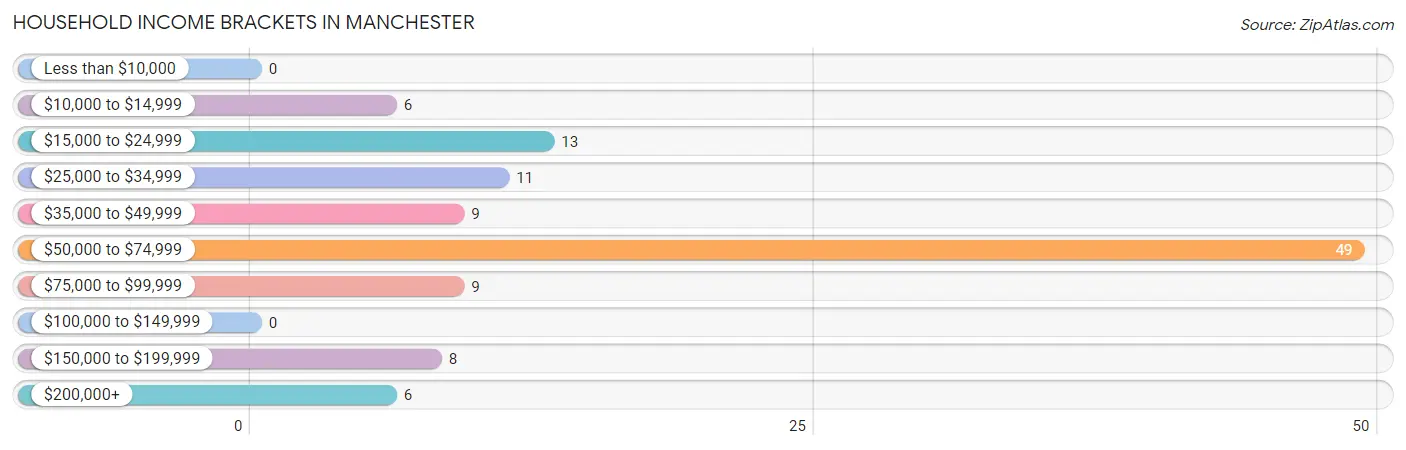
| Income Bracket | # Households | % Households |
| Less than $10,000 | 0 | 0.0% |
| $10,000 to $14,999 | 6 | 5.4% |
| $15,000 to $24,999 | 13 | 11.7% |
| $25,000 to $34,999 | 11 | 9.9% |
| $35,000 to $49,999 | 9 | 8.1% |
| $50,000 to $74,999 | 49 | 44.1% |
| $75,000 to $99,999 | 9 | 8.1% |
| $100,000 to $149,999 | 0 | 0.0% |
| $150,000 to $199,999 | 8 | 7.2% |
| $200,000+ | 6 | 5.4% |
Household Income by Householder Age in Manchester
The median household income in Manchester is $58,342, with the highest median household income of $58,542 found in the 25 to 44 years age bracket for the primary householder. A total of 32 households (28.8%) fall into this category.
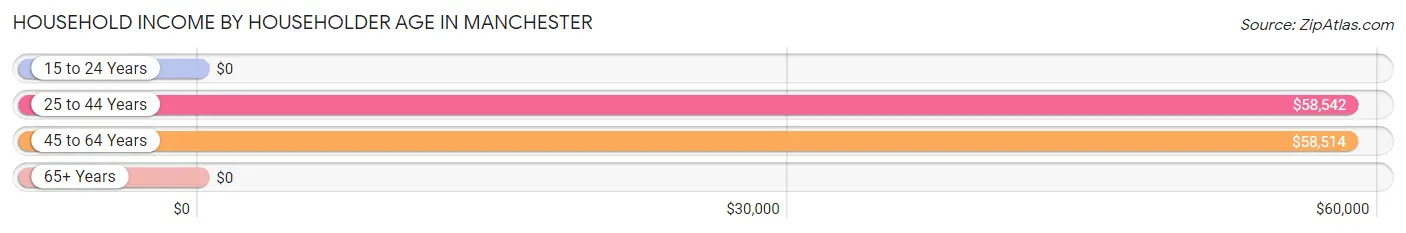
| Income Bracket | # Households | Median Income |
| 15 to 24 Years | 0 (0.0%) | $0 |
| 25 to 44 Years | 32 (28.8%) | $58,542 |
| 45 to 64 Years | 60 (54.0%) | $58,514 |
| 65+ Years | 19 (17.1%) | $0 |
| Total | 111 (100.0%) | $58,342 |
Poverty in Manchester
Income Below Poverty by Sex and Age in Manchester
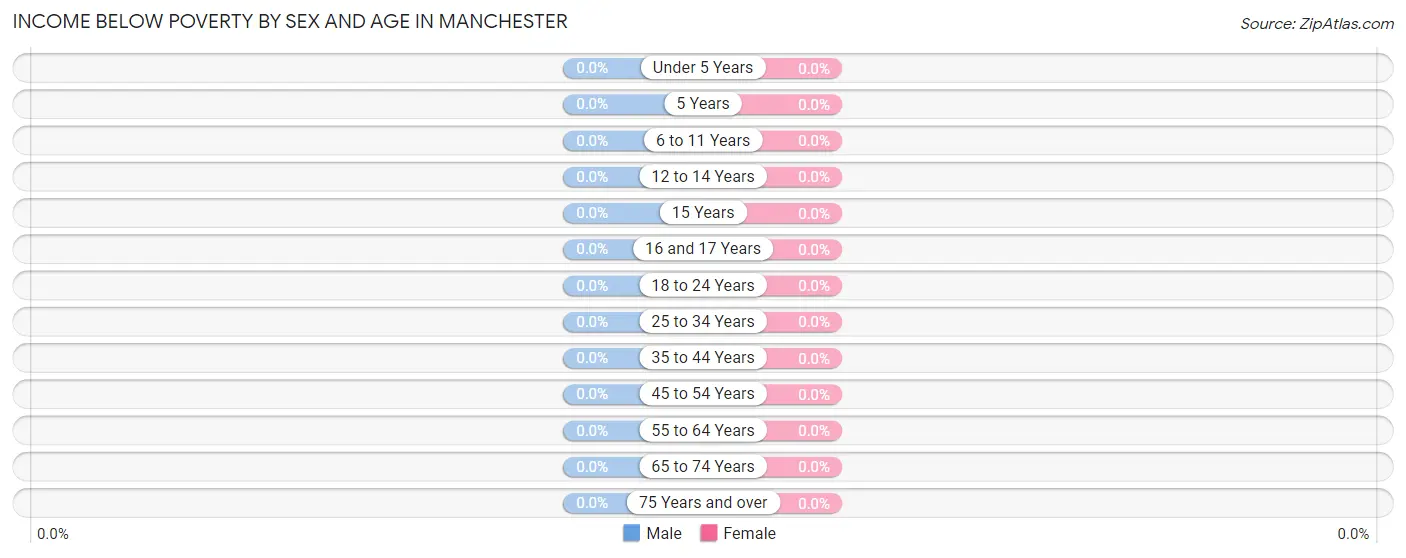
| Age Bracket | Male | Female |
| Under 5 Years | 0 (0.0%) | 0 (0.0%) |
| 5 Years | 0 (0.0%) | 0 (0.0%) |
| 6 to 11 Years | 0 (0.0%) | 0 (0.0%) |
| 12 to 14 Years | 0 (0.0%) | 0 (0.0%) |
| 15 Years | 0 (0.0%) | 0 (0.0%) |
| 16 and 17 Years | 0 (0.0%) | 0 (0.0%) |
| 18 to 24 Years | 0 (0.0%) | 0 (0.0%) |
| 25 to 34 Years | 0 (0.0%) | 0 (0.0%) |
| 35 to 44 Years | 0 (0.0%) | 0 (0.0%) |
| 45 to 54 Years | 0 (0.0%) | 0 (0.0%) |
| 55 to 64 Years | 0 (0.0%) | 0 (0.0%) |
| 65 to 74 Years | 0 (0.0%) | 0 (0.0%) |
| 75 Years and over | 0 (0.0%) | 0 (0.0%) |
| Total | 0 (0.0%) | 0 (0.0%) |
Income Above Poverty by Sex and Age in Manchester
According to the poverty statistics in Manchester, males aged under 5 years and females aged 16 and 17 years are the age groups that are most secure financially, with 100.0% of males and 100.0% of females in these age groups living above the poverty line.
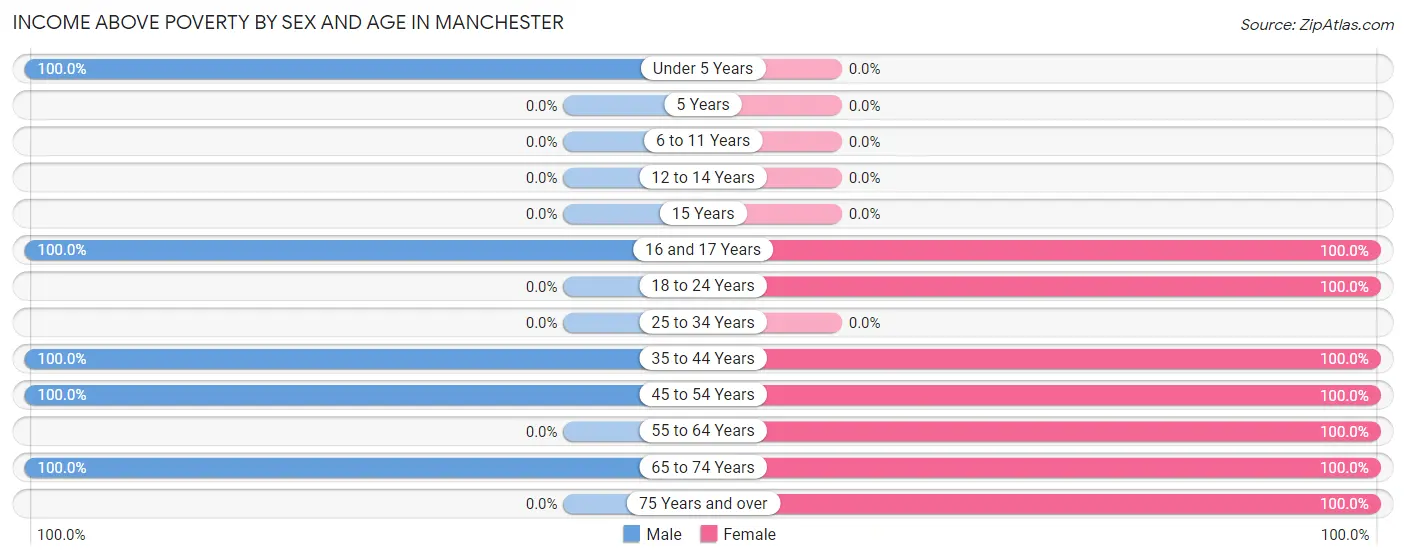
| Age Bracket | Male | Female |
| Under 5 Years | 23 (100.0%) | 0 (0.0%) |
| 5 Years | 0 (0.0%) | 0 (0.0%) |
| 6 to 11 Years | 0 (0.0%) | 0 (0.0%) |
| 12 to 14 Years | 0 (0.0%) | 0 (0.0%) |
| 15 Years | 0 (0.0%) | 0 (0.0%) |
| 16 and 17 Years | 24 (100.0%) | 27 (100.0%) |
| 18 to 24 Years | 0 (0.0%) | 27 (100.0%) |
| 25 to 34 Years | 0 (0.0%) | 0 (0.0%) |
| 35 to 44 Years | 85 (100.0%) | 13 (100.0%) |
| 45 to 54 Years | 17 (100.0%) | 52 (100.0%) |
| 55 to 64 Years | 0 (0.0%) | 6 (100.0%) |
| 65 to 74 Years | 13 (100.0%) | 5 (100.0%) |
| 75 Years and over | 0 (0.0%) | 6 (100.0%) |
| Total | 162 (100.0%) | 136 (100.0%) |
Income Below Poverty Among Married-Couple Families in Manchester
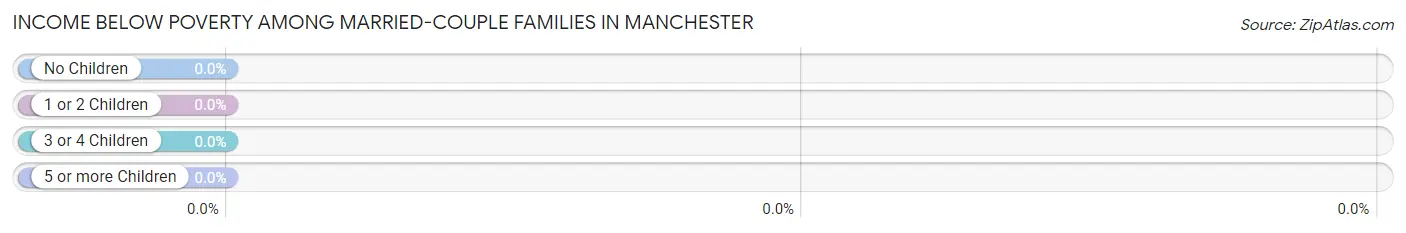
| Children | Above Poverty | Below Poverty |
| No Children | 14 (100.0%) | 0 (0.0%) |
| 1 or 2 Children | 24 (100.0%) | 0 (0.0%) |
| 3 or 4 Children | 0 (0.0%) | 0 (0.0%) |
| 5 or more Children | 0 (0.0%) | 0 (0.0%) |
| Total | 38 (100.0%) | 0 (0.0%) |
Income Below Poverty Among Single-Parent Households in Manchester
| Children | Single Father | Single Mother |
| No Children | 0 (0.0%) | 0 (0.0%) |
| 1 or 2 Children | 0 (0.0%) | 0 (0.0%) |
| 3 or 4 Children | 0 (0.0%) | 0 (0.0%) |
| 5 or more Children | 0 (0.0%) | 0 (0.0%) |
| Total | 0 (0.0%) | 0 (0.0%) |
Income Below Poverty Among Married-Couple vs Single-Parent Households in Manchester
| Children | Married-Couple Families | Single-Parent Households |
| No Children | 0 (0.0%) | 0 (0.0%) |
| 1 or 2 Children | 0 (0.0%) | 0 (0.0%) |
| 3 or 4 Children | 0 (0.0%) | 0 (0.0%) |
| 5 or more Children | 0 (0.0%) | 0 (0.0%) |
| Total | 0 (0.0%) | 0 (0.0%) |
Race in Manchester
The most populous races in Manchester are Hispanic or Latino (226 | 75.8%), White / Caucasian (130 | 43.6%), and Two or more Races (127 | 42.6%).
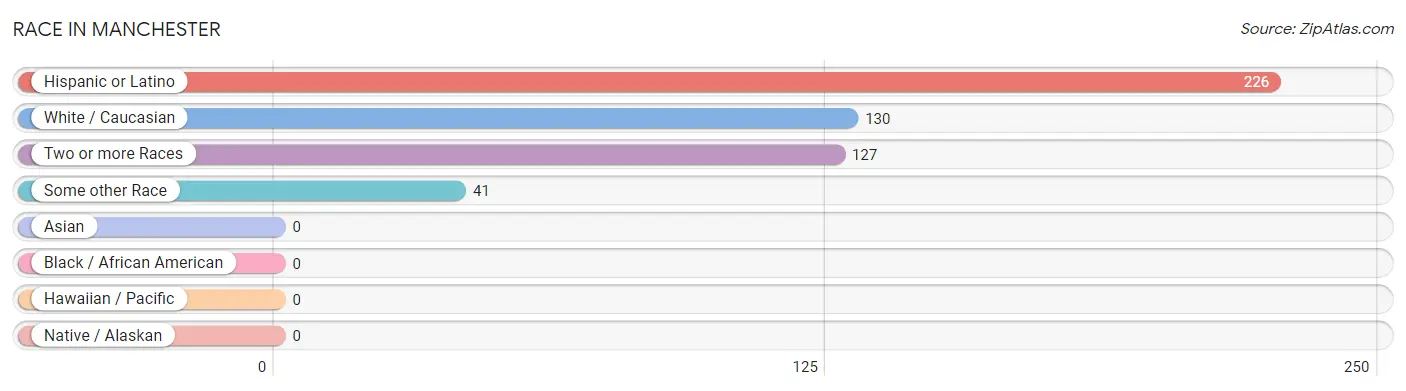
| Race | # Population | % Population |
| Asian | 0 | 0.0% |
| Black / African American | 0 | 0.0% |
| Hawaiian / Pacific | 0 | 0.0% |
| Hispanic or Latino | 226 | 75.8% |
| Native / Alaskan | 0 | 0.0% |
| White / Caucasian | 130 | 43.6% |
| Two or more Races | 127 | 42.6% |
| Some other Race | 41 | 13.8% |
| Total | 298 | 100.0% |
Ancestry in Manchester
The most populous ancestries reported in Manchester are Mexican (226 | 75.8%), French (13 | 4.4%), English (12 | 4.0%), British (7 | 2.4%), and German (6 | 2.0%), together accounting for 88.6% of all Manchester residents.
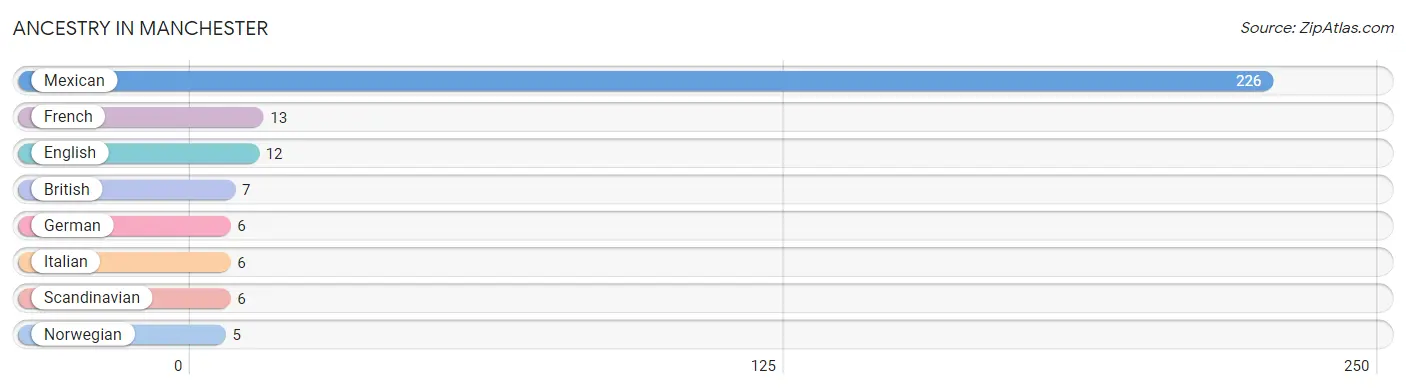
| Ancestry | # Population | % Population |
| British | 7 | 2.4% |
| English | 12 | 4.0% |
| French | 13 | 4.4% |
| German | 6 | 2.0% |
| Italian | 6 | 2.0% |
| Mexican | 226 | 75.8% |
| Norwegian | 5 | 1.7% |
| Scandinavian | 6 | 2.0% | View All 8 Rows |
Immigrants in Manchester
The most numerous immigrant groups reported in Manchester came from Central America (92 | 30.9%), Latin America (92 | 30.9%), and Mexico (92 | 30.9%), together accounting for 92.6% of all Manchester residents.
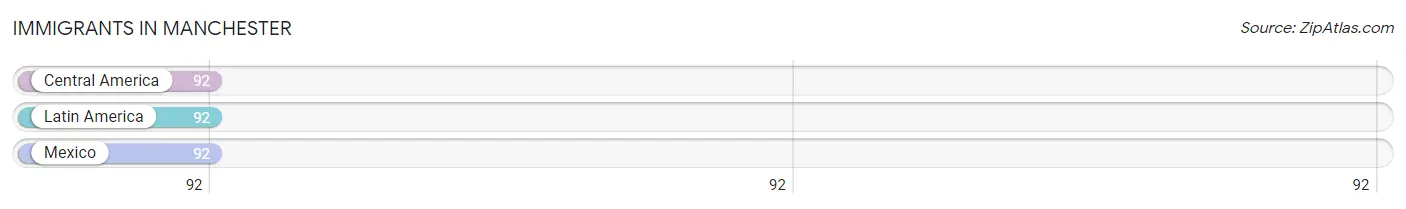
| Immigration Origin | # Population | % Population |
| Central America | 92 | 30.9% |
| Latin America | 92 | 30.9% |
| Mexico | 92 | 30.9% | View All 3 Rows |
Sex and Age in Manchester
Sex and Age in Manchester
The most populous age groups in Manchester are 40 to 44 Years (74 | 45.7%) for men and 15 to 19 Years (42 | 30.9%) for women.
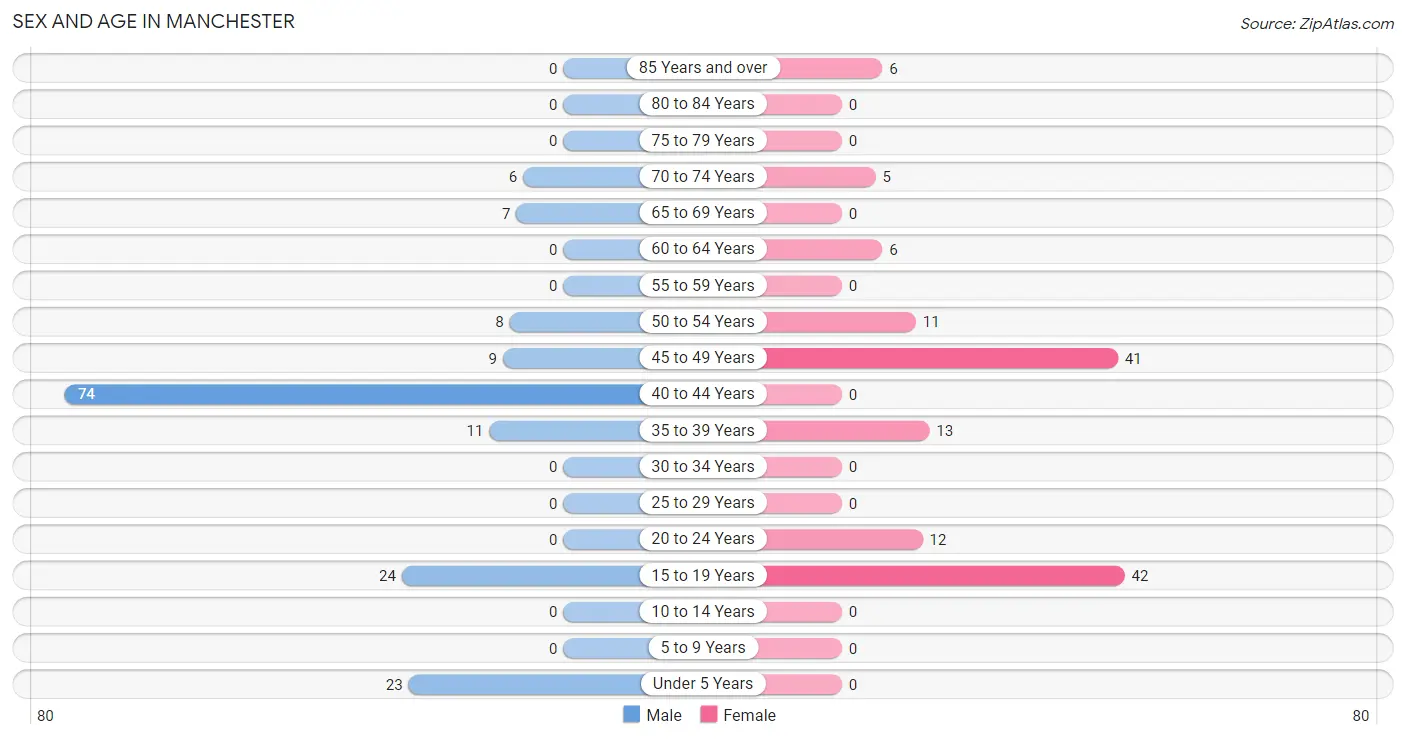
| Age Bracket | Male | Female |
| Under 5 Years | 23 (14.2%) | 0 (0.0%) |
| 5 to 9 Years | 0 (0.0%) | 0 (0.0%) |
| 10 to 14 Years | 0 (0.0%) | 0 (0.0%) |
| 15 to 19 Years | 24 (14.8%) | 42 (30.9%) |
| 20 to 24 Years | 0 (0.0%) | 12 (8.8%) |
| 25 to 29 Years | 0 (0.0%) | 0 (0.0%) |
| 30 to 34 Years | 0 (0.0%) | 0 (0.0%) |
| 35 to 39 Years | 11 (6.8%) | 13 (9.6%) |
| 40 to 44 Years | 74 (45.7%) | 0 (0.0%) |
| 45 to 49 Years | 9 (5.6%) | 41 (30.1%) |
| 50 to 54 Years | 8 (4.9%) | 11 (8.1%) |
| 55 to 59 Years | 0 (0.0%) | 0 (0.0%) |
| 60 to 64 Years | 0 (0.0%) | 6 (4.4%) |
| 65 to 69 Years | 7 (4.3%) | 0 (0.0%) |
| 70 to 74 Years | 6 (3.7%) | 5 (3.7%) |
| 75 to 79 Years | 0 (0.0%) | 0 (0.0%) |
| 80 to 84 Years | 0 (0.0%) | 0 (0.0%) |
| 85 Years and over | 0 (0.0%) | 6 (4.4%) |
| Total | 162 (100.0%) | 136 (100.0%) |
Families and Households in Manchester
Median Family Size in Manchester
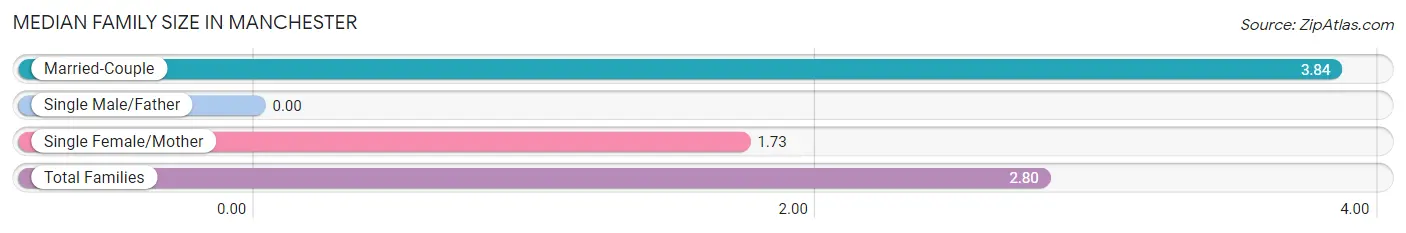
| Family Type | # Families | Family Size |
| Married-Couple | 38 (50.7%) | 3.84 |
| Single Male/Father | 0 (0.0%) | - |
| Single Female/Mother | 37 (49.3%) | 1.73 |
| Total Families | 75 (100.0%) | 2.80 |
Median Household Size in Manchester
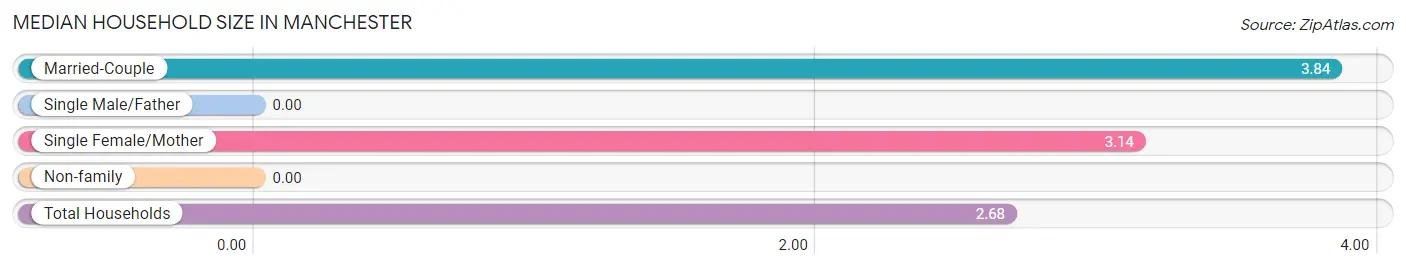
| Household Type | # Households | Household Size |
| Married-Couple | 38 (34.2%) | 3.84 |
| Single Male/Father | 0 (0.0%) | - |
| Single Female/Mother | 37 (33.3%) | 3.14 |
| Non-family | 36 (32.4%) | - |
| Total Households | 111 (100.0%) | 2.68 |
Household Size by Marriage Status in Manchester
Out of a total of 111 households in Manchester, 75 (67.6%) are family households, while 36 (32.4%) are nonfamily households. The most numerous type of family households are 3-person households, comprising 37, and the most common type of nonfamily households are 1-person households, comprising 36.
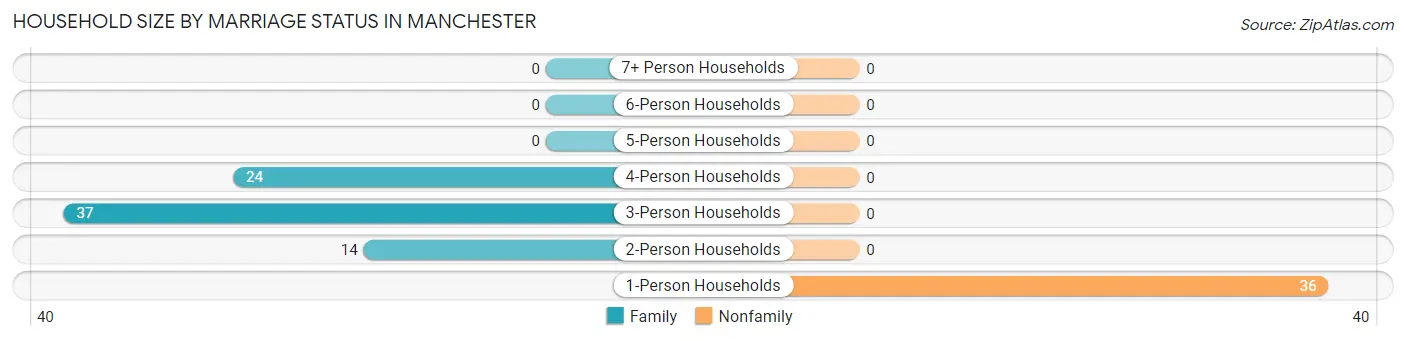
| Household Size | Family Households | Nonfamily Households |
| 1-Person Households | - | 36 (32.4%) |
| 2-Person Households | 14 (12.6%) | 0 (0.0%) |
| 3-Person Households | 37 (33.3%) | 0 (0.0%) |
| 4-Person Households | 24 (21.6%) | 0 (0.0%) |
| 5-Person Households | 0 (0.0%) | 0 (0.0%) |
| 6-Person Households | 0 (0.0%) | 0 (0.0%) |
| 7+ Person Households | 0 (0.0%) | 0 (0.0%) |
| Total | 75 (67.6%) | 36 (32.4%) |
Female Fertility in Manchester
Fertility by Age in Manchester
| Age Bracket | Women with Births | Births / 1,000 Women |
| 15 to 19 years | 0 (0.0%) | 0.0 |
| 20 to 34 years | 0 (0.0%) | 0.0 |
| 35 to 50 years | 0 (0.0%) | 0.0 |
| Total | 0 (0.0%) | 0.0 |
Fertility by Age by Marriage Status in Manchester
| Age Bracket | Married | Unmarried |
| 15 to 19 years | 0 (0.0%) | 0 (0.0%) |
| 20 to 34 years | 0 (0.0%) | 0 (0.0%) |
| 35 to 50 years | 0 (0.0%) | 0 (0.0%) |
| Total | 0 (0.0%) | 0 (0.0%) |
Fertility by Education in Manchester
| Educational Attainment | Women with Births | Births / 1,000 Women |
| Less than High School | 0 (0.0%) | 0.0 |
| High School Diploma | 0 (0.0%) | 0.0 |
| College or Associate's Degree | 0 (0.0%) | 0.0 |
| Bachelor's Degree | 0 (0.0%) | 0.0 |
| Graduate Degree | 0 (0.0%) | 0.0 |
| Total | 0 (0.0%) | 0.0 |
Fertility by Education by Marriage Status in Manchester
| Educational Attainment | Married | Unmarried |
| Less than High School | 0 (0.0%) | 0 (0.0%) |
| High School Diploma | 0 (0.0%) | 0 (0.0%) |
| College or Associate's Degree | 0 (0.0%) | 0 (0.0%) |
| Bachelor's Degree | 0 (0.0%) | 0 (0.0%) |
| Graduate Degree | 0 (0.0%) | 0 (0.0%) |
| Total | 0 (0.0%) | 0 (0.0%) |
Employment Characteristics in Manchester
Employment by Class of Employer in Manchester
Among the 199 employed individuals in Manchester, private company employees (163 | 81.9%), self-employed (not incorporated) (17 | 8.5%), and local government employees (11 | 5.5%) make up the most common classes of employment.
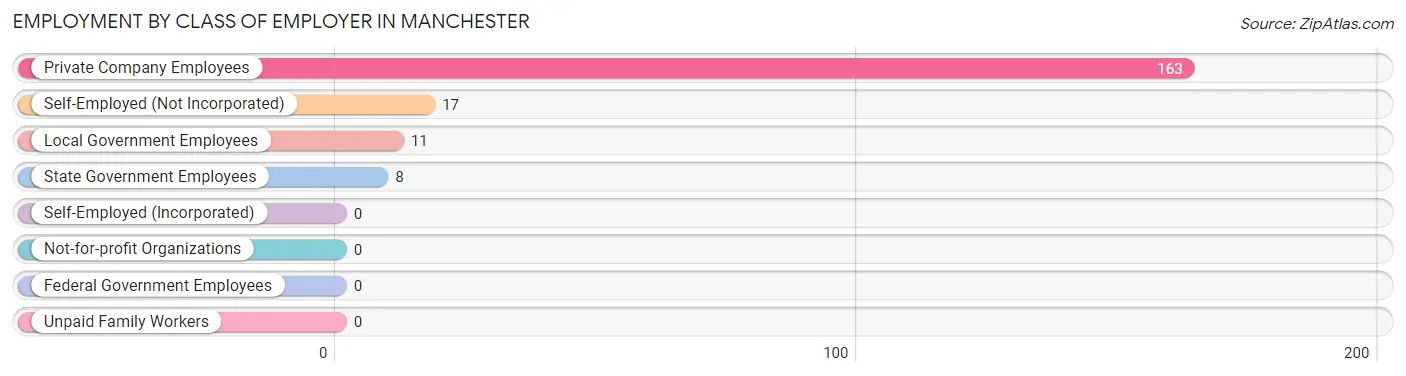
| Employer Class | # Employees | % Employees |
| Private Company Employees | 163 | 81.9% |
| Self-Employed (Incorporated) | 0 | 0.0% |
| Self-Employed (Not Incorporated) | 17 | 8.5% |
| Not-for-profit Organizations | 0 | 0.0% |
| Local Government Employees | 11 | 5.5% |
| State Government Employees | 8 | 4.0% |
| Federal Government Employees | 0 | 0.0% |
| Unpaid Family Workers | 0 | 0.0% |
| Total | 199 | 100.0% |
Employment Status by Age in Manchester
According to the labor force statistics for Manchester, out of the total population over 16 years of age (275), 90.9% or 250 individuals are in the labor force, with 5.6% or 14 of them unemployed. The age group with the highest labor force participation rate is 20 to 24 years, with 100.0% or 12 individuals in the labor force. Within the labor force, the 65 to 74 years age range has the highest percentage of unemployed individuals, with 58.3% or 7 of them being unemployed.
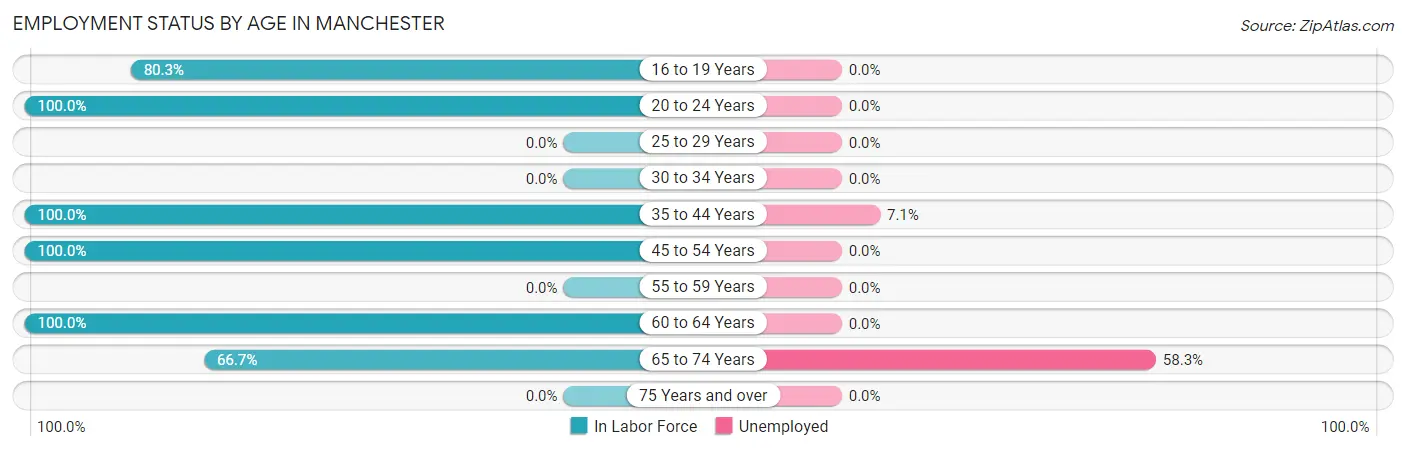
| Age Bracket | In Labor Force | Unemployed |
| 16 to 19 Years | 53 (80.3%) | 0 (0.0%) |
| 20 to 24 Years | 12 (100.0%) | 0 (0.0%) |
| 25 to 29 Years | 0 (0.0%) | 0 (0.0%) |
| 30 to 34 Years | 0 (0.0%) | 0 (0.0%) |
| 35 to 44 Years | 98 (100.0%) | 7 (7.1%) |
| 45 to 54 Years | 69 (100.0%) | 0 (0.0%) |
| 55 to 59 Years | 0 (0.0%) | 0 (0.0%) |
| 60 to 64 Years | 6 (100.0%) | 0 (0.0%) |
| 65 to 74 Years | 12 (66.7%) | 7 (58.3%) |
| 75 Years and over | 0 (0.0%) | 0 (0.0%) |
| Total | 250 (90.9%) | 14 (5.6%) |
Employment Status by Educational Attainment in Manchester
According to labor force statistics for Manchester, 100.0% of individuals (173) out of the total population between 25 and 64 years of age (173) are in the labor force, with 4.0% or 7 of them being unemployed. The group with the highest labor force participation rate are those with the educational attainment of less than high school, with 100.0% or 74 individuals in the labor force. Within the labor force, individuals with college / associate degree education have the highest percentage of unemployment, with 17.1% or 7 of them being unemployed.
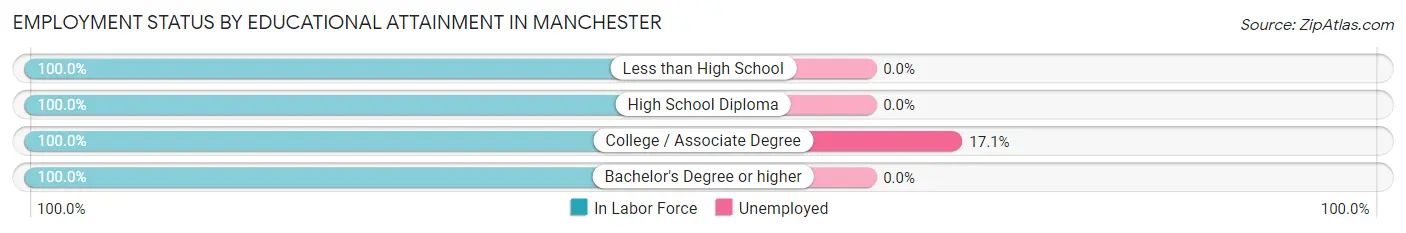
| Educational Attainment | In Labor Force | Unemployed |
| Less than High School | 74 (100.0%) | 0 (0.0%) |
| High School Diploma | 52 (100.0%) | 0 (0.0%) |
| College / Associate Degree | 41 (100.0%) | 7 (17.1%) |
| Bachelor's Degree or higher | 6 (100.0%) | 0 (0.0%) |
| Total | 173 (100.0%) | 7 (4.0%) |
Employment Occupations by Sex in Manchester
Management, Business, Science and Arts Occupations
The most common Management, Business, Science and Arts occupations in Manchester are , and Management (17 | 7.2%).
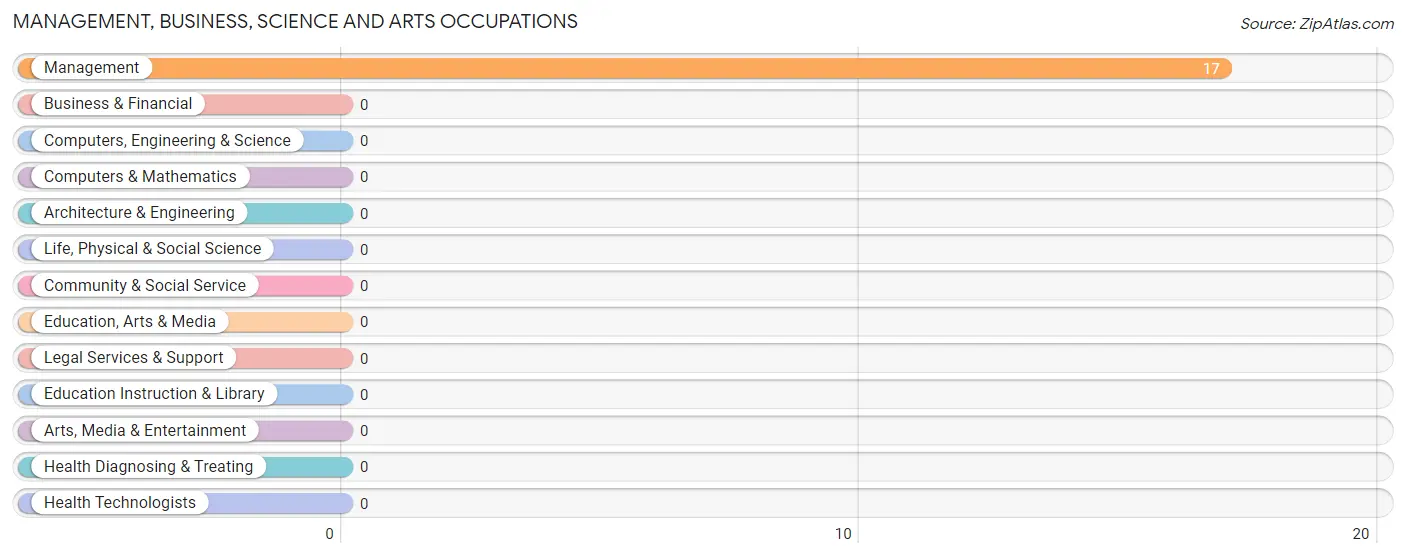
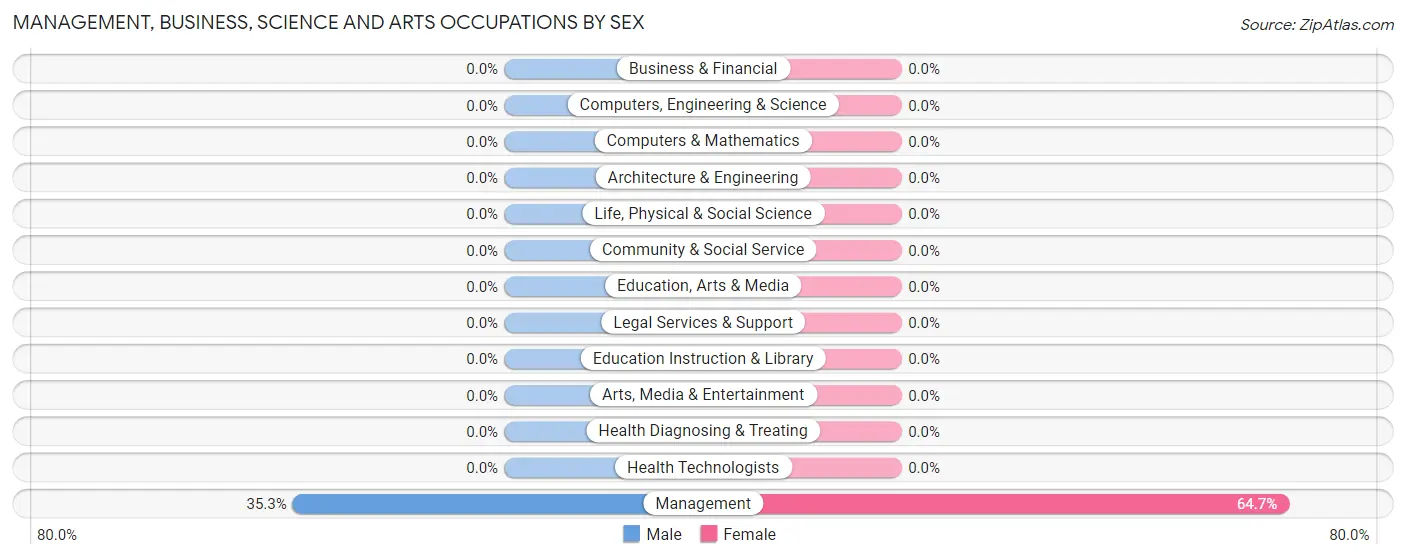
Management, Business, Science and Arts Occupations by Sex
| Occupation | Male | Female |
| Management | 6 (35.3%) | 11 (64.7%) |
| Business & Financial | 0 (0.0%) | 0 (0.0%) |
| Computers, Engineering & Science | 0 (0.0%) | 0 (0.0%) |
| Computers & Mathematics | 0 (0.0%) | 0 (0.0%) |
| Architecture & Engineering | 0 (0.0%) | 0 (0.0%) |
| Life, Physical & Social Science | 0 (0.0%) | 0 (0.0%) |
| Community & Social Service | 0 (0.0%) | 0 (0.0%) |
| Education, Arts & Media | 0 (0.0%) | 0 (0.0%) |
| Legal Services & Support | 0 (0.0%) | 0 (0.0%) |
| Education Instruction & Library | 0 (0.0%) | 0 (0.0%) |
| Arts, Media & Entertainment | 0 (0.0%) | 0 (0.0%) |
| Health Diagnosing & Treating | 0 (0.0%) | 0 (0.0%) |
| Health Technologists | 0 (0.0%) | 0 (0.0%) |
| Total (Category) | 6 (35.3%) | 11 (64.7%) |
| Total (Overall) | 113 (47.9%) | 123 (52.1%) |
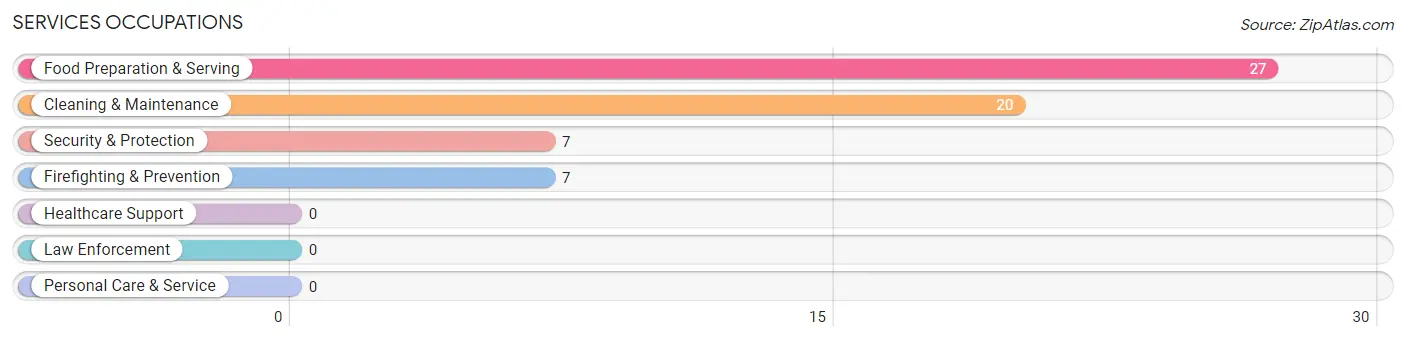
Services Occupations
The most common Services occupations in Manchester are Food Preparation & Serving (27 | 11.4%), Cleaning & Maintenance (20 | 8.5%), Security & Protection (7 | 3.0%), and Firefighting & Prevention (7 | 3.0%).
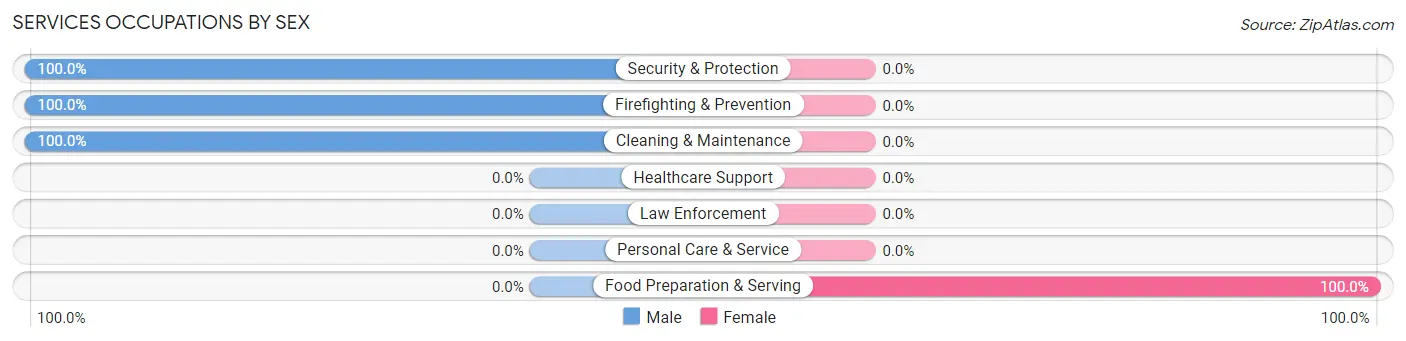
Services Occupations by Sex
| Occupation | Male | Female |
| Healthcare Support | 0 (0.0%) | 0 (0.0%) |
| Security & Protection | 7 (100.0%) | 0 (0.0%) |
| Firefighting & Prevention | 7 (100.0%) | 0 (0.0%) |
| Law Enforcement | 0 (0.0%) | 0 (0.0%) |
| Food Preparation & Serving | 0 (0.0%) | 27 (100.0%) |
| Cleaning & Maintenance | 20 (100.0%) | 0 (0.0%) |
| Personal Care & Service | 0 (0.0%) | 0 (0.0%) |
| Total (Category) | 27 (50.0%) | 27 (50.0%) |
| Total (Overall) | 113 (47.9%) | 123 (52.1%) |
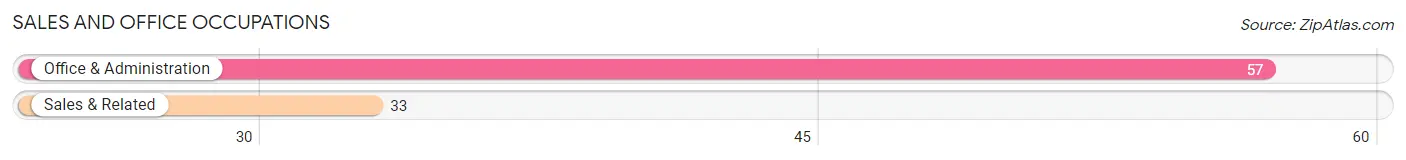
Sales and Office Occupations
The most common Sales and Office occupations in Manchester are Office & Administration (57 | 24.1%), and Sales & Related (33 | 14.0%).
Sales and Office Occupations by Sex
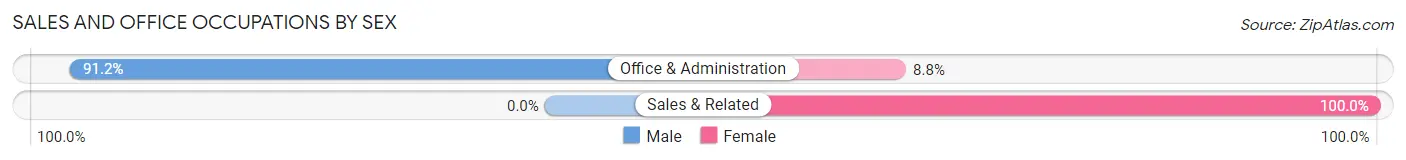
| Occupation | Male | Female |
| Sales & Related | 0 (0.0%) | 33 (100.0%) |
| Office & Administration | 52 (91.2%) | 5 (8.8%) |
| Total (Category) | 52 (57.8%) | 38 (42.2%) |
| Total (Overall) | 113 (47.9%) | 123 (52.1%) |
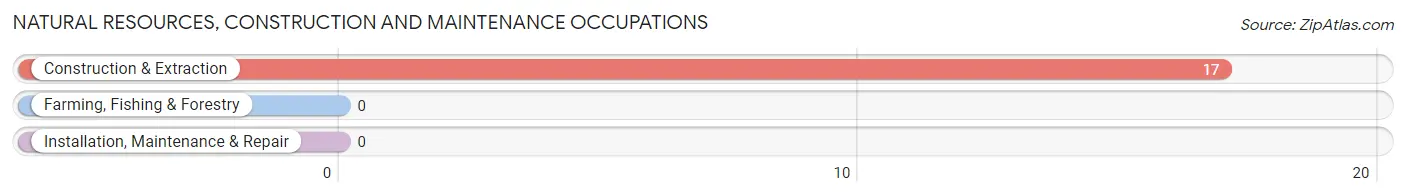
Natural Resources, Construction and Maintenance Occupations
The most common Natural Resources, Construction and Maintenance occupations in Manchester are , and Construction & Extraction (17 | 7.2%).
Natural Resources, Construction and Maintenance Occupations by Sex
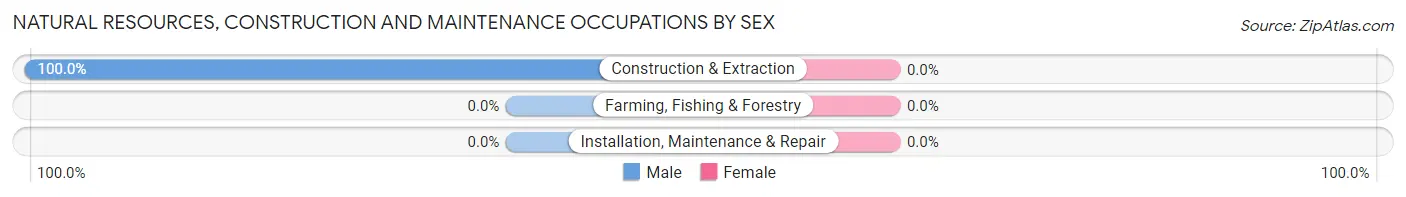
| Occupation | Male | Female |
| Farming, Fishing & Forestry | 0 (0.0%) | 0 (0.0%) |
| Construction & Extraction | 17 (100.0%) | 0 (0.0%) |
| Installation, Maintenance & Repair | 0 (0.0%) | 0 (0.0%) |
| Total (Category) | 17 (100.0%) | 0 (0.0%) |
| Total (Overall) | 113 (47.9%) | 123 (52.1%) |
Production, Transportation and Moving Occupations
The most common Production, Transportation and Moving occupations in Manchester are Production (54 | 22.9%), and Material Moving (4 | 1.7%).
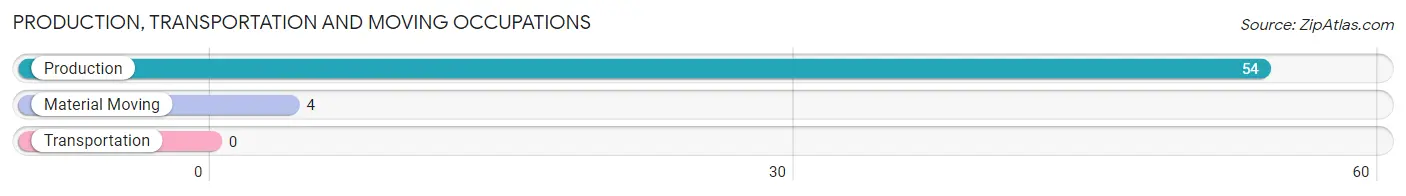
Production, Transportation and Moving Occupations by Sex
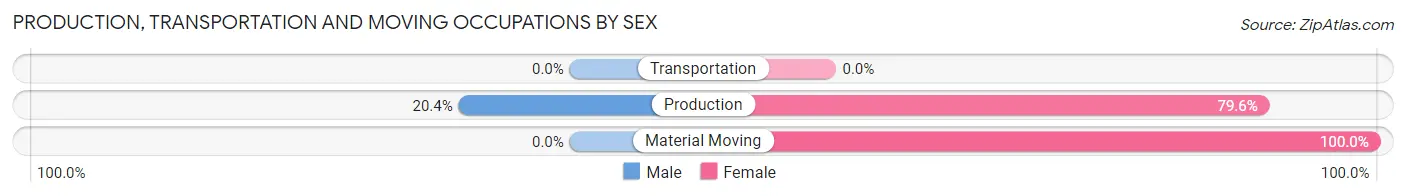
| Occupation | Male | Female |
| Production | 11 (20.4%) | 43 (79.6%) |
| Transportation | 0 (0.0%) | 0 (0.0%) |
| Material Moving | 0 (0.0%) | 4 (100.0%) |
| Total (Category) | 11 (19.0%) | 47 (81.0%) |
| Total (Overall) | 113 (47.9%) | 123 (52.1%) |
Employment Industries by Sex in Manchester
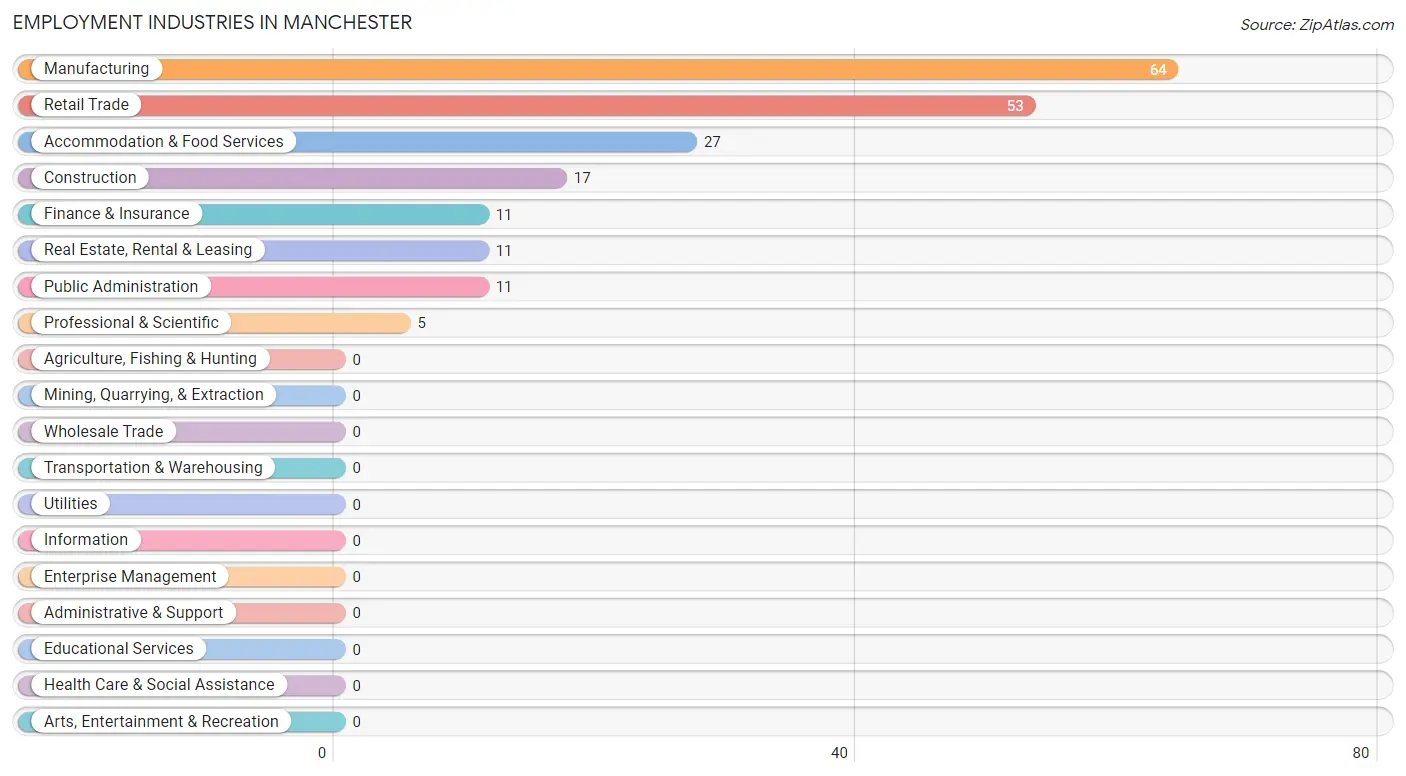
Employment Industries in Manchester
The major employment industries in Manchester include Manufacturing (64 | 27.1%), Retail Trade (53 | 22.5%), Accommodation & Food Services (27 | 11.4%), Construction (17 | 7.2%), and Finance & Insurance (11 | 4.7%).
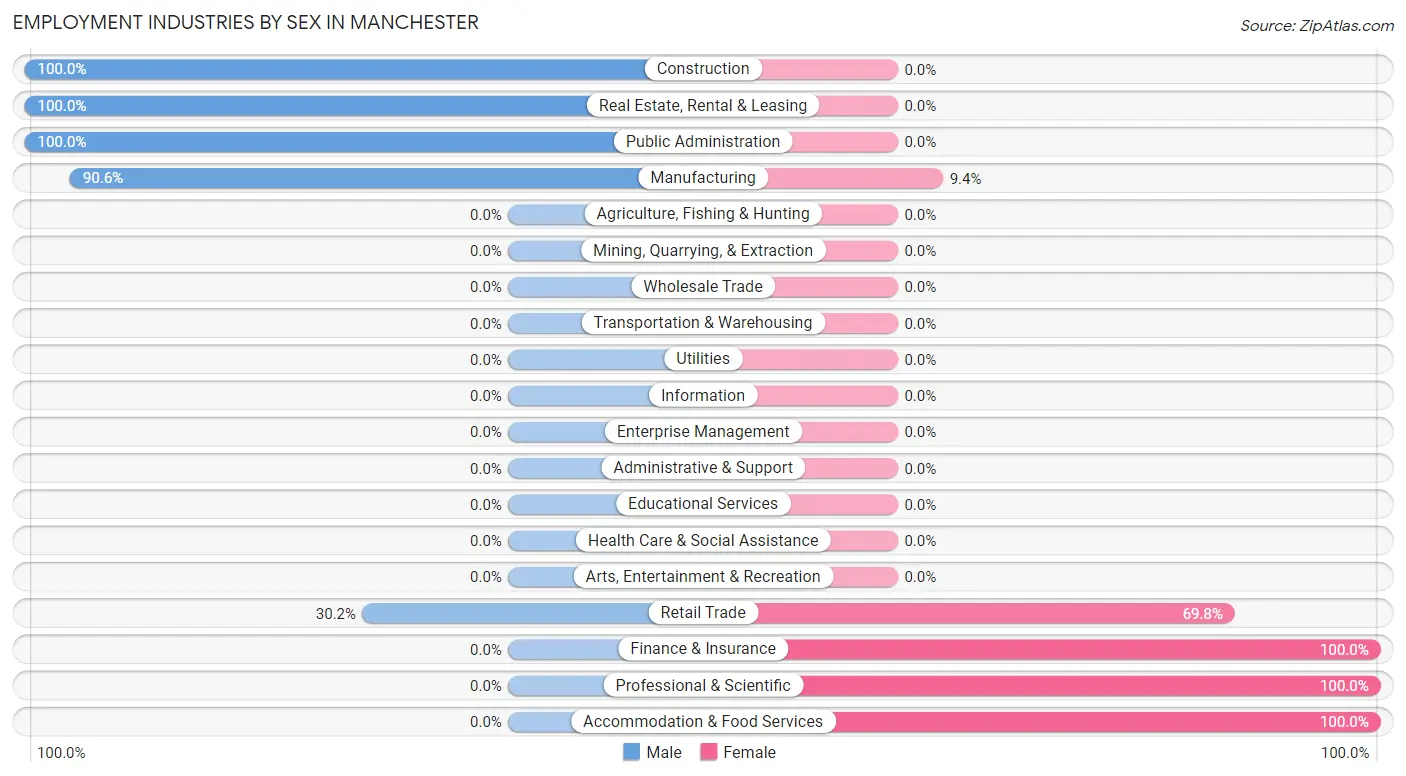
Employment Industries by Sex in Manchester
The Manchester industries that see more men than women are Construction (100.0%), Real Estate, Rental & Leasing (100.0%), and Public Administration (100.0%), whereas the industries that tend to have a higher number of women are Finance & Insurance (100.0%), Professional & Scientific (100.0%), and Accommodation & Food Services (100.0%).
| Industry | Male | Female |
| Agriculture, Fishing & Hunting | 0 (0.0%) | 0 (0.0%) |
| Mining, Quarrying, & Extraction | 0 (0.0%) | 0 (0.0%) |
| Construction | 17 (100.0%) | 0 (0.0%) |
| Manufacturing | 58 (90.6%) | 6 (9.4%) |
| Wholesale Trade | 0 (0.0%) | 0 (0.0%) |
| Retail Trade | 16 (30.2%) | 37 (69.8%) |
| Transportation & Warehousing | 0 (0.0%) | 0 (0.0%) |
| Utilities | 0 (0.0%) | 0 (0.0%) |
| Information | 0 (0.0%) | 0 (0.0%) |
| Finance & Insurance | 0 (0.0%) | 11 (100.0%) |
| Real Estate, Rental & Leasing | 11 (100.0%) | 0 (0.0%) |
| Professional & Scientific | 0 (0.0%) | 5 (100.0%) |
| Enterprise Management | 0 (0.0%) | 0 (0.0%) |
| Administrative & Support | 0 (0.0%) | 0 (0.0%) |
| Educational Services | 0 (0.0%) | 0 (0.0%) |
| Health Care & Social Assistance | 0 (0.0%) | 0 (0.0%) |
| Arts, Entertainment & Recreation | 0 (0.0%) | 0 (0.0%) |
| Accommodation & Food Services | 0 (0.0%) | 27 (100.0%) |
| Public Administration | 11 (100.0%) | 0 (0.0%) |
| Total | 113 (47.9%) | 123 (52.1%) |
Education in Manchester
School Enrollment in Manchester
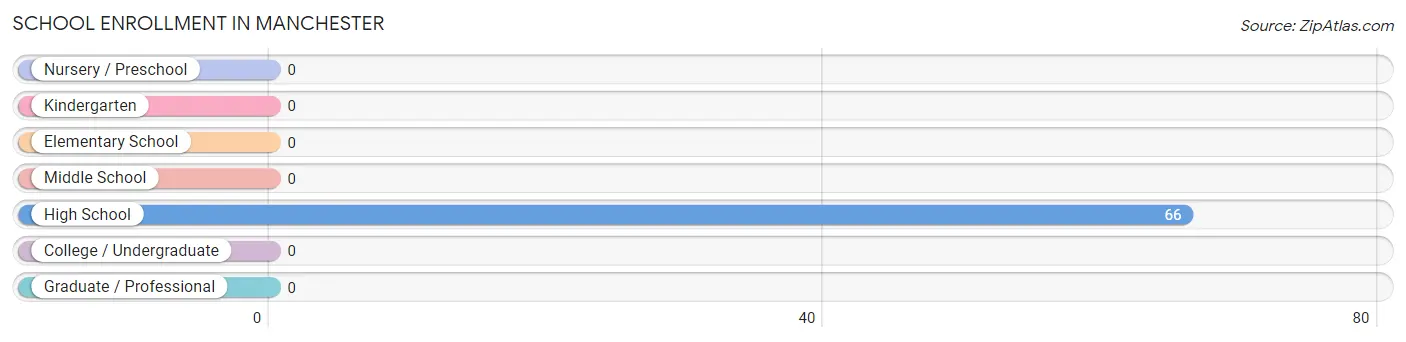
| School Level | # Students | % Students |
| Nursery / Preschool | 0 | 0.0% |
| Kindergarten | 0 | 0.0% |
| Elementary School | 0 | 0.0% |
| Middle School | 0 | 0.0% |
| High School | 66 | 100.0% |
| College / Undergraduate | 0 | 0.0% |
| Graduate / Professional | 0 | 0.0% |
| Total | 66 | 100.0% |
School Enrollment by Age by Funding Source in Manchester
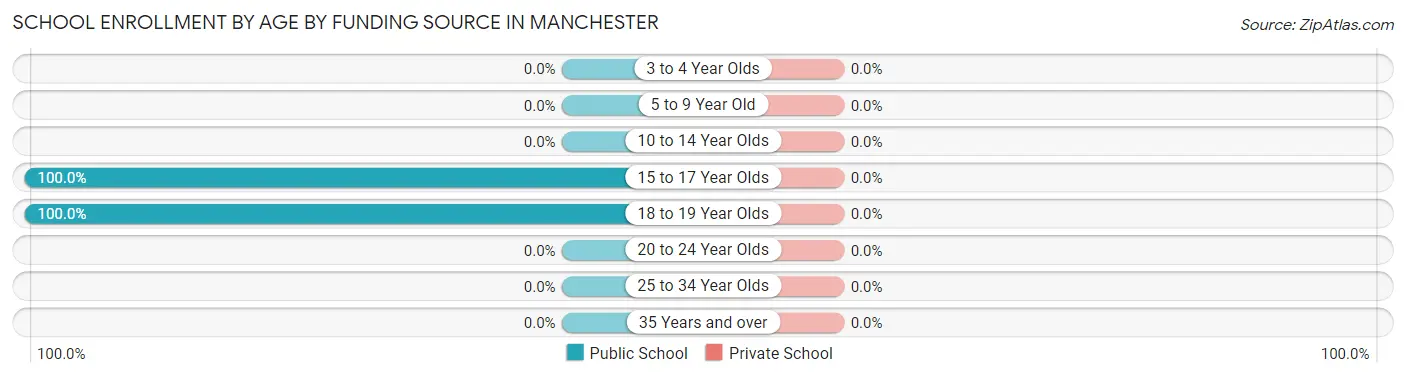
| Age Bracket | Public School | Private School |
| 3 to 4 Year Olds | 0 (0.0%) | 0 (0.0%) |
| 5 to 9 Year Old | 0 (0.0%) | 0 (0.0%) |
| 10 to 14 Year Olds | 0 (0.0%) | 0 (0.0%) |
| 15 to 17 Year Olds | 51 (100.0%) | 0 (0.0%) |
| 18 to 19 Year Olds | 15 (100.0%) | 0 (0.0%) |
| 20 to 24 Year Olds | 0 (0.0%) | 0 (0.0%) |
| 25 to 34 Year Olds | 0 (0.0%) | 0 (0.0%) |
| 35 Years and over | 0 (0.0%) | 0 (0.0%) |
| Total | 66 (100.0%) | 0 (0.0%) |
Educational Attainment by Field of Study in Manchester
, and visual & performing arts (6 | 100.0%) are the most common fields of study among 6 individuals in Manchester who have obtained a bachelor's degree or higher.
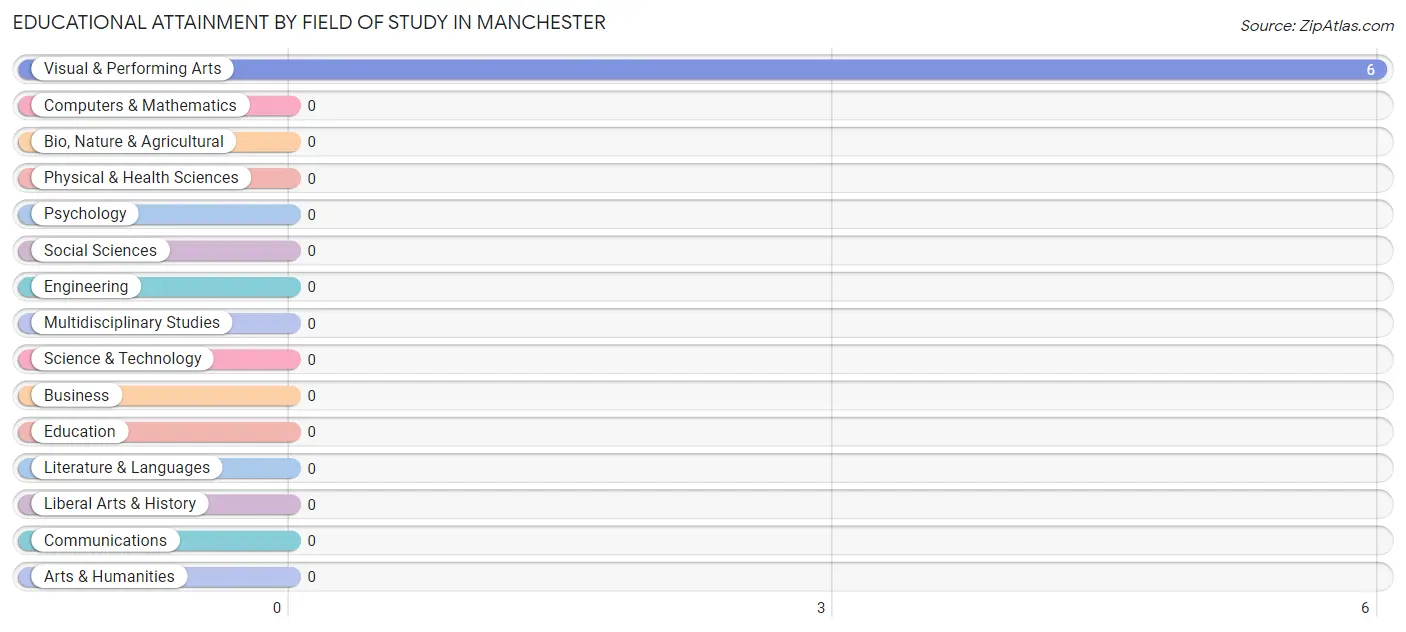
| Field of Study | # Graduates | % Graduates |
| Computers & Mathematics | 0 | 0.0% |
| Bio, Nature & Agricultural | 0 | 0.0% |
| Physical & Health Sciences | 0 | 0.0% |
| Psychology | 0 | 0.0% |
| Social Sciences | 0 | 0.0% |
| Engineering | 0 | 0.0% |
| Multidisciplinary Studies | 0 | 0.0% |
| Science & Technology | 0 | 0.0% |
| Business | 0 | 0.0% |
| Education | 0 | 0.0% |
| Literature & Languages | 0 | 0.0% |
| Liberal Arts & History | 0 | 0.0% |
| Visual & Performing Arts | 6 | 100.0% |
| Communications | 0 | 0.0% |
| Arts & Humanities | 0 | 0.0% |
| Total | 6 | 100.0% |
Transportation & Commute in Manchester
Vehicle Availability by Sex in Manchester
The most prevalent vehicle ownership categories in Manchester are males with 2 vehicles (66, accounting for 58.4%) and females with 2 vehicles (49, making up 76.7%).
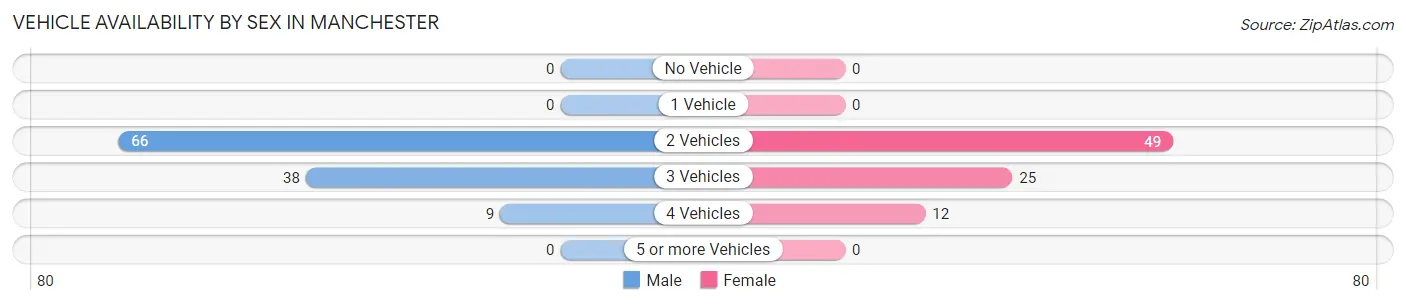
| Vehicles Available | Male | Female |
| No Vehicle | 0 (0.0%) | 0 (0.0%) |
| 1 Vehicle | 0 (0.0%) | 0 (0.0%) |
| 2 Vehicles | 66 (58.4%) | 49 (57.0%) |
| 3 Vehicles | 38 (33.6%) | 25 (29.1%) |
| 4 Vehicles | 9 (8.0%) | 12 (14.0%) |
| 5 or more Vehicles | 0 (0.0%) | 0 (0.0%) |
| Total | 113 (100.0%) | 86 (100.0%) |
Commute Time in Manchester
The most frequently occuring commute durations in Manchester are 5 to 9 minutes (109 commuters, 58.0%), 10 to 14 minutes (24 commuters, 12.8%), and 45 to 59 minutes (21 commuters, 11.2%).
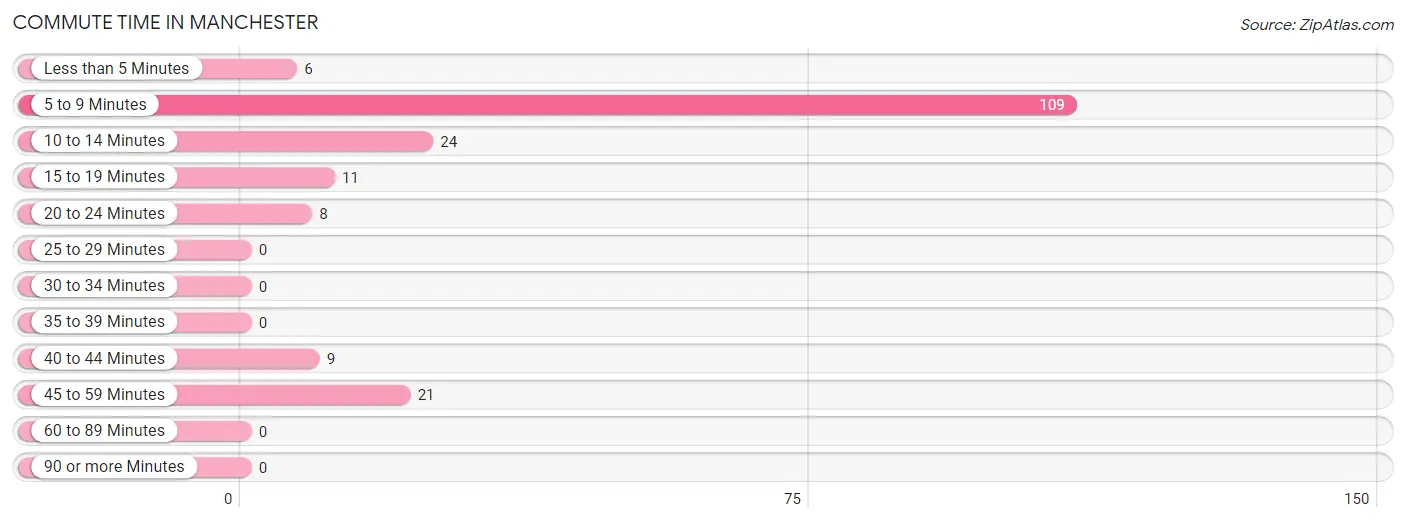
| Commute Time | # Commuters | % Commuters |
| Less than 5 Minutes | 6 | 3.2% |
| 5 to 9 Minutes | 109 | 58.0% |
| 10 to 14 Minutes | 24 | 12.8% |
| 15 to 19 Minutes | 11 | 5.9% |
| 20 to 24 Minutes | 8 | 4.3% |
| 25 to 29 Minutes | 0 | 0.0% |
| 30 to 34 Minutes | 0 | 0.0% |
| 35 to 39 Minutes | 0 | 0.0% |
| 40 to 44 Minutes | 9 | 4.8% |
| 45 to 59 Minutes | 21 | 11.2% |
| 60 to 89 Minutes | 0 | 0.0% |
| 90 or more Minutes | 0 | 0.0% |
Commute Time by Sex in Manchester
The most common commute times in Manchester are 5 to 9 minutes (63 commuters, 58.9%) for males and 5 to 9 minutes (46 commuters, 56.8%) for females.
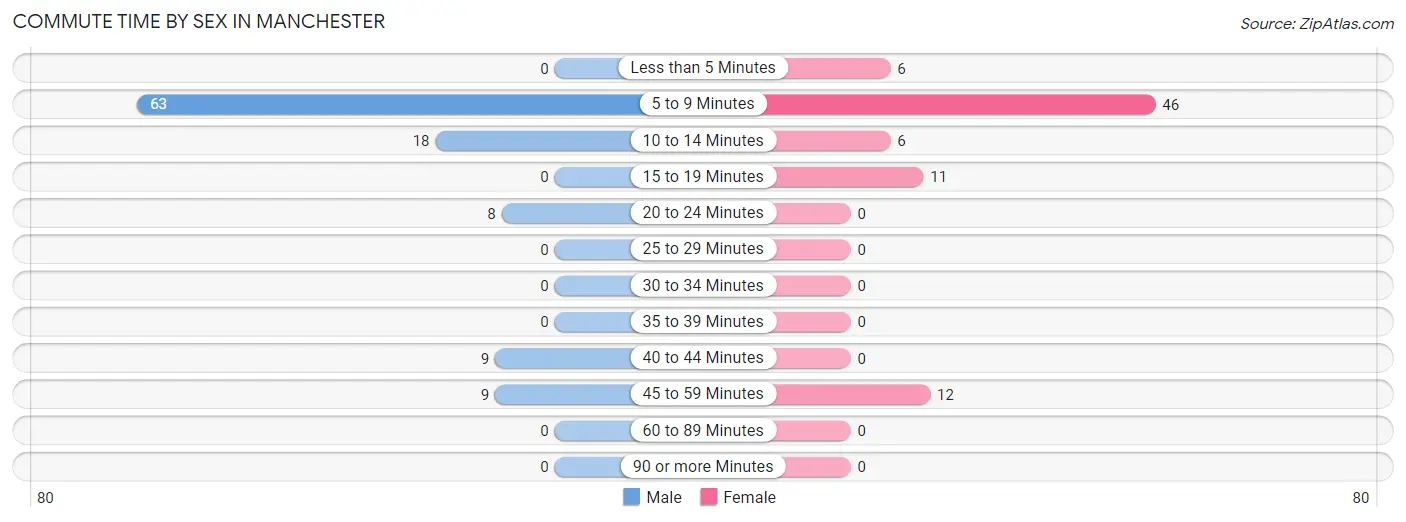
| Commute Time | Male | Female |
| Less than 5 Minutes | 0 (0.0%) | 6 (7.4%) |
| 5 to 9 Minutes | 63 (58.9%) | 46 (56.8%) |
| 10 to 14 Minutes | 18 (16.8%) | 6 (7.4%) |
| 15 to 19 Minutes | 0 (0.0%) | 11 (13.6%) |
| 20 to 24 Minutes | 8 (7.5%) | 0 (0.0%) |
| 25 to 29 Minutes | 0 (0.0%) | 0 (0.0%) |
| 30 to 34 Minutes | 0 (0.0%) | 0 (0.0%) |
| 35 to 39 Minutes | 0 (0.0%) | 0 (0.0%) |
| 40 to 44 Minutes | 9 (8.4%) | 0 (0.0%) |
| 45 to 59 Minutes | 9 (8.4%) | 12 (14.8%) |
| 60 to 89 Minutes | 0 (0.0%) | 0 (0.0%) |
| 90 or more Minutes | 0 (0.0%) | 0 (0.0%) |
Time of Departure to Work by Sex in Manchester
The most frequent times of departure to work in Manchester are 7:30 AM to 7:59 AM (72, 67.3%) for males and 10:00 AM to 10:59 AM (27, 33.3%) for females.
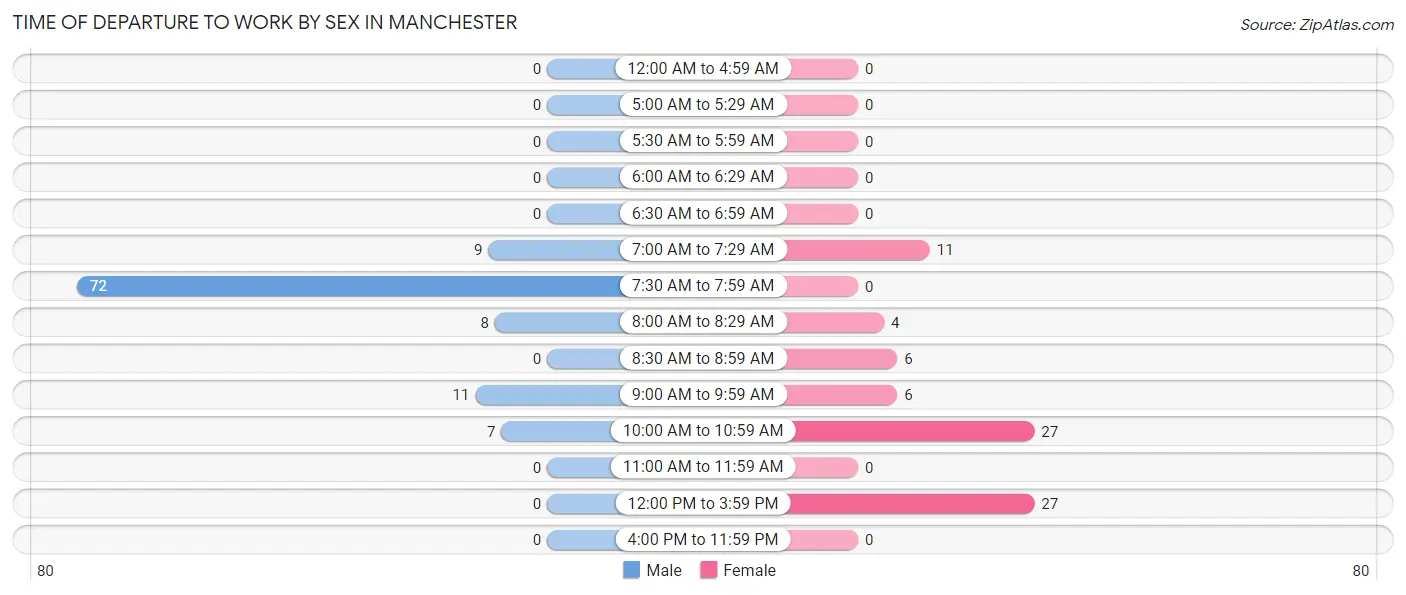
| Time of Departure | Male | Female |
| 12:00 AM to 4:59 AM | 0 (0.0%) | 0 (0.0%) |
| 5:00 AM to 5:29 AM | 0 (0.0%) | 0 (0.0%) |
| 5:30 AM to 5:59 AM | 0 (0.0%) | 0 (0.0%) |
| 6:00 AM to 6:29 AM | 0 (0.0%) | 0 (0.0%) |
| 6:30 AM to 6:59 AM | 0 (0.0%) | 0 (0.0%) |
| 7:00 AM to 7:29 AM | 9 (8.4%) | 11 (13.6%) |
| 7:30 AM to 7:59 AM | 72 (67.3%) | 0 (0.0%) |
| 8:00 AM to 8:29 AM | 8 (7.5%) | 4 (4.9%) |
| 8:30 AM to 8:59 AM | 0 (0.0%) | 6 (7.4%) |
| 9:00 AM to 9:59 AM | 11 (10.3%) | 6 (7.4%) |
| 10:00 AM to 10:59 AM | 7 (6.5%) | 27 (33.3%) |
| 11:00 AM to 11:59 AM | 0 (0.0%) | 0 (0.0%) |
| 12:00 PM to 3:59 PM | 0 (0.0%) | 27 (33.3%) |
| 4:00 PM to 11:59 PM | 0 (0.0%) | 0 (0.0%) |
| Total | 107 (100.0%) | 81 (100.0%) |
Housing Occupancy in Manchester
Occupancy by Ownership in Manchester
Of the total 111 dwellings in Manchester, owner-occupied units account for 42 (37.8%), while renter-occupied units make up 69 (62.2%).
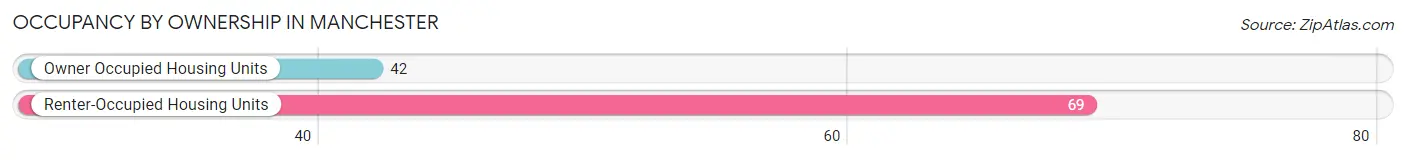
| Occupancy | # Housing Units | % Housing Units |
| Owner Occupied Housing Units | 42 | 37.8% |
| Renter-Occupied Housing Units | 69 | 62.2% |
| Total Occupied Housing Units | 111 | 100.0% |
Occupancy by Household Size in Manchester
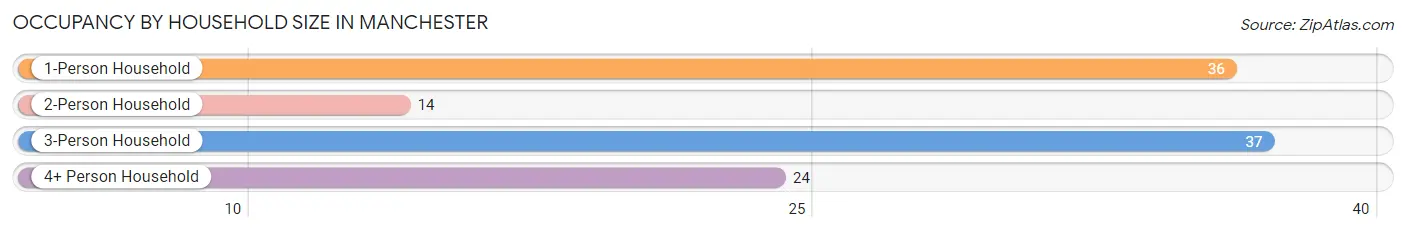
| Household Size | # Housing Units | % Housing Units |
| 1-Person Household | 36 | 32.4% |
| 2-Person Household | 14 | 12.6% |
| 3-Person Household | 37 | 33.3% |
| 4+ Person Household | 24 | 21.6% |
| Total Housing Units | 111 | 100.0% |
Occupancy by Ownership by Household Size in Manchester
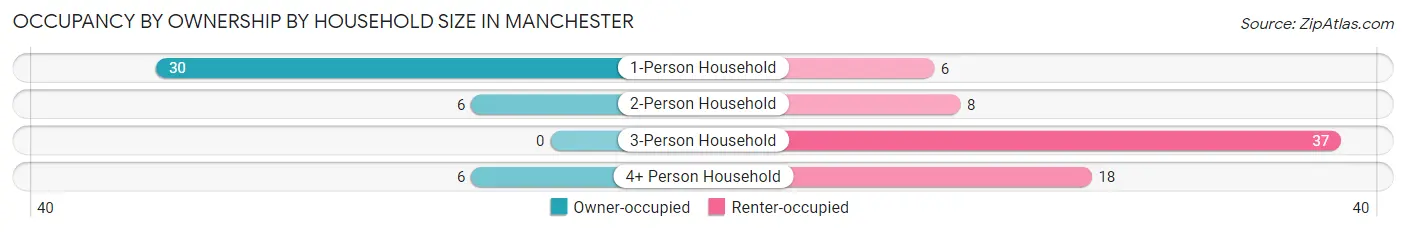
| Household Size | Owner-occupied | Renter-occupied |
| 1-Person Household | 30 (83.3%) | 6 (16.7%) |
| 2-Person Household | 6 (42.9%) | 8 (57.1%) |
| 3-Person Household | 0 (0.0%) | 37 (100.0%) |
| 4+ Person Household | 6 (25.0%) | 18 (75.0%) |
| Total Housing Units | 42 (37.8%) | 69 (62.2%) |
Occupancy by Educational Attainment in Manchester
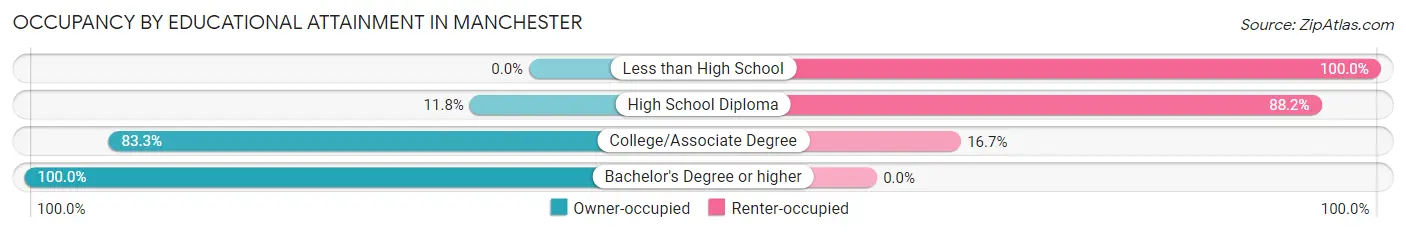
| Household Size | Owner-occupied | Renter-occupied |
| Less than High School | 0 (0.0%) | 18 (100.0%) |
| High School Diploma | 6 (11.8%) | 45 (88.2%) |
| College/Associate Degree | 30 (83.3%) | 6 (16.7%) |
| Bachelor's Degree or higher | 6 (100.0%) | 0 (0.0%) |
Occupancy by Age of Householder in Manchester
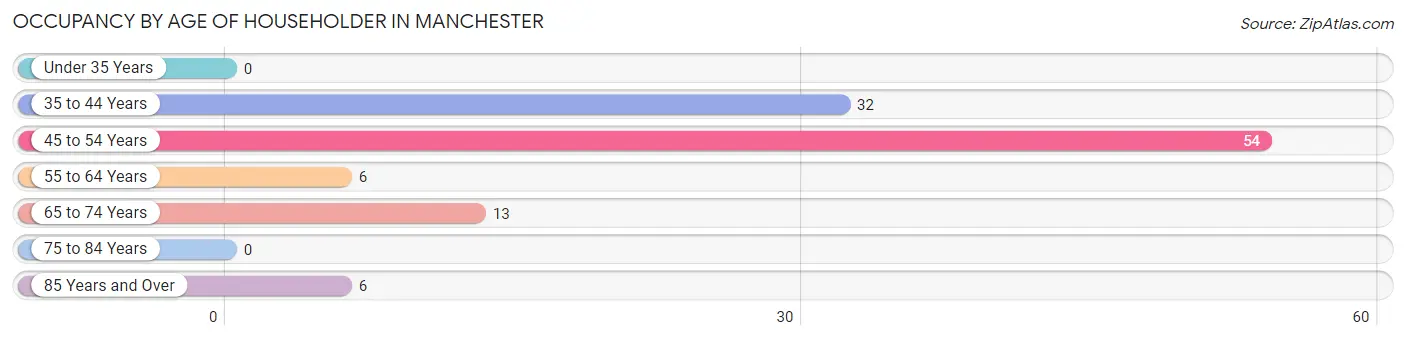
| Age Bracket | # Households | % Households |
| Under 35 Years | 0 | 0.0% |
| 35 to 44 Years | 32 | 28.8% |
| 45 to 54 Years | 54 | 48.6% |
| 55 to 64 Years | 6 | 5.4% |
| 65 to 74 Years | 13 | 11.7% |
| 75 to 84 Years | 0 | 0.0% |
| 85 Years and Over | 6 | 5.4% |
| Total | 111 | 100.0% |
Housing Finances in Manchester
Median Income by Occupancy in Manchester
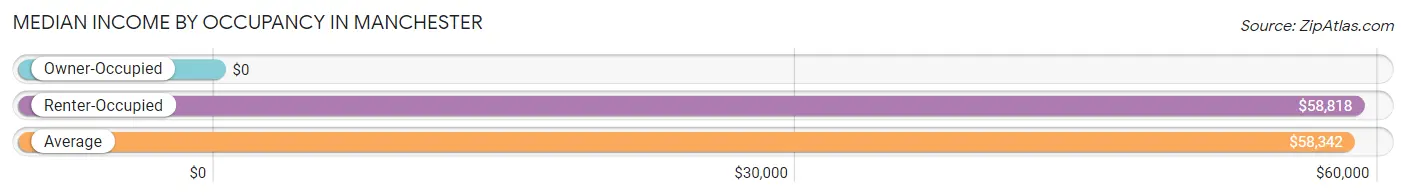
| Occupancy Type | # Households | Median Income |
| Owner-Occupied | 42 (37.8%) | $0 |
| Renter-Occupied | 69 (62.2%) | $58,818 |
| Average | 111 (100.0%) | $58,342 |
Occupancy by Householder Income Bracket in Manchester
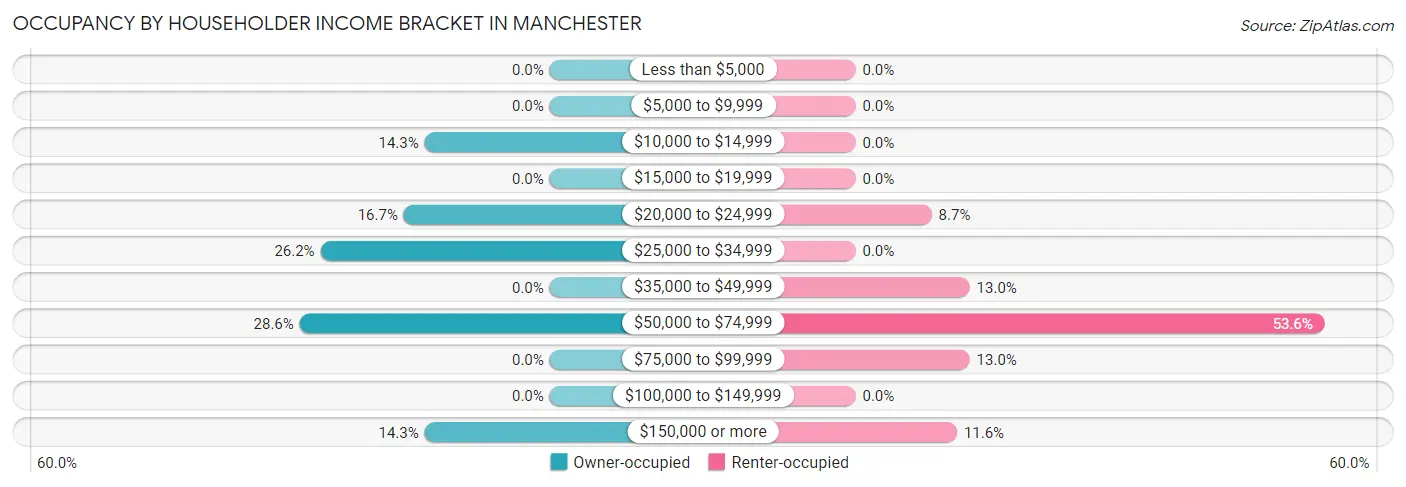
| Income Bracket | Owner-occupied | Renter-occupied |
| Less than $5,000 | 0 (0.0%) | 0 (0.0%) |
| $5,000 to $9,999 | 0 (0.0%) | 0 (0.0%) |
| $10,000 to $14,999 | 6 (14.3%) | 0 (0.0%) |
| $15,000 to $19,999 | 0 (0.0%) | 0 (0.0%) |
| $20,000 to $24,999 | 7 (16.7%) | 6 (8.7%) |
| $25,000 to $34,999 | 11 (26.2%) | 0 (0.0%) |
| $35,000 to $49,999 | 0 (0.0%) | 9 (13.0%) |
| $50,000 to $74,999 | 12 (28.6%) | 37 (53.6%) |
| $75,000 to $99,999 | 0 (0.0%) | 9 (13.0%) |
| $100,000 to $149,999 | 0 (0.0%) | 0 (0.0%) |
| $150,000 or more | 6 (14.3%) | 8 (11.6%) |
| Total | 42 (100.0%) | 69 (100.0%) |
Monthly Housing Cost Tiers in Manchester
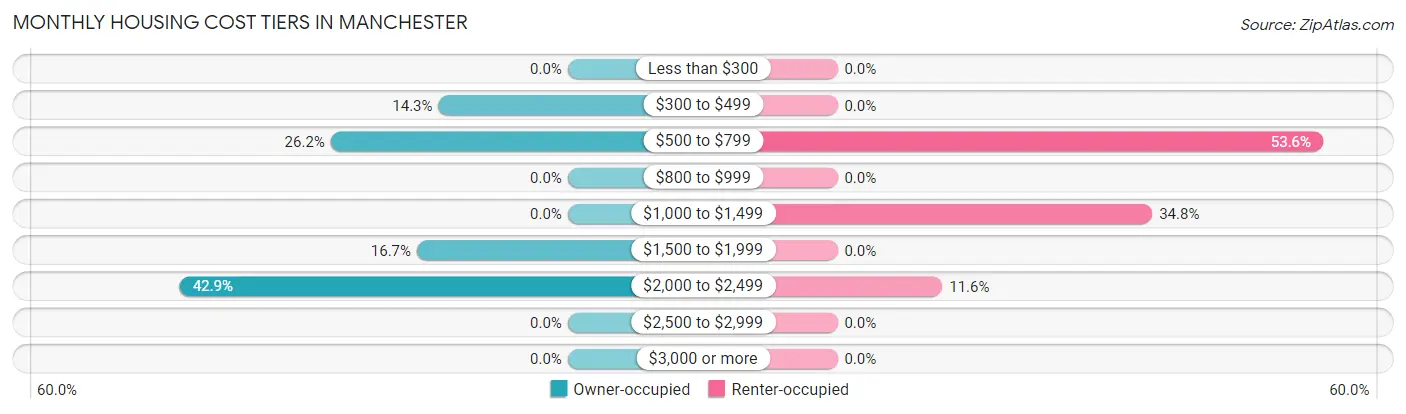
| Monthly Cost | Owner-occupied | Renter-occupied |
| Less than $300 | 0 (0.0%) | 0 (0.0%) |
| $300 to $499 | 6 (14.3%) | 0 (0.0%) |
| $500 to $799 | 11 (26.2%) | 37 (53.6%) |
| $800 to $999 | 0 (0.0%) | 0 (0.0%) |
| $1,000 to $1,499 | 0 (0.0%) | 24 (34.8%) |
| $1,500 to $1,999 | 7 (16.7%) | 0 (0.0%) |
| $2,000 to $2,499 | 18 (42.9%) | 8 (11.6%) |
| $2,500 to $2,999 | 0 (0.0%) | 0 (0.0%) |
| $3,000 or more | 0 (0.0%) | 0 (0.0%) |
| Total | 42 (100.0%) | 69 (100.0%) |
Physical Housing Characteristics in Manchester
Housing Structures in Manchester
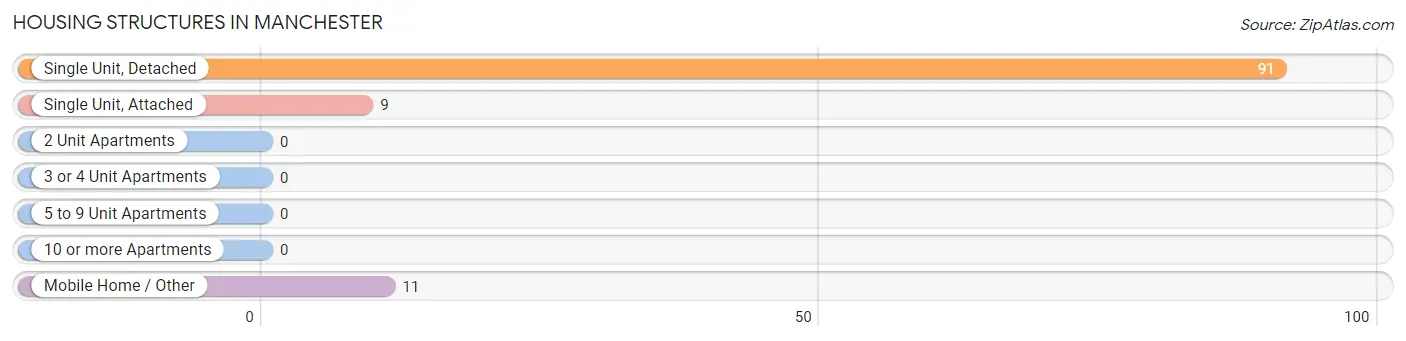
| Structure Type | # Housing Units | % Housing Units |
| Single Unit, Detached | 91 | 82.0% |
| Single Unit, Attached | 9 | 8.1% |
| 2 Unit Apartments | 0 | 0.0% |
| 3 or 4 Unit Apartments | 0 | 0.0% |
| 5 to 9 Unit Apartments | 0 | 0.0% |
| 10 or more Apartments | 0 | 0.0% |
| Mobile Home / Other | 11 | 9.9% |
| Total | 111 | 100.0% |
Housing Structures by Occupancy in Manchester
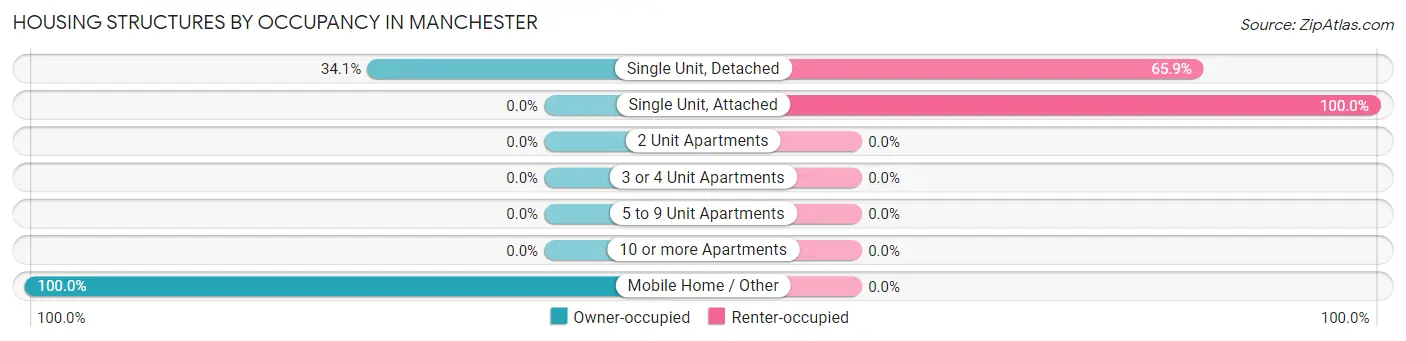
| Structure Type | Owner-occupied | Renter-occupied |
| Single Unit, Detached | 31 (34.1%) | 60 (65.9%) |
| Single Unit, Attached | 0 (0.0%) | 9 (100.0%) |
| 2 Unit Apartments | 0 (0.0%) | 0 (0.0%) |
| 3 or 4 Unit Apartments | 0 (0.0%) | 0 (0.0%) |
| 5 to 9 Unit Apartments | 0 (0.0%) | 0 (0.0%) |
| 10 or more Apartments | 0 (0.0%) | 0 (0.0%) |
| Mobile Home / Other | 11 (100.0%) | 0 (0.0%) |
| Total | 42 (37.8%) | 69 (62.2%) |
Housing Structures by Number of Rooms in Manchester
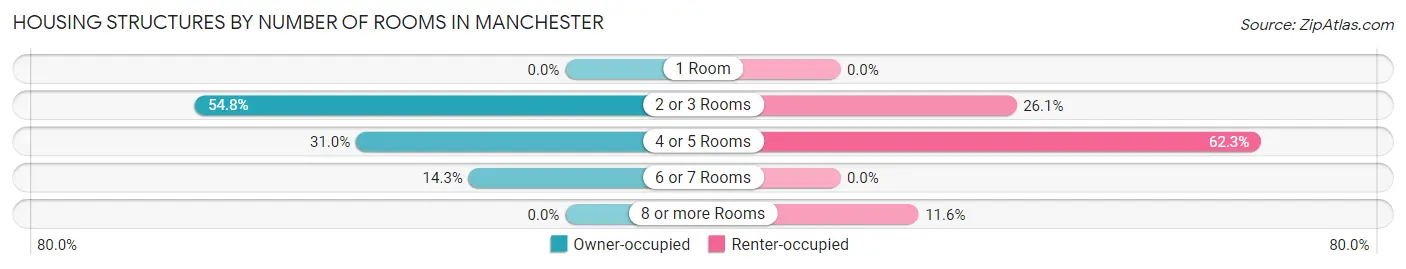
| Number of Rooms | Owner-occupied | Renter-occupied |
| 1 Room | 0 (0.0%) | 0 (0.0%) |
| 2 or 3 Rooms | 23 (54.8%) | 18 (26.1%) |
| 4 or 5 Rooms | 13 (30.9%) | 43 (62.3%) |
| 6 or 7 Rooms | 6 (14.3%) | 0 (0.0%) |
| 8 or more Rooms | 0 (0.0%) | 8 (11.6%) |
| Total | 42 (100.0%) | 69 (100.0%) |
Housing Structure by Heating Type in Manchester
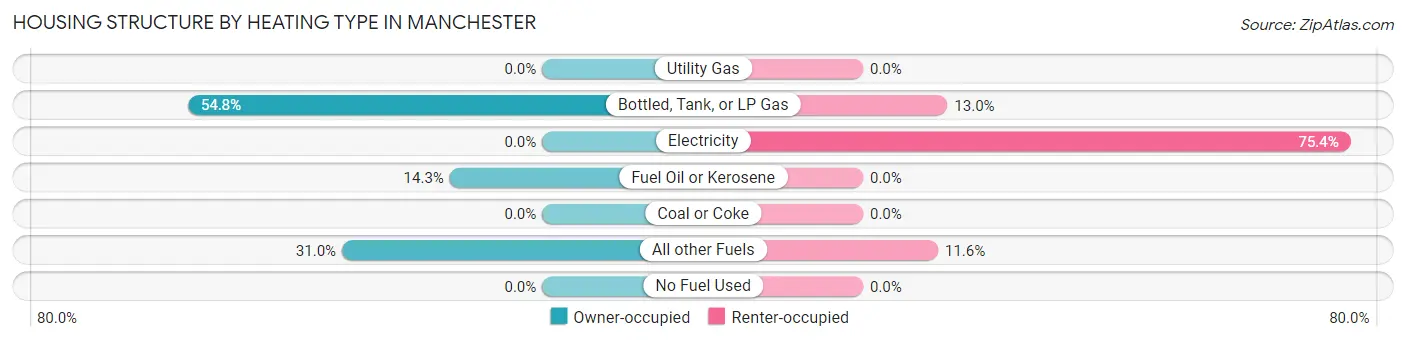
| Heating Type | Owner-occupied | Renter-occupied |
| Utility Gas | 0 (0.0%) | 0 (0.0%) |
| Bottled, Tank, or LP Gas | 23 (54.8%) | 9 (13.0%) |
| Electricity | 0 (0.0%) | 52 (75.4%) |
| Fuel Oil or Kerosene | 6 (14.3%) | 0 (0.0%) |
| Coal or Coke | 0 (0.0%) | 0 (0.0%) |
| All other Fuels | 13 (30.9%) | 8 (11.6%) |
| No Fuel Used | 0 (0.0%) | 0 (0.0%) |
| Total | 42 (100.0%) | 69 (100.0%) |
Household Vehicle Usage in Manchester
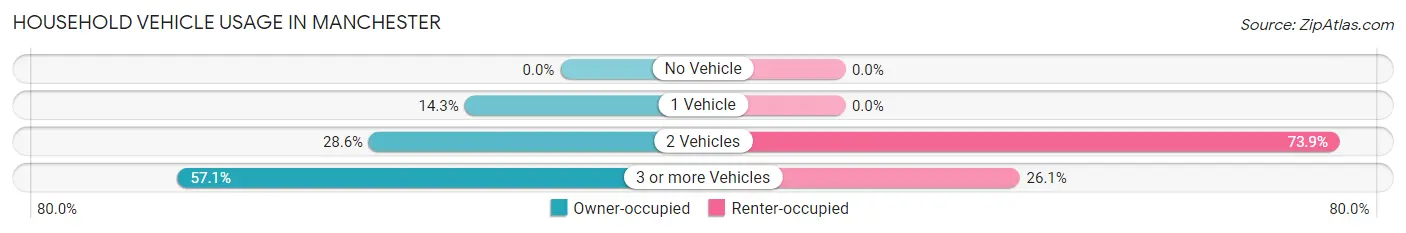
| Vehicles per Household | Owner-occupied | Renter-occupied |
| No Vehicle | 0 (0.0%) | 0 (0.0%) |
| 1 Vehicle | 6 (14.3%) | 0 (0.0%) |
| 2 Vehicles | 12 (28.6%) | 51 (73.9%) |
| 3 or more Vehicles | 24 (57.1%) | 18 (26.1%) |
| Total | 42 (100.0%) | 69 (100.0%) |
Real Estate & Mortgages in Manchester
Real Estate and Mortgage Overview in Manchester
| Characteristic | Without Mortgage | With Mortgage |
| Housing Units | 17 | 25 |
| Median Property Value | - | - |
| Median Household Income | - | - |
| Monthly Housing Costs | - | - |
| Real Estate Taxes | - | - |
Property Value by Mortgage Status in Manchester
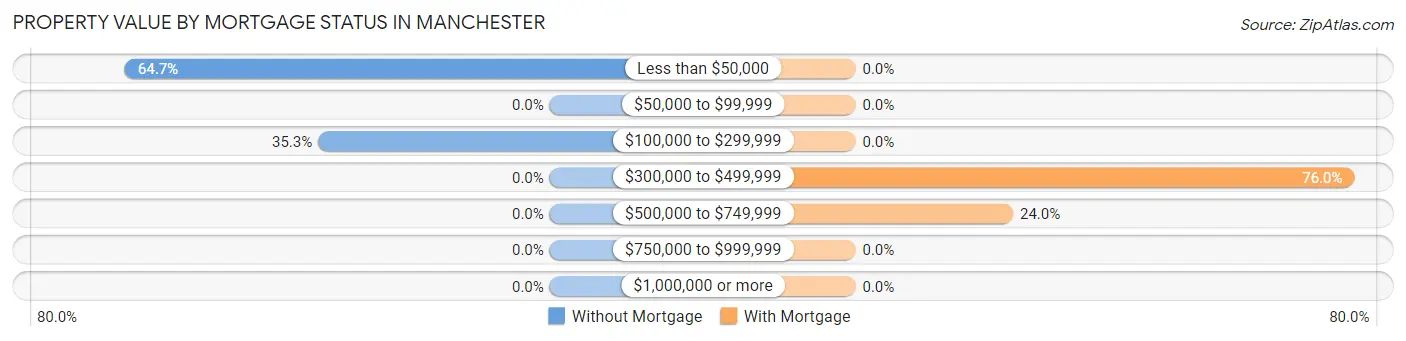
| Property Value | Without Mortgage | With Mortgage |
| Less than $50,000 | 11 (64.7%) | 0 (0.0%) |
| $50,000 to $99,999 | 0 (0.0%) | 0 (0.0%) |
| $100,000 to $299,999 | 6 (35.3%) | 0 (0.0%) |
| $300,000 to $499,999 | 0 (0.0%) | 19 (76.0%) |
| $500,000 to $749,999 | 0 (0.0%) | 6 (24.0%) |
| $750,000 to $999,999 | 0 (0.0%) | 0 (0.0%) |
| $1,000,000 or more | 0 (0.0%) | 0 (0.0%) |
| Total | 17 (100.0%) | 25 (100.0%) |
Household Income by Mortgage Status in Manchester
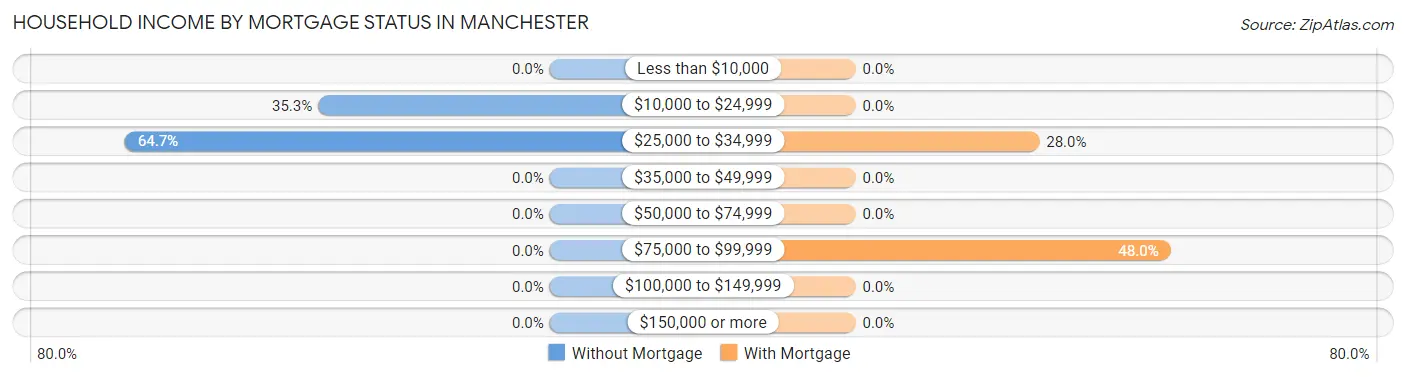
| Household Income | Without Mortgage | With Mortgage |
| Less than $10,000 | 0 (0.0%) | 0 (0.0%) |
| $10,000 to $24,999 | 6 (35.3%) | 0 (0.0%) |
| $25,000 to $34,999 | 11 (64.7%) | 7 (28.0%) |
| $35,000 to $49,999 | 0 (0.0%) | 0 (0.0%) |
| $50,000 to $74,999 | 0 (0.0%) | 0 (0.0%) |
| $75,000 to $99,999 | 0 (0.0%) | 12 (48.0%) |
| $100,000 to $149,999 | 0 (0.0%) | 0 (0.0%) |
| $150,000 or more | 0 (0.0%) | 0 (0.0%) |
| Total | 17 (100.0%) | 25 (100.0%) |
Property Value to Household Income Ratio in Manchester
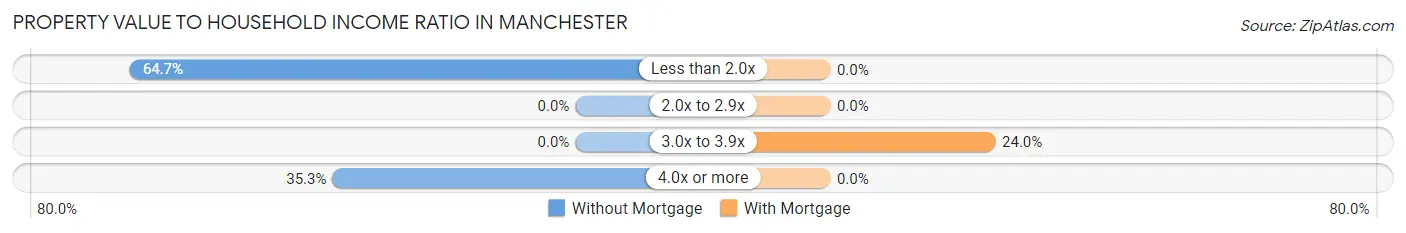
| Value-to-Income Ratio | Without Mortgage | With Mortgage |
| Less than 2.0x | 11 (64.7%) | 0 (0.0%) |
| 2.0x to 2.9x | 0 (0.0%) | 0 (0.0%) |
| 3.0x to 3.9x | 0 (0.0%) | 6 (24.0%) |
| 4.0x or more | 6 (35.3%) | 0 (0.0%) |
| Total | 17 (100.0%) | 25 (100.0%) |
Real Estate Taxes by Mortgage Status in Manchester
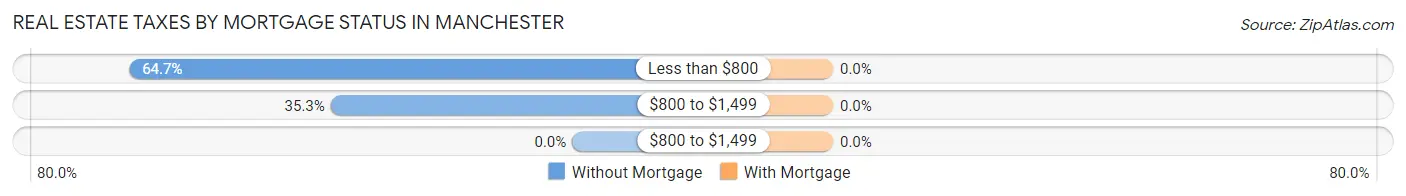
| Property Taxes | Without Mortgage | With Mortgage |
| Less than $800 | 11 (64.7%) | 0 (0.0%) |
| $800 to $1,499 | 6 (35.3%) | 0 (0.0%) |
| $800 to $1,499 | 0 (0.0%) | 0 (0.0%) |
| Total | 17 (100.0%) | 25 (100.0%) |
Health & Disability in Manchester
Health Insurance Coverage by Age in Manchester
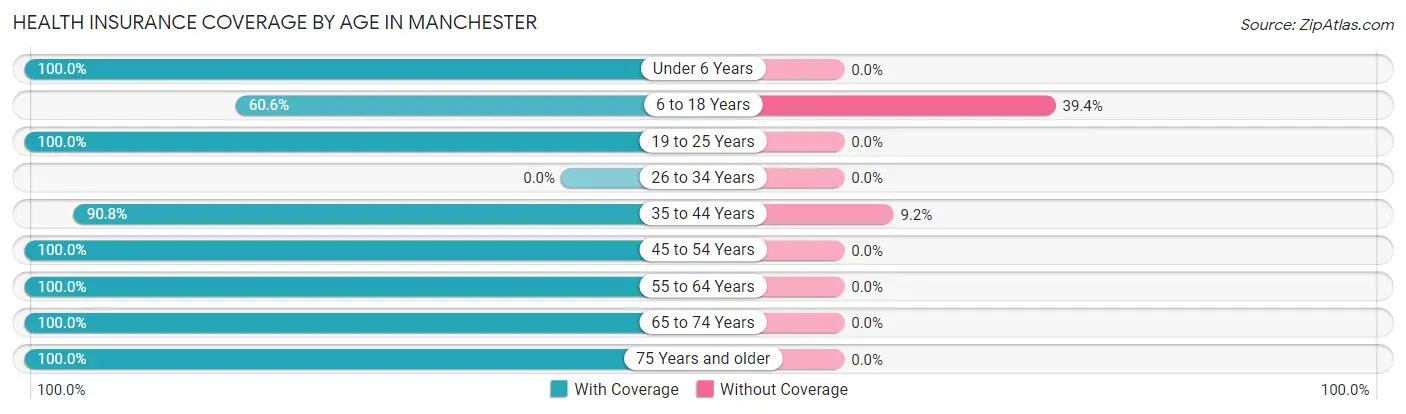
| Age Bracket | With Coverage | Without Coverage |
| Under 6 Years | 23 (100.0%) | 0 (0.0%) |
| 6 to 18 Years | 40 (60.6%) | 26 (39.4%) |
| 19 to 25 Years | 12 (100.0%) | 0 (0.0%) |
| 26 to 34 Years | 0 (0.0%) | 0 (0.0%) |
| 35 to 44 Years | 89 (90.8%) | 9 (9.2%) |
| 45 to 54 Years | 69 (100.0%) | 0 (0.0%) |
| 55 to 64 Years | 6 (100.0%) | 0 (0.0%) |
| 65 to 74 Years | 18 (100.0%) | 0 (0.0%) |
| 75 Years and older | 6 (100.0%) | 0 (0.0%) |
| Total | 263 (88.3%) | 35 (11.7%) |
Health Insurance Coverage by Citizenship Status in Manchester
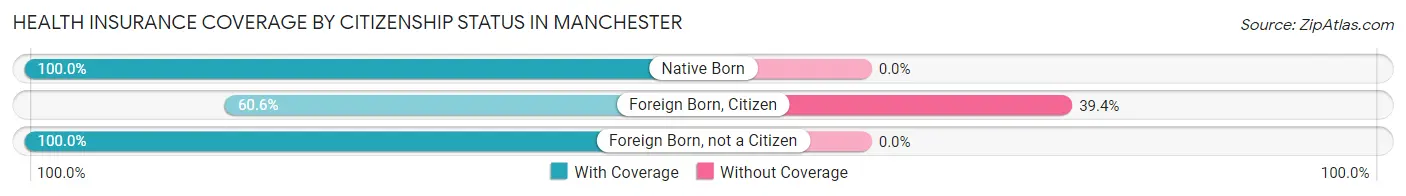
| Citizenship Status | With Coverage | Without Coverage |
| Native Born | 23 (100.0%) | 0 (0.0%) |
| Foreign Born, Citizen | 40 (60.6%) | 26 (39.4%) |
| Foreign Born, not a Citizen | 12 (100.0%) | 0 (0.0%) |
Health Insurance Coverage by Household Income in Manchester
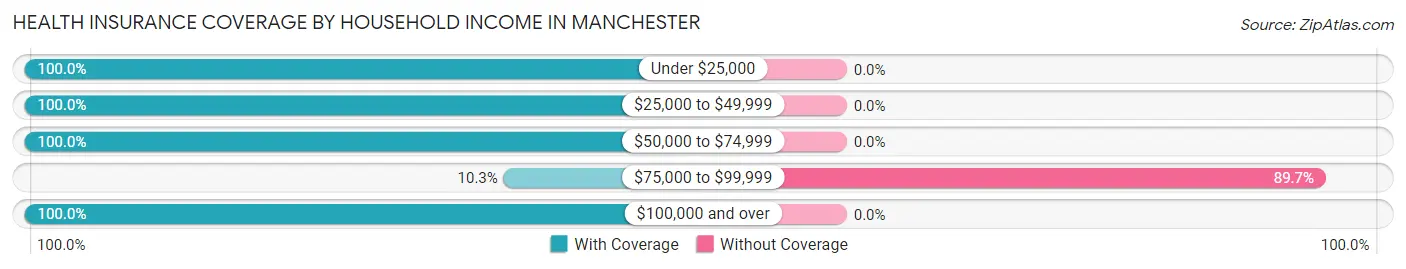
| Household Income | With Coverage | Without Coverage |
| Under $25,000 | 19 (100.0%) | 0 (0.0%) |
| $25,000 to $49,999 | 52 (100.0%) | 0 (0.0%) |
| $50,000 to $74,999 | 158 (100.0%) | 0 (0.0%) |
| $75,000 to $99,999 | 4 (10.3%) | 35 (89.7%) |
| $100,000 and over | 30 (100.0%) | 0 (0.0%) |
Public vs Private Health Insurance Coverage by Age in Manchester
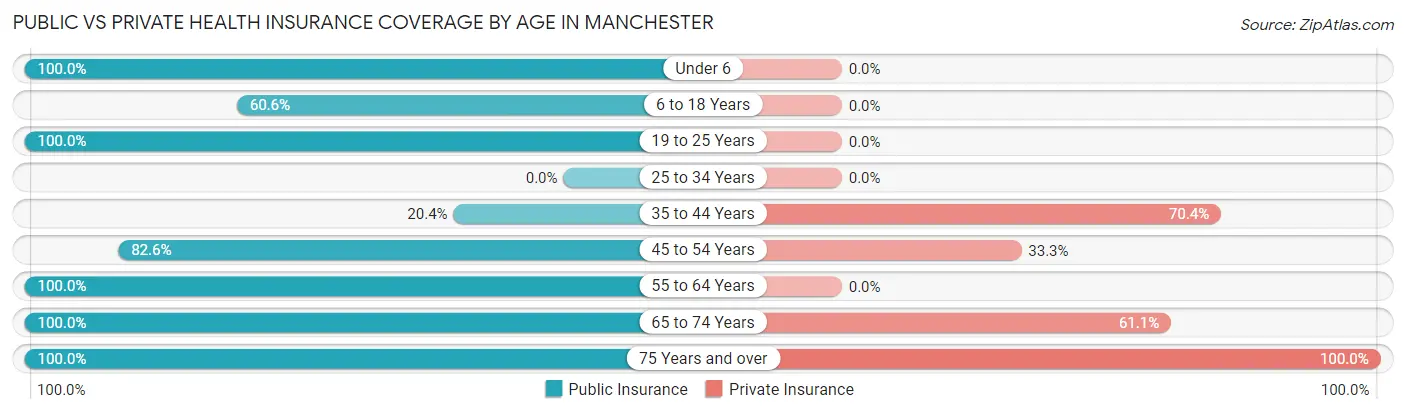
| Age Bracket | Public Insurance | Private Insurance |
| Under 6 | 23 (100.0%) | 0 (0.0%) |
| 6 to 18 Years | 40 (60.6%) | 0 (0.0%) |
| 19 to 25 Years | 12 (100.0%) | 0 (0.0%) |
| 25 to 34 Years | 0 (0.0%) | 0 (0.0%) |
| 35 to 44 Years | 20 (20.4%) | 69 (70.4%) |
| 45 to 54 Years | 57 (82.6%) | 23 (33.3%) |
| 55 to 64 Years | 6 (100.0%) | 0 (0.0%) |
| 65 to 74 Years | 18 (100.0%) | 11 (61.1%) |
| 75 Years and over | 6 (100.0%) | 6 (100.0%) |
| Total | 182 (61.1%) | 109 (36.6%) |
Disability Status by Sex by Age in Manchester
| Age Bracket | Male | Female |
| Under 5 Years | 0 (0.0%) | 0 (0.0%) |
| 5 to 17 Years | 0 (0.0%) | 0 (0.0%) |
| 18 to 34 Years | 0 (0.0%) | 0 (0.0%) |
| 35 to 64 Years | 0 (0.0%) | 0 (0.0%) |
| 65 to 74 Years | 0 (0.0%) | 0 (0.0%) |
| 75 Years and over | 0 (0.0%) | 0 (0.0%) |
Disability Class by Sex by Age in Manchester
Disability Class: Hearing Difficulty
| Age Bracket | Male | Female |
| Under 5 Years | 0 (0.0%) | 0 (0.0%) |
| 5 to 17 Years | 0 (0.0%) | 0 (0.0%) |
| 18 to 34 Years | 0 (0.0%) | 0 (0.0%) |
| 35 to 64 Years | 0 (0.0%) | 0 (0.0%) |
| 65 to 74 Years | 0 (0.0%) | 0 (0.0%) |
| 75 Years and over | 0 (0.0%) | 0 (0.0%) |
Disability Class: Vision Difficulty
| Age Bracket | Male | Female |
| Under 5 Years | 0 (0.0%) | 0 (0.0%) |
| 5 to 17 Years | 0 (0.0%) | 0 (0.0%) |
| 18 to 34 Years | 0 (0.0%) | 0 (0.0%) |
| 35 to 64 Years | 0 (0.0%) | 0 (0.0%) |
| 65 to 74 Years | 0 (0.0%) | 0 (0.0%) |
| 75 Years and over | 0 (0.0%) | 0 (0.0%) |
Disability Class: Cognitive Difficulty
| Age Bracket | Male | Female |
| 5 to 17 Years | 0 (0.0%) | 0 (0.0%) |
| 18 to 34 Years | 0 (0.0%) | 0 (0.0%) |
| 35 to 64 Years | 0 (0.0%) | 0 (0.0%) |
| 65 to 74 Years | 0 (0.0%) | 0 (0.0%) |
| 75 Years and over | 0 (0.0%) | 0 (0.0%) |
Disability Class: Ambulatory Difficulty
| Age Bracket | Male | Female |
| 5 to 17 Years | 0 (0.0%) | 0 (0.0%) |
| 18 to 34 Years | 0 (0.0%) | 0 (0.0%) |
| 35 to 64 Years | 0 (0.0%) | 0 (0.0%) |
| 65 to 74 Years | 0 (0.0%) | 0 (0.0%) |
| 75 Years and over | 0 (0.0%) | 0 (0.0%) |
Disability Class: Self-Care Difficulty
| Age Bracket | Male | Female |
| 5 to 17 Years | 0 (0.0%) | 0 (0.0%) |
| 18 to 34 Years | 0 (0.0%) | 0 (0.0%) |
| 35 to 64 Years | 0 (0.0%) | 0 (0.0%) |
| 65 to 74 Years | 0 (0.0%) | 0 (0.0%) |
| 75 Years and over | 0 (0.0%) | 0 (0.0%) |
Technology Access in Manchester
Computing Device Access in Manchester
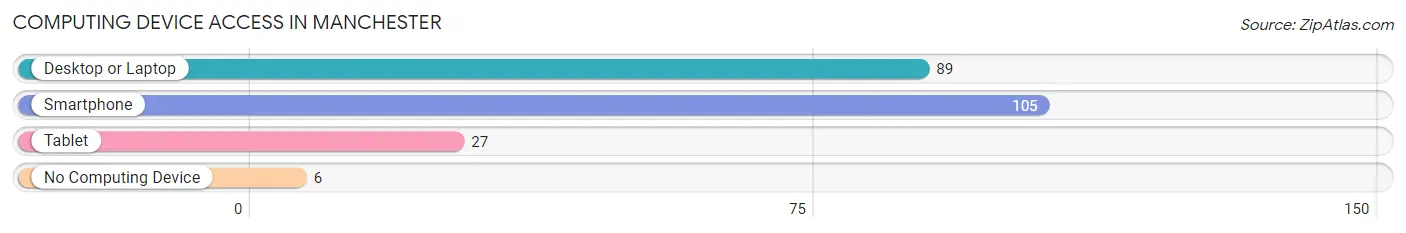
| Device Type | # Households | % Households |
| Desktop or Laptop | 89 | 80.2% |
| Smartphone | 105 | 94.6% |
| Tablet | 27 | 24.3% |
| No Computing Device | 6 | 5.4% |
| Total | 111 | 100.0% |
Internet Access in Manchester
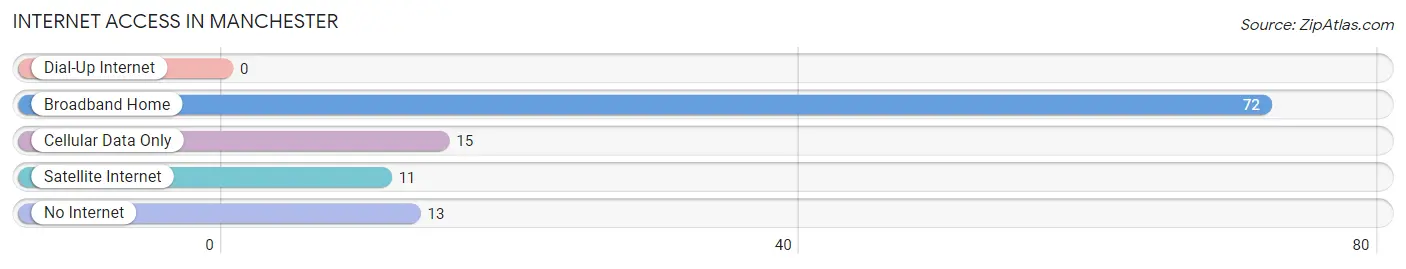
| Internet Type | # Households | % Households |
| Dial-Up Internet | 0 | 0.0% |
| Broadband Home | 72 | 64.9% |
| Cellular Data Only | 15 | 13.5% |
| Satellite Internet | 11 | 9.9% |
| No Internet | 13 | 11.7% |
| Total | 111 | 100.0% |
Manchester Summary
Manchester is a city located in the county of Greater Manchester, England. It is the third most populous city in the United Kingdom, with a population of 545,500 in 2019. It is the second largest city in the North West of England, after Liverpool. Manchester is a major centre of culture, media, and commerce, and is home to two universities, the University of Manchester and Manchester Metropolitan University.
Geography
Manchester is located in the North West of England, in the county of Greater Manchester. It is situated at the confluence of the rivers Irwell and Medlock, and is surrounded by the Pennines to the north and east, and the Cheshire Plain to the south. The city centre is located in the south-east of the city, and is home to many of the city's major attractions, including the Manchester Arena, the Manchester Art Gallery, and the Manchester Museum.
The city is divided into several districts, including Ancoats, Ardwick, Beswick, Cheetham Hill, Chorlton, Didsbury, Fallowfield, Gorton, Hulme, Moss Side, and Rusholme. The city is also home to several parks, including Heaton Park, Platt Fields Park, and Whitworth Park.
Economy
Manchester is a major economic centre in the North West of England, and is home to a number of large companies, including the BBC, ITV, and the Co-operative Group. The city is also home to a number of financial institutions, including the Royal Bank of Scotland, Barclays, and HSBC.
Manchester is a major centre for the media and creative industries, and is home to a number of television and radio stations, including BBC North West, ITV Granada, and Channel M. The city is also home to a number of film and television production companies, including the BBC, ITV, and Channel 4.
Demographics
As of 2019, the population of Manchester was estimated to be 545,500. The city has a diverse population, with the largest ethnic group being White British (63.2%), followed by Asian (17.2%), Black (7.2%), and Mixed (5.2%). The city also has a large student population, with over 100,000 students enrolled at the two universities in the city.
Manchester is a major centre for immigration, with a large number of people from South Asia, the Middle East, and Africa living in the city. The city also has a large LGBT population, with Manchester Pride being one of the largest LGBT events in the UK.
Conclusion
Manchester is a major city in the North West of England, and is home to a diverse population, a thriving economy, and a vibrant culture. The city is a major centre for the media and creative industries, and is home to two universities, the University of Manchester and Manchester Metropolitan University. Manchester is a major centre for immigration, and is home to a large number of people from South Asia, the Middle East, and Africa. The city is also home to a large LGBT population, and is home to one of the largest LGBT events in the UK.
Common Questions
What is Per Capita Income in Manchester?
Per Capita income in Manchester is $26,763.
What is the Median Household income in Manchester?
Median Household Income in Manchester is $58,342.
What is Income or Wage Gap in Manchester?
Income or Wage Gap in Manchester is 65.9%.
Women in Manchester earn 34.1 cents for every dollar earned by a man.
What is Inequality or Gini Index in Manchester?
Inequality or Gini Index in Manchester is 0.37.
What is the Total Population of Manchester?
Total Population of Manchester is 298.
What is the Total Male Population of Manchester?
Total Male Population of Manchester is 162.
What is the Total Female Population of Manchester?
Total Female Population of Manchester is 136.
What is the Ratio of Males per 100 Females in Manchester?
There are 119.12 Males per 100 Females in Manchester.
What is the Ratio of Females per 100 Males in Manchester?
There are 83.95 Females per 100 Males in Manchester.
What is the Median Population Age in Manchester?
Median Population Age in Manchester is 44.1 Years.
What is the Average Family Size in Manchester
Average Family Size in Manchester is 2.8 People.
What is the Average Household Size in Manchester
Average Household Size in Manchester is 2.7 People.
How Large is the Labor Force in Manchester?
There are 250 People in the Labor Forcein in Manchester.
What is the Percentage of People in the Labor Force in Manchester?
90.9% of People are in the Labor Force in Manchester.
What is the Unemployment Rate in Manchester?
Unemployment Rate in Manchester is 5.6%.