Cities with the Highest Percentage of Population with a Degree in Visual and Performing Arts in Iowa
RELATED REPORTS & OPTIONS
Visual and Performing Arts
Iowa
Compare Cities
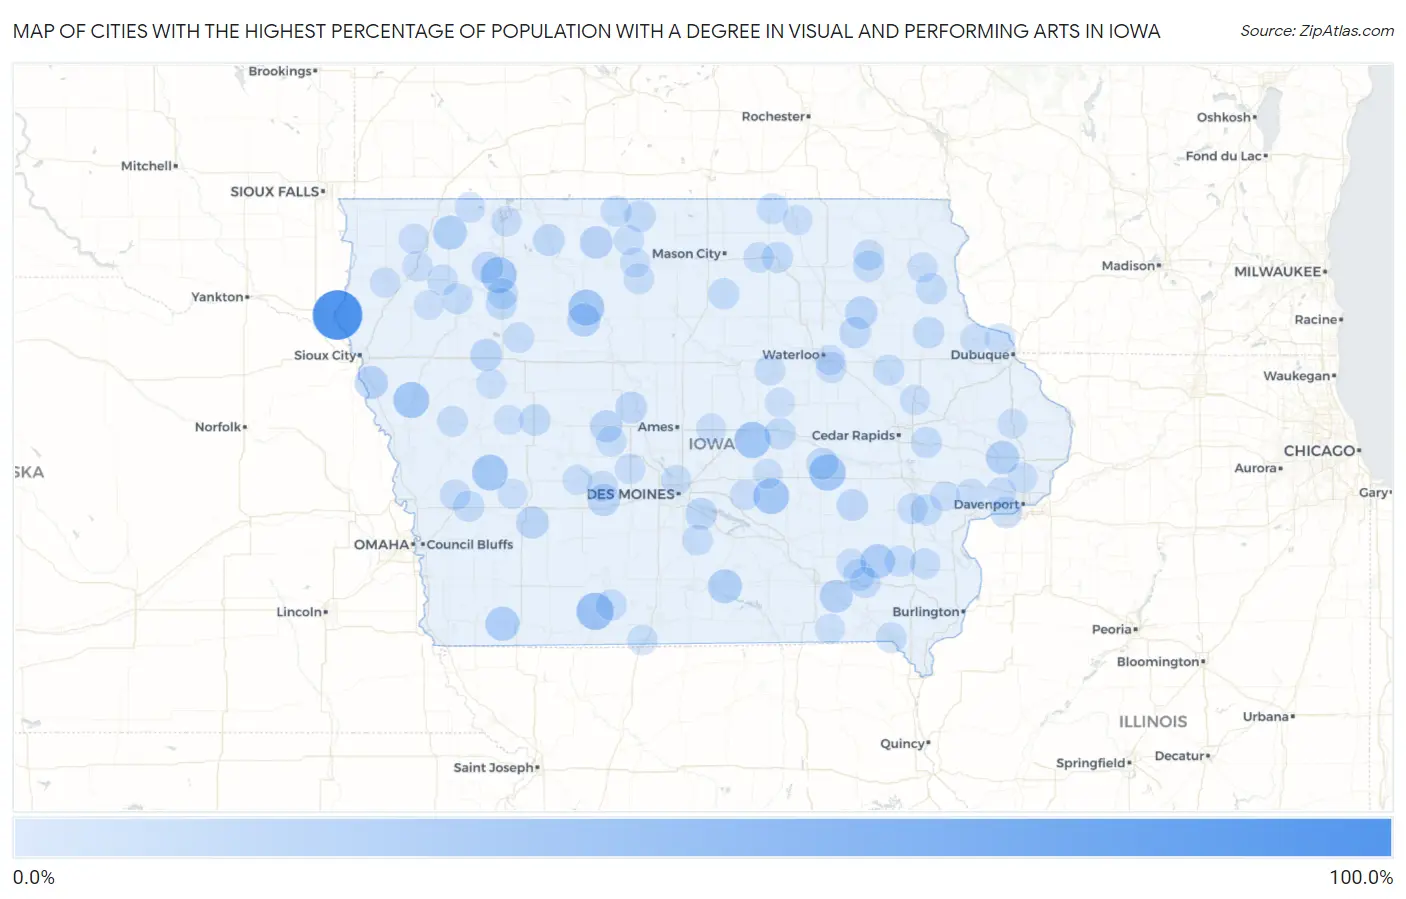
Map of Cities with the Highest Percentage of Population with a Degree in Visual and Performing Arts in Iowa
0.0%
100.0%
Cities with the Highest Percentage of Population with a Degree in Visual and Performing Arts in Iowa
| City | % Graduates | vs State | vs National | |
| 1. | Westfield | 100.0% | 3.5%(+96.5)#1 | 4.3%(+95.7)#23 |
| 2. | Diagonal | 39.1% | 3.5%(+35.6)#2 | 4.3%(+34.8)#181 |
| 3. | Victor | 35.4% | 3.5%(+31.9)#3 | 4.3%(+31.2)#221 |
| 4. | Haverhill | 34.4% | 3.5%(+30.9)#4 | 4.3%(+30.1)#237 |
| 5. | Bradgate | 33.3% | 3.5%(+29.8)#5 | 4.3%(+29.1)#256 |
| 6. | Rossie | 33.3% | 3.5%(+29.8)#6 | 4.3%(+29.1)#265 |
| 7. | Rodney | 33.3% | 3.5%(+29.8)#7 | 4.3%(+29.1)#267 |
| 8. | Kirkman | 33.3% | 3.5%(+29.8)#8 | 4.3%(+29.1)#268 |
| 9. | Lynnville | 32.7% | 3.5%(+29.2)#9 | 4.3%(+28.5)#276 |
| 10. | Pleasant Plain | 25.0% | 3.5%(+21.5)#10 | 4.3%(+20.7)#442 |
| 11. | Yorktown | 25.0% | 3.5%(+21.5)#11 | 4.3%(+20.7)#445 |
| 12. | Russell | 24.2% | 3.5%(+20.7)#12 | 4.3%(+20.0)#457 |
| 13. | Melvin | 23.8% | 3.5%(+20.3)#13 | 4.3%(+19.6)#464 |
| 14. | Calamus | 21.7% | 3.5%(+18.2)#14 | 4.3%(+17.4)#544 |
| 15. | Gilmore City | 21.2% | 3.5%(+17.6)#15 | 4.3%(+16.9)#567 |
| 16. | Salix | 20.6% | 3.5%(+17.1)#16 | 4.3%(+16.3)#595 |
| 17. | Eldon | 20.0% | 3.5%(+16.5)#17 | 4.3%(+15.7)#623 |
| 18. | Fairport | 19.4% | 3.5%(+15.9)#18 | 4.3%(+15.1)#679 |
| 19. | Lone Rock | 18.8% | 3.5%(+15.2)#19 | 4.3%(+14.5)#734 |
| 20. | Wiota | 18.2% | 3.5%(+14.7)#20 | 4.3%(+13.9)#771 |
| 21. | Westgate | 17.6% | 3.5%(+14.1)#21 | 4.3%(+13.4)#807 |
| 22. | Schaller | 16.7% | 3.5%(+13.2)#22 | 4.3%(+12.4)#873 |
| 23. | Diamondhead Lake | 16.1% | 3.5%(+12.6)#23 | 4.3%(+11.9)#945 |
| 24. | Grand Junction | 15.9% | 3.5%(+12.4)#24 | 4.3%(+11.7)#960 |
| 25. | Hartwick | 15.0% | 3.5%(+11.5)#25 | 4.3%(+10.7)#1,067 |
| 26. | Pilot Mound | 14.3% | 3.5%(+10.8)#26 | 4.3%(+10.0)#1,162 |
| 27. | Buffalo | 14.1% | 3.5%(+10.6)#27 | 4.3%(+9.85)#1,185 |
| 28. | Royal | 14.0% | 3.5%(+10.5)#28 | 4.3%(+9.78)#1,195 |
| 29. | North English | 14.0% | 3.5%(+10.5)#29 | 4.3%(+9.75)#1,197 |
| 30. | Hartford | 14.0% | 3.5%(+10.5)#30 | 4.3%(+9.75)#1,198 |
| 31. | Graettinger | 13.9% | 3.5%(+10.4)#31 | 4.3%(+9.67)#1,210 |
| 32. | Carroll | 13.4% | 3.5%(+9.92)#32 | 4.3%(+9.17)#1,277 |
| 33. | Fairbank | 13.4% | 3.5%(+9.90)#33 | 4.3%(+9.16)#1,279 |
| 34. | Edgewood | 13.2% | 3.5%(+9.68)#34 | 4.3%(+8.93)#1,324 |
| 35. | Buffalo Center | 13.2% | 3.5%(+9.68)#35 | 4.3%(+8.93)#1,326 |
| 36. | Montour | 12.9% | 3.5%(+9.40)#36 | 4.3%(+8.65)#1,360 |
| 37. | Maharishi Vedic City | 12.9% | 3.5%(+9.37)#37 | 4.3%(+8.62)#1,363 |
| 38. | Rembrandt | 12.5% | 3.5%(+9.00)#38 | 4.3%(+8.25)#1,426 |
| 39. | Wayland | 12.2% | 3.5%(+8.67)#39 | 4.3%(+7.92)#1,491 |
| 40. | Lone Tree | 12.1% | 3.5%(+8.60)#40 | 4.3%(+7.85)#1,506 |
| 41. | St Lucas | 12.0% | 3.5%(+8.50)#41 | 4.3%(+7.75)#1,523 |
| 42. | Sheffield | 11.8% | 3.5%(+8.26)#42 | 4.3%(+7.51)#1,572 |
| 43. | St Olaf | 11.8% | 3.5%(+8.26)#43 | 4.3%(+7.51)#1,582 |
| 44. | Tingley | 11.5% | 3.5%(+8.03)#44 | 4.3%(+7.29)#1,624 |
| 45. | Fairfield | 11.5% | 3.5%(+7.98)#45 | 4.3%(+7.23)#1,627 |
| 46. | Quasqueton | 11.1% | 3.5%(+7.61)#46 | 4.3%(+6.86)#1,693 |
| 47. | Floyd | 11.1% | 3.5%(+7.61)#47 | 4.3%(+6.86)#1,710 |
| 48. | Larrabee | 11.1% | 3.5%(+7.61)#48 | 4.3%(+6.86)#1,724 |
| 49. | Mount Vernon | 11.1% | 3.5%(+7.57)#49 | 4.3%(+6.82)#1,732 |
| 50. | Shelby | 10.9% | 3.5%(+7.41)#50 | 4.3%(+6.66)#1,772 |
| 51. | Sioux Rapids | 10.9% | 3.5%(+7.39)#51 | 4.3%(+6.64)#1,774 |
| 52. | Stacyville | 10.8% | 3.5%(+7.31)#52 | 4.3%(+6.56)#1,798 |
| 53. | Ledyard | 10.7% | 3.5%(+7.21)#53 | 4.3%(+6.46)#1,834 |
| 54. | Fort Atkinson | 10.5% | 3.5%(+7.02)#54 | 4.3%(+6.27)#1,895 |
| 55. | Paullina | 10.5% | 3.5%(+6.99)#55 | 4.3%(+6.24)#1,905 |
| 56. | Washburn | 10.5% | 3.5%(+6.97)#56 | 4.3%(+6.22)#1,907 |
| 57. | Riverside | 10.3% | 3.5%(+6.78)#57 | 4.3%(+6.04)#1,963 |
| 58. | Persia | 10.3% | 3.5%(+6.75)#58 | 4.3%(+6.00)#1,978 |
| 59. | Farmington | 10.0% | 3.5%(+6.50)#59 | 4.3%(+5.75)#2,062 |
| 60. | Charter Oak | 10.0% | 3.5%(+6.50)#60 | 4.3%(+5.75)#2,065 |
| 61. | Linden | 10.0% | 3.5%(+6.50)#61 | 4.3%(+5.75)#2,077 |
| 62. | Milo | 9.8% | 3.5%(+6.28)#62 | 4.3%(+5.53)#2,142 |
| 63. | Holland | 9.8% | 3.5%(+6.25)#63 | 4.3%(+5.50)#2,153 |
| 64. | Winfield | 9.7% | 3.5%(+6.22)#64 | 4.3%(+5.47)#2,165 |
| 65. | Sherrill | 9.3% | 3.5%(+5.80)#65 | 4.3%(+5.05)#2,325 |
| 66. | Newell | 9.3% | 3.5%(+5.76)#66 | 4.3%(+5.01)#2,340 |
| 67. | Rudd | 9.1% | 3.5%(+5.59)#67 | 4.3%(+4.84)#2,401 |
| 68. | Corwith | 9.1% | 3.5%(+5.59)#68 | 4.3%(+4.84)#2,414 |
| 69. | Rippey | 9.1% | 3.5%(+5.59)#69 | 4.3%(+4.84)#2,419 |
| 70. | Hospers | 8.7% | 3.5%(+5.25)#70 | 4.3%(+4.50)#2,574 |
| 71. | Reasnor | 8.7% | 3.5%(+5.19)#71 | 4.3%(+4.44)#2,609 |
| 72. | Matlock | 8.7% | 3.5%(+5.19)#72 | 4.3%(+4.44)#2,611 |
| 73. | Titonka | 8.3% | 3.5%(+4.83)#73 | 4.3%(+4.08)#2,780 |
| 74. | Minburn | 8.3% | 3.5%(+4.83)#74 | 4.3%(+4.08)#2,785 |
| 75. | Harris | 8.3% | 3.5%(+4.83)#75 | 4.3%(+4.08)#2,796 |
| 76. | Arnolds Park | 8.3% | 3.5%(+4.78)#76 | 4.3%(+4.04)#2,819 |
| 77. | Guthrie Center | 8.1% | 3.5%(+4.64)#77 | 4.3%(+3.90)#2,893 |
| 78. | Colo | 8.1% | 3.5%(+4.63)#78 | 4.3%(+3.88)#2,902 |
| 79. | Maurice | 7.9% | 3.5%(+4.39)#79 | 4.3%(+3.64)#3,033 |
| 80. | Saylorville | 7.9% | 3.5%(+4.35)#80 | 4.3%(+3.60)#3,060 |
| 81. | Central City | 7.8% | 3.5%(+4.31)#81 | 4.3%(+3.56)#3,079 |
| 82. | Walcott | 7.7% | 3.5%(+4.22)#82 | 4.3%(+3.48)#3,131 |
| 83. | Lamoni | 7.7% | 3.5%(+4.19)#83 | 4.3%(+3.44)#3,142 |
| 84. | Luana | 7.7% | 3.5%(+4.19)#84 | 4.3%(+3.44)#3,164 |
| 85. | Evansdale | 7.7% | 3.5%(+4.17)#85 | 4.3%(+3.42)#3,186 |
| 86. | Wilton | 7.6% | 3.5%(+4.10)#86 | 4.3%(+3.35)#3,231 |
| 87. | Pulaski | 7.5% | 3.5%(+4.00)#87 | 4.3%(+3.25)#3,292 |
| 88. | Elk Horn | 7.5% | 3.5%(+3.97)#88 | 4.3%(+3.22)#3,303 |
| 89. | Packwood | 7.4% | 3.5%(+3.90)#89 | 4.3%(+3.16)#3,358 |
| 90. | Oakland Acres | 7.3% | 3.5%(+3.77)#90 | 4.3%(+3.02)#3,474 |
| 91. | Marcus | 7.2% | 3.5%(+3.67)#91 | 4.3%(+2.92)#3,542 |
| 92. | Holy Cross | 7.1% | 3.5%(+3.64)#92 | 4.3%(+2.89)#3,594 |
| 93. | West Liberty | 7.0% | 3.5%(+3.54)#93 | 4.3%(+2.79)#3,670 |
| 94. | Maquoketa | 7.0% | 3.5%(+3.52)#94 | 4.3%(+2.77)#3,688 |
| 95. | Wesley | 6.9% | 3.5%(+3.39)#95 | 4.3%(+2.64)#3,788 |
| 96. | Long Grove | 6.8% | 3.5%(+3.35)#96 | 4.3%(+2.60)#3,839 |
| 97. | Gladbrook | 6.8% | 3.5%(+3.30)#97 | 4.3%(+2.55)#3,892 |
| 98. | Odebolt | 6.8% | 3.5%(+3.28)#98 | 4.3%(+2.53)#3,919 |
| 99. | Westside | 6.8% | 3.5%(+3.28)#99 | 4.3%(+2.53)#3,923 |
| 100. | Riceville | 6.8% | 3.5%(+3.25)#100 | 4.3%(+2.50)#3,946 |
Common Questions
What are the Top 10 Cities with the Highest Percentage of Population with a Degree in Visual and Performing Arts in Iowa?
Top 10 Cities with the Highest Percentage of Population with a Degree in Visual and Performing Arts in Iowa are:
What city has the Highest Percentage of Population with a Degree in Visual and Performing Arts in Iowa?
Westfield has the Highest Percentage of Population with a Degree in Visual and Performing Arts in Iowa with 100.0%.
What is the Percentage of Population with a Degree in Visual and Performing Arts in the State of Iowa?
Percentage of Population with a Degree in Visual and Performing Arts in Iowa is 3.5%.
What is the Percentage of Population with a Degree in Visual and Performing Arts in the United States?
Percentage of Population with a Degree in Visual and Performing Arts in the United States is 4.3%.