Bear Creek, CA Map & Demographics
Bear Creek Map
Bear Creek Overview
$25,001
PER CAPITA INCOME
0.31
INEQUALITY / GINI INDEX
251
TOTAL POPULATION
102
MALE POPULATION
149
FEMALE POPULATION
68.46
MALES / 100 FEMALES
146.08
FEMALES / 100 MALES
32.3
MEDIAN AGE
5.6
AVG FAMILY SIZE
5.6
AVG HOUSEHOLD SIZE
72
LABOR FORCE [ PEOPLE ]
37.7%
PERCENT IN LABOR FORCE
Income in Bear Creek
Income Overview in Bear Creek
| Characteristic | Number | Measure |
| Per Capita Income | 251 | $25,001 |
| Median Family Income | 45 | $0 |
| Mean Family Income | 45 | $122,691 |
| Median Household Income | 45 | $0 |
| Mean Household Income | 45 | $122,691 |
| Income Deficit | 45 | $0 |
| Wage / Income Gap (%) | 251 | 0.00% |
| Wage / Income Gap ($) | 251 | 100.00¢ per $1 |
| Gini / Inequality Index | 251 | 0.31 |
Earnings by Sex in Bear Creek

| Sex | Number | Average Earnings |
| Male | 52 (62.6%) | $56,964 |
| Female | 31 (37.3%) | $0 |
| Total | 83 (100.0%) | $56,161 |
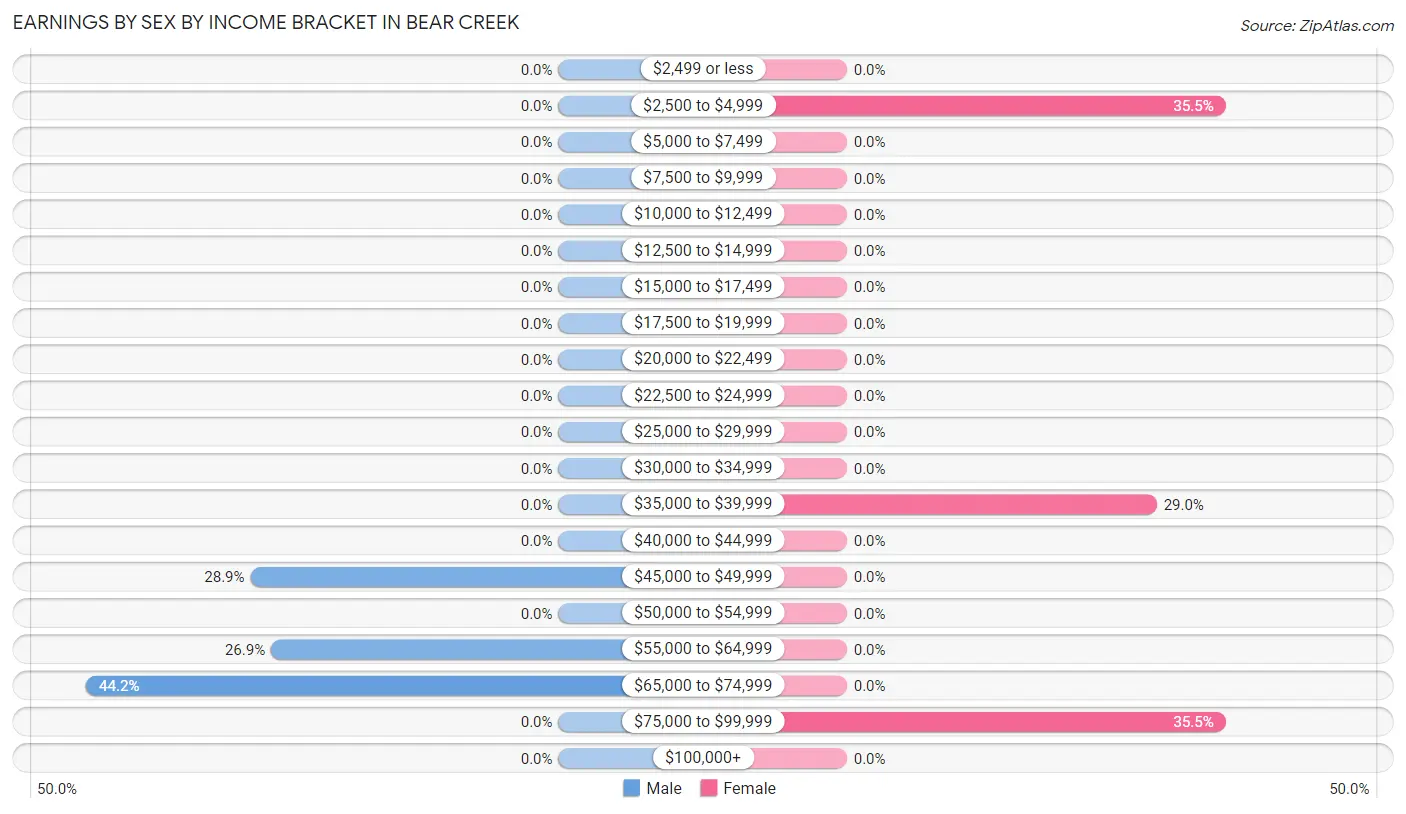
Earnings by Sex by Income Bracket in Bear Creek
The most common earnings brackets in Bear Creek are $65,000 to $74,999 for men (23 | 44.2%) and $2,500 to $4,999 for women (11 | 35.5%).
| Income | Male | Female |
| $2,499 or less | 0 (0.0%) | 0 (0.0%) |
| $2,500 to $4,999 | 0 (0.0%) | 11 (35.5%) |
| $5,000 to $7,499 | 0 (0.0%) | 0 (0.0%) |
| $7,500 to $9,999 | 0 (0.0%) | 0 (0.0%) |
| $10,000 to $12,499 | 0 (0.0%) | 0 (0.0%) |
| $12,500 to $14,999 | 0 (0.0%) | 0 (0.0%) |
| $15,000 to $17,499 | 0 (0.0%) | 0 (0.0%) |
| $17,500 to $19,999 | 0 (0.0%) | 0 (0.0%) |
| $20,000 to $22,499 | 0 (0.0%) | 0 (0.0%) |
| $22,500 to $24,999 | 0 (0.0%) | 0 (0.0%) |
| $25,000 to $29,999 | 0 (0.0%) | 0 (0.0%) |
| $30,000 to $34,999 | 0 (0.0%) | 0 (0.0%) |
| $35,000 to $39,999 | 0 (0.0%) | 9 (29.0%) |
| $40,000 to $44,999 | 0 (0.0%) | 0 (0.0%) |
| $45,000 to $49,999 | 15 (28.8%) | 0 (0.0%) |
| $50,000 to $54,999 | 0 (0.0%) | 0 (0.0%) |
| $55,000 to $64,999 | 14 (26.9%) | 0 (0.0%) |
| $65,000 to $74,999 | 23 (44.2%) | 0 (0.0%) |
| $75,000 to $99,999 | 0 (0.0%) | 11 (35.5%) |
| $100,000+ | 0 (0.0%) | 0 (0.0%) |
| Total | 52 (100.0%) | 31 (100.0%) |
Earnings by Sex by Educational Attainment in Bear Creek
| Educational Attainment | Male Income | Female Income |
| Less than High School | - | - |
| High School Diploma | - | - |
| College or Associate's Degree | - | - |
| Bachelor's Degree | - | - |
| Graduate Degree | - | - |
| Total | $56,964 | $0 |
Family Income in Bear Creek
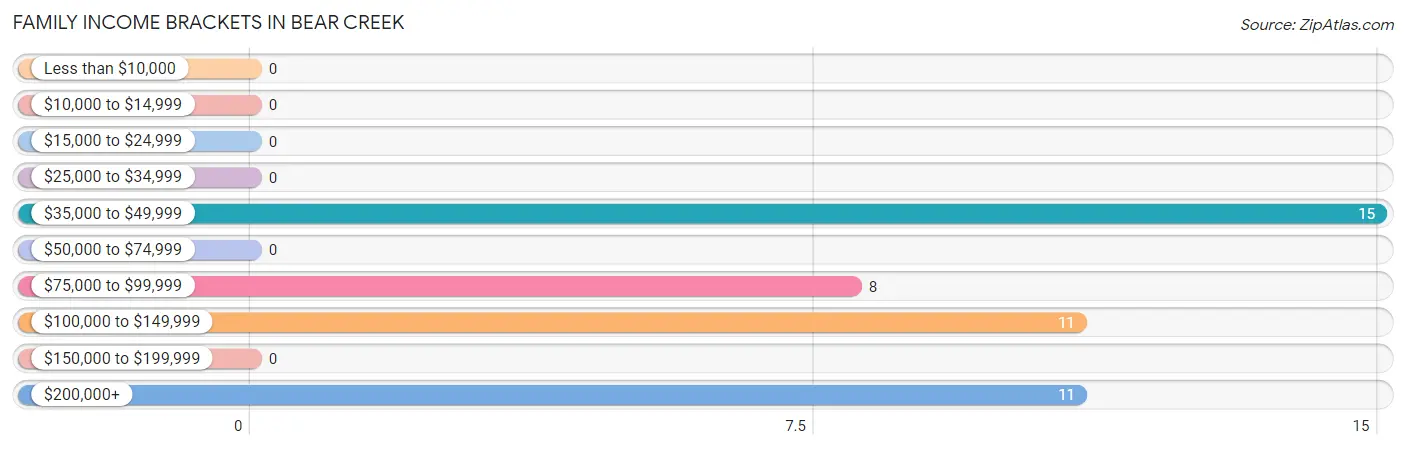
Family Income Brackets in Bear Creek
According to the Bear Creek family income data, there are 15 families falling into the $35,000 to $49,999 income range, which is the most common income bracket and makes up 33.3% of all families.
| Income Bracket | # Families | % Families |
| Less than $10,000 | 0 | 0.0% |
| $10,000 to $14,999 | 0 | 0.0% |
| $15,000 to $24,999 | 0 | 0.0% |
| $25,000 to $34,999 | 0 | 0.0% |
| $35,000 to $49,999 | 15 | 33.3% |
| $50,000 to $74,999 | 0 | 0.0% |
| $75,000 to $99,999 | 8 | 17.8% |
| $100,000 to $149,999 | 11 | 24.4% |
| $150,000 to $199,999 | 0 | 0.0% |
| $200,000+ | 11 | 24.4% |
Family Income by Famaliy Size in Bear Creek
| Income Bracket | # Families | Median Income |
| 2-Person Families | 0 (0.0%) | $0 |
| 3-Person Families | 23 (51.1%) | $0 |
| 4-Person Families | 0 (0.0%) | $0 |
| 5-Person Families | 11 (24.4%) | $0 |
| 6-Person Families | 0 (0.0%) | $0 |
| 7+ Person Families | 11 (24.4%) | $0 |
| Total | 45 (100.0%) | $0 |
Family Income by Number of Earners in Bear Creek
| Number of Earners | # Families | Median Income |
| No Earners | 15 (33.3%) | $0 |
| 1 Earner | 8 (17.8%) | $0 |
| 2 Earners | 0 (0.0%) | $0 |
| 3+ Earners | 22 (48.9%) | $0 |
| Total | 45 (100.0%) | $0 |
Household Income in Bear Creek
Household Income Brackets in Bear Creek
With 15 households falling in the category, the $35,000 to $49,999 income range is the most frequent in Bear Creek, accounting for 33.3% of all households.
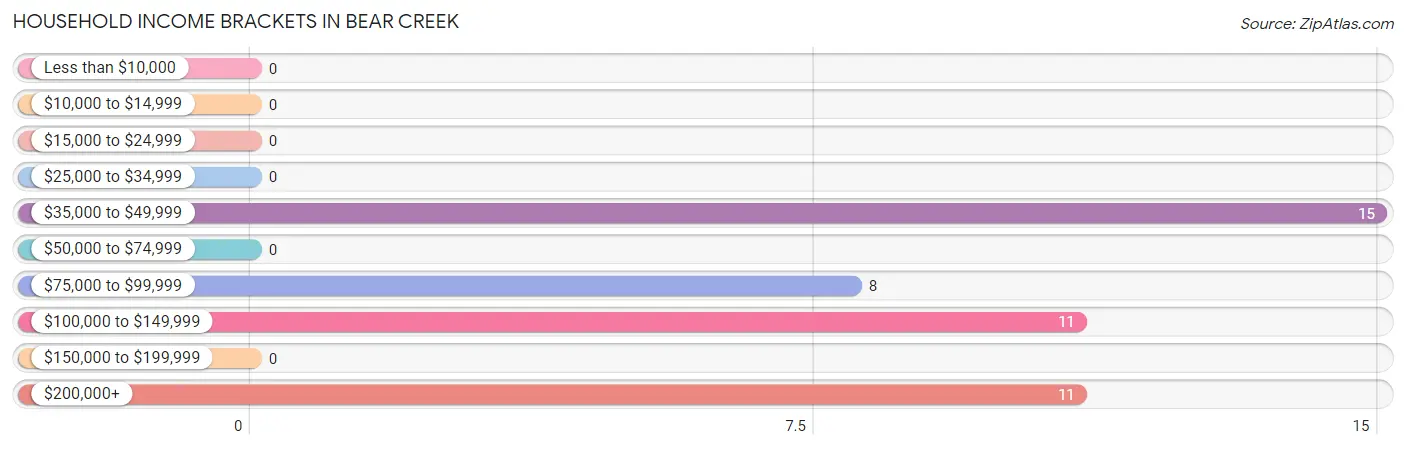
| Income Bracket | # Households | % Households |
| Less than $10,000 | 0 | 0.0% |
| $10,000 to $14,999 | 0 | 0.0% |
| $15,000 to $24,999 | 0 | 0.0% |
| $25,000 to $34,999 | 0 | 0.0% |
| $35,000 to $49,999 | 15 | 33.3% |
| $50,000 to $74,999 | 0 | 0.0% |
| $75,000 to $99,999 | 8 | 17.8% |
| $100,000 to $149,999 | 11 | 24.4% |
| $150,000 to $199,999 | 0 | 0.0% |
| $200,000+ | 11 | 24.4% |
Household Income by Householder Age in Bear Creek
| Income Bracket | # Households | Median Income |
| 15 to 24 Years | 0 (0.0%) | $0 |
| 25 to 44 Years | 11 (24.4%) | $0 |
| 45 to 64 Years | 26 (57.8%) | $0 |
| 65+ Years | 8 (17.8%) | $0 |
| Total | 45 (100.0%) | $0 |
Poverty in Bear Creek
Income Below Poverty by Sex and Age in Bear Creek
| Age Bracket | Male | Female |
| Under 5 Years | 0 (0.0%) | 0 (0.0%) |
| 5 Years | 0 (0.0%) | 0 (0.0%) |
| 6 to 11 Years | 0 (0.0%) | 0 (0.0%) |
| 12 to 14 Years | 0 (0.0%) | 0 (0.0%) |
| 15 Years | 0 (0.0%) | 0 (0.0%) |
| 16 and 17 Years | 0 (0.0%) | 0 (0.0%) |
| 18 to 24 Years | 0 (0.0%) | 0 (0.0%) |
| 25 to 34 Years | 0 (0.0%) | 0 (0.0%) |
| 35 to 44 Years | 0 (0.0%) | 0 (0.0%) |
| 45 to 54 Years | 0 (0.0%) | 0 (0.0%) |
| 55 to 64 Years | 0 (0.0%) | 0 (0.0%) |
| 65 to 74 Years | 0 (0.0%) | 0 (0.0%) |
| 75 Years and over | 0 (0.0%) | 0 (0.0%) |
| Total | 0 (0.0%) | 0 (0.0%) |
Income Above Poverty by Sex and Age in Bear Creek
According to the poverty statistics in Bear Creek, males aged 25 to 34 years and females aged under 5 years are the age groups that are most secure financially, with 100.0% of males and 100.0% of females in these age groups living above the poverty line.
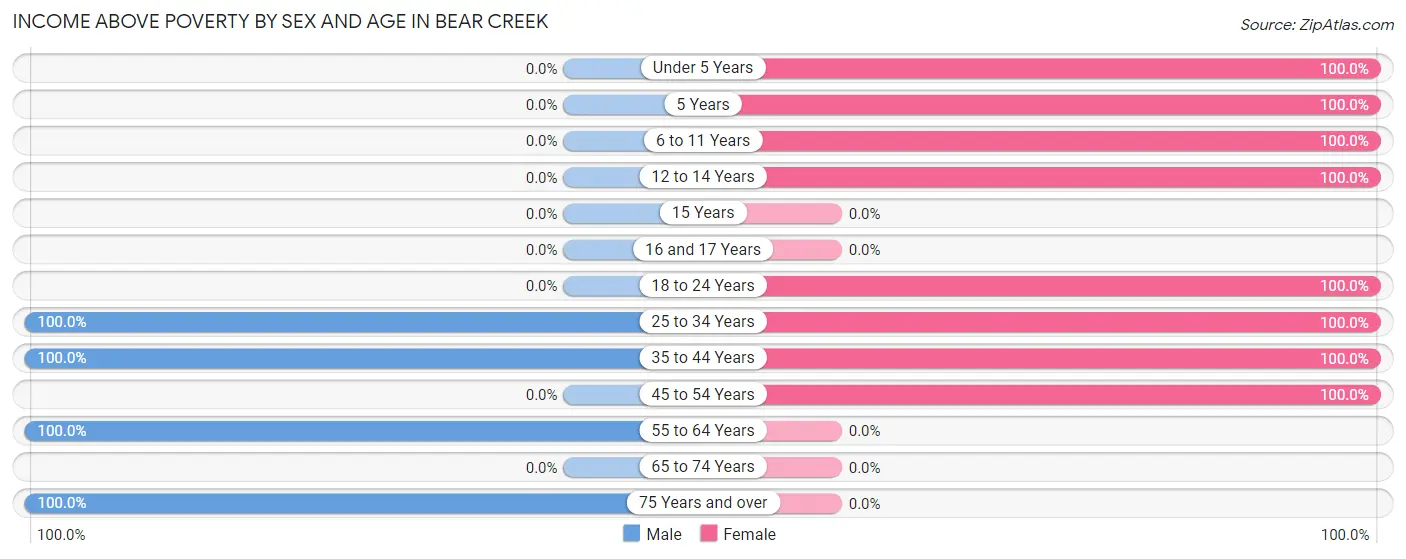
| Age Bracket | Male | Female |
| Under 5 Years | 0 (0.0%) | 25 (100.0%) |
| 5 Years | 0 (0.0%) | 11 (100.0%) |
| 6 to 11 Years | 0 (0.0%) | 12 (100.0%) |
| 12 to 14 Years | 0 (0.0%) | 12 (100.0%) |
| 15 Years | 0 (0.0%) | 0 (0.0%) |
| 16 and 17 Years | 0 (0.0%) | 0 (0.0%) |
| 18 to 24 Years | 0 (0.0%) | 11 (100.0%) |
| 25 to 34 Years | 56 (100.0%) | 56 (100.0%) |
| 35 to 44 Years | 12 (100.0%) | 11 (100.0%) |
| 45 to 54 Years | 0 (0.0%) | 11 (100.0%) |
| 55 to 64 Years | 26 (100.0%) | 0 (0.0%) |
| 65 to 74 Years | 0 (0.0%) | 0 (0.0%) |
| 75 Years and over | 8 (100.0%) | 0 (0.0%) |
| Total | 102 (100.0%) | 149 (100.0%) |
Income Below Poverty Among Married-Couple Families in Bear Creek
| Children | Above Poverty | Below Poverty |
| No Children | 0 (0.0%) | 0 (0.0%) |
| 1 or 2 Children | 11 (100.0%) | 0 (0.0%) |
| 3 or 4 Children | 11 (100.0%) | 0 (0.0%) |
| 5 or more Children | 0 (0.0%) | 0 (0.0%) |
| Total | 22 (100.0%) | 0 (0.0%) |
Income Below Poverty Among Single-Parent Households in Bear Creek
| Children | Single Father | Single Mother |
| No Children | 0 (0.0%) | 0 (0.0%) |
| 1 or 2 Children | 0 (0.0%) | 0 (0.0%) |
| 3 or 4 Children | 0 (0.0%) | 0 (0.0%) |
| 5 or more Children | 0 (0.0%) | 0 (0.0%) |
| Total | 0 (0.0%) | 0 (0.0%) |
Income Below Poverty Among Married-Couple vs Single-Parent Households in Bear Creek
| Children | Married-Couple Families | Single-Parent Households |
| No Children | 0 (0.0%) | 0 (0.0%) |
| 1 or 2 Children | 0 (0.0%) | 0 (0.0%) |
| 3 or 4 Children | 0 (0.0%) | 0 (0.0%) |
| 5 or more Children | 0 (0.0%) | 0 (0.0%) |
| Total | 0 (0.0%) | 0 (0.0%) |
Race in Bear Creek
The most populous races in Bear Creek are White / Caucasian (211 | 84.1%), Hispanic or Latino (174 | 69.3%), and Two or more Races (28 | 11.2%).
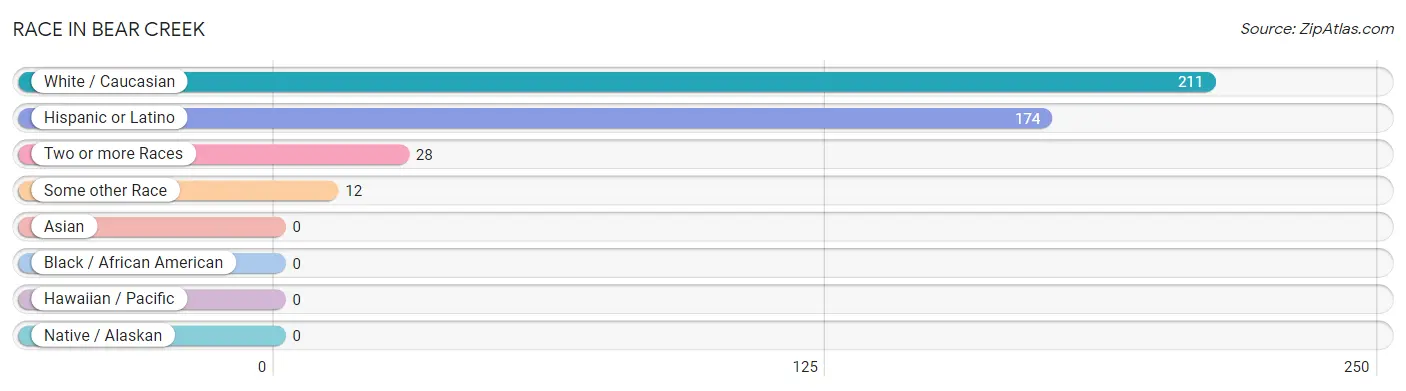
| Race | # Population | % Population |
| Asian | 0 | 0.0% |
| Black / African American | 0 | 0.0% |
| Hawaiian / Pacific | 0 | 0.0% |
| Hispanic or Latino | 174 | 69.3% |
| Native / Alaskan | 0 | 0.0% |
| White / Caucasian | 211 | 84.1% |
| Two or more Races | 28 | 11.2% |
| Some other Race | 12 | 4.8% |
| Total | 251 | 100.0% |
Ancestry in Bear Creek
The most populous ancestries reported in Bear Creek are Mexican (174 | 69.3%), and French (11 | 4.4%), together accounting for 73.7% of all Bear Creek residents.
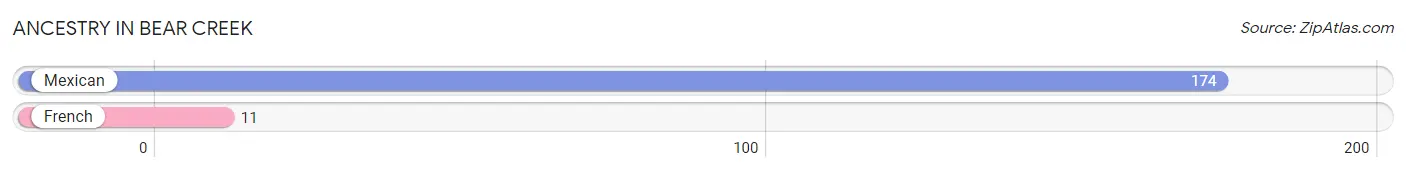
| Ancestry | # Population | % Population |
| French | 11 | 4.4% |
| Mexican | 174 | 69.3% | View All 2 Rows |
Immigrants in Bear Creek
The most numerous immigrant groups reported in Bear Creek came from Central America (47 | 18.7%), Latin America (47 | 18.7%), and Mexico (47 | 18.7%), together accounting for 56.2% of all Bear Creek residents.
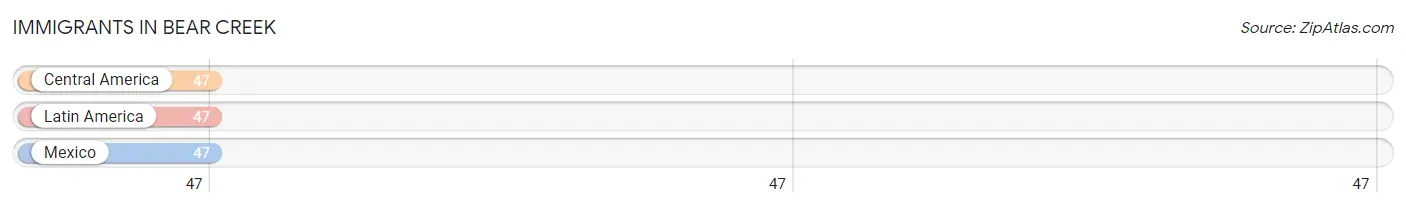
| Immigration Origin | # Population | % Population |
| Central America | 47 | 18.7% |
| Latin America | 47 | 18.7% |
| Mexico | 47 | 18.7% | View All 3 Rows |
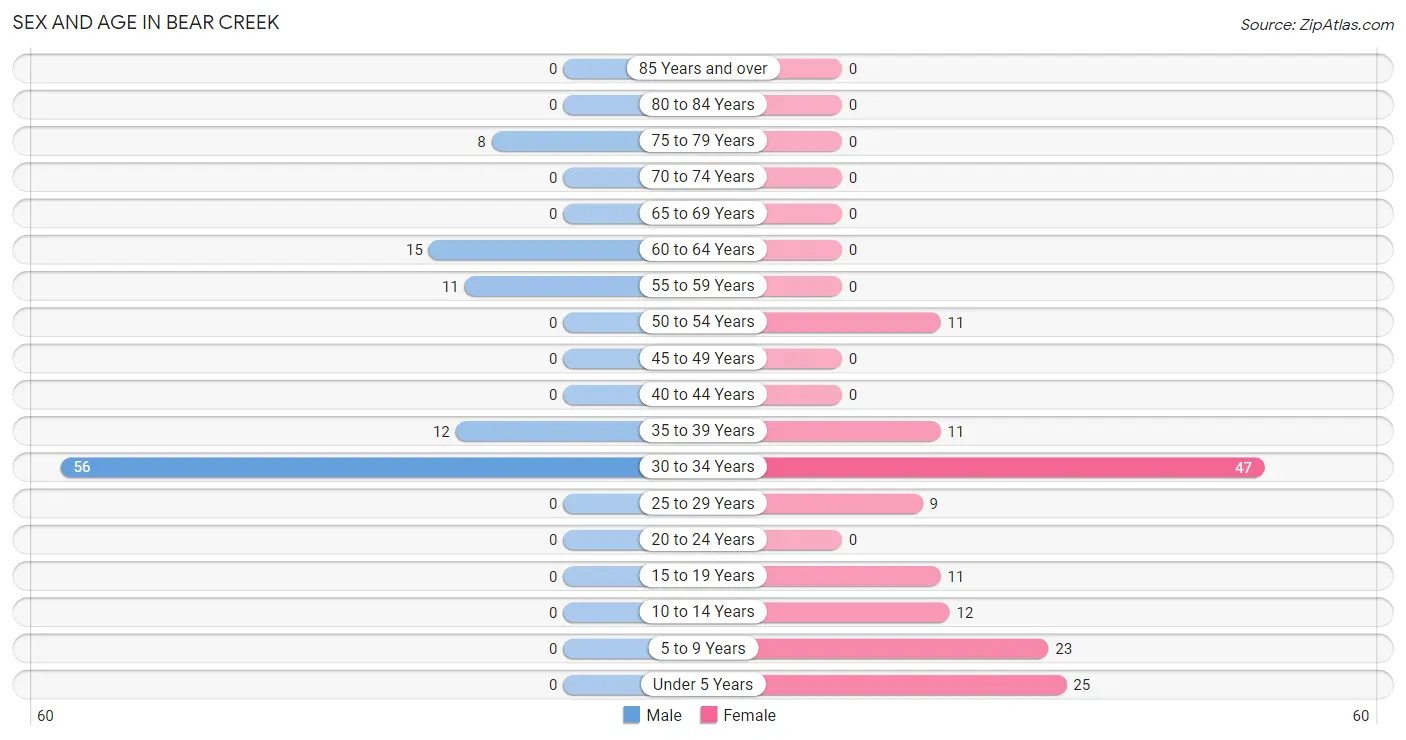
Sex and Age in Bear Creek
Sex and Age in Bear Creek
The most populous age groups in Bear Creek are 30 to 34 Years (56 | 54.9%) for men and 30 to 34 Years (47 | 31.5%) for women.
| Age Bracket | Male | Female |
| Under 5 Years | 0 (0.0%) | 25 (16.8%) |
| 5 to 9 Years | 0 (0.0%) | 23 (15.4%) |
| 10 to 14 Years | 0 (0.0%) | 12 (8.1%) |
| 15 to 19 Years | 0 (0.0%) | 11 (7.4%) |
| 20 to 24 Years | 0 (0.0%) | 0 (0.0%) |
| 25 to 29 Years | 0 (0.0%) | 9 (6.0%) |
| 30 to 34 Years | 56 (54.9%) | 47 (31.5%) |
| 35 to 39 Years | 12 (11.8%) | 11 (7.4%) |
| 40 to 44 Years | 0 (0.0%) | 0 (0.0%) |
| 45 to 49 Years | 0 (0.0%) | 0 (0.0%) |
| 50 to 54 Years | 0 (0.0%) | 11 (7.4%) |
| 55 to 59 Years | 11 (10.8%) | 0 (0.0%) |
| 60 to 64 Years | 15 (14.7%) | 0 (0.0%) |
| 65 to 69 Years | 0 (0.0%) | 0 (0.0%) |
| 70 to 74 Years | 0 (0.0%) | 0 (0.0%) |
| 75 to 79 Years | 8 (7.8%) | 0 (0.0%) |
| 80 to 84 Years | 0 (0.0%) | 0 (0.0%) |
| 85 Years and over | 0 (0.0%) | 0 (0.0%) |
| Total | 102 (100.0%) | 149 (100.0%) |
Families and Households in Bear Creek
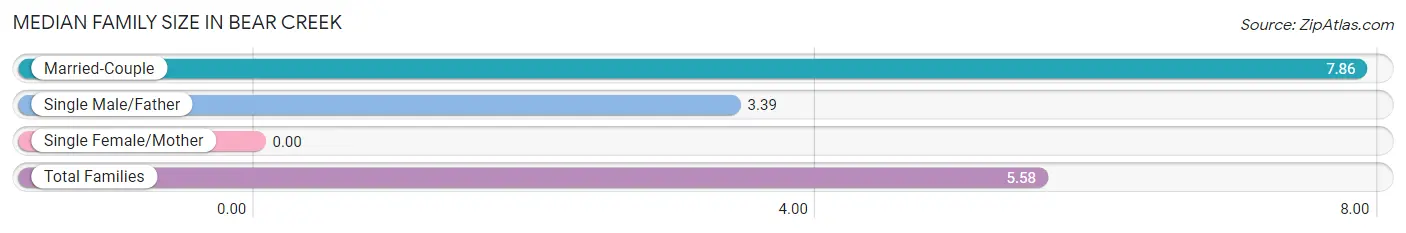
Median Family Size in Bear Creek
| Family Type | # Families | Family Size |
| Married-Couple | 22 (48.9%) | 7.86 |
| Single Male/Father | 23 (51.1%) | 3.39 |
| Single Female/Mother | 0 (0.0%) | - |
| Total Families | 45 (100.0%) | 5.58 |
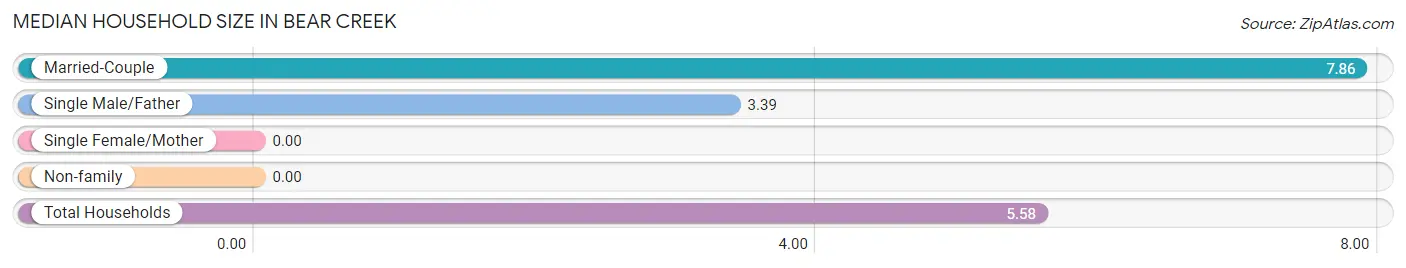
Median Household Size in Bear Creek
| Household Type | # Households | Household Size |
| Married-Couple | 22 (48.9%) | 7.86 |
| Single Male/Father | 23 (51.1%) | 3.39 |
| Single Female/Mother | 0 (0.0%) | - |
| Non-family | 0 (0.0%) | - |
| Total Households | 45 (100.0%) | 5.58 |
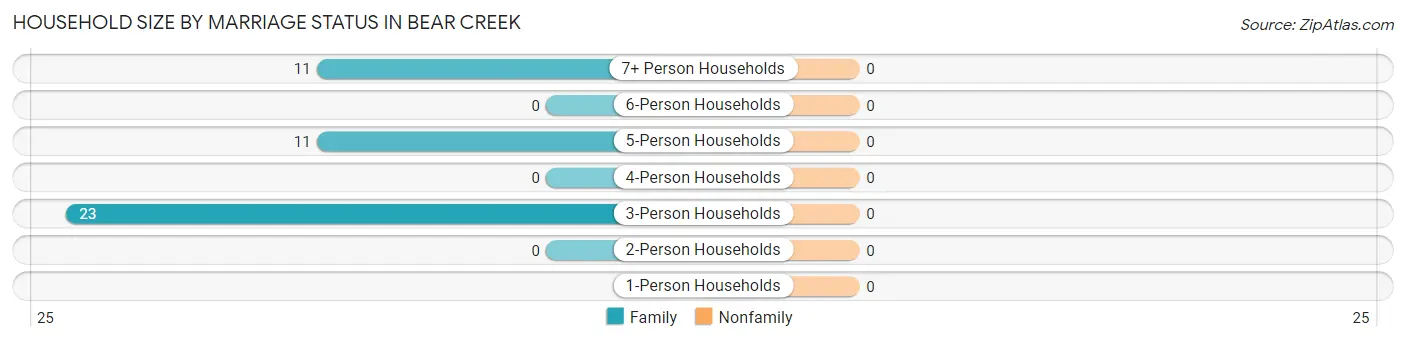
Household Size by Marriage Status in Bear Creek
| Household Size | Family Households | Nonfamily Households |
| 1-Person Households | - | 0 (0.0%) |
| 2-Person Households | 0 (0.0%) | 0 (0.0%) |
| 3-Person Households | 23 (51.1%) | 0 (0.0%) |
| 4-Person Households | 0 (0.0%) | 0 (0.0%) |
| 5-Person Households | 11 (24.4%) | 0 (0.0%) |
| 6-Person Households | 0 (0.0%) | 0 (0.0%) |
| 7+ Person Households | 11 (24.4%) | 0 (0.0%) |
| Total | 45 (100.0%) | 0 (0.0%) |
Female Fertility in Bear Creek
Fertility by Age in Bear Creek
Average fertility rate in Bear Creek is 141.0 births per 1,000 women. Women in the age bracket of 35 to 50 years have the highest fertility rate with 1,000.0 births per 1,000 women. Women in the age bracket of 35 to 50 years acount for 100.0% of all women with births.
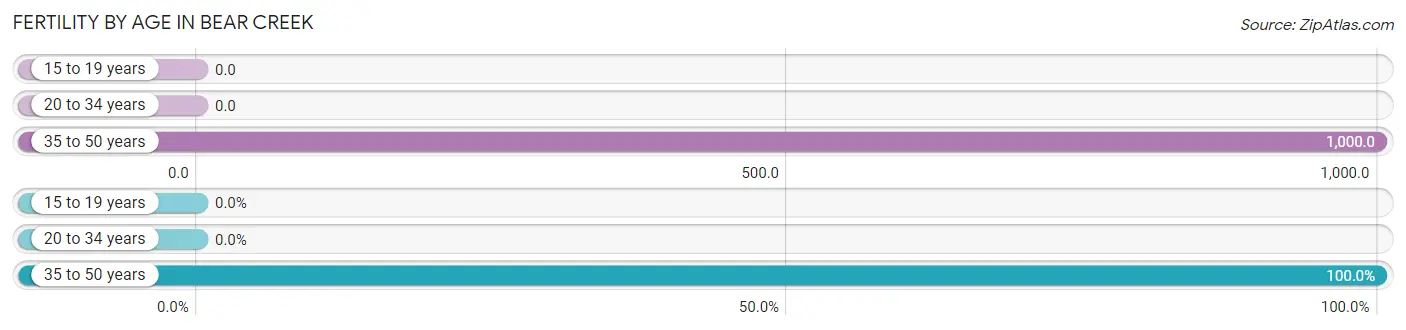
| Age Bracket | Women with Births | Births / 1,000 Women |
| 15 to 19 years | 0 (0.0%) | 0.0 |
| 20 to 34 years | 0 (0.0%) | 0.0 |
| 35 to 50 years | 11 (100.0%) | 1,000.0 |
| Total | 11 (100.0%) | 141.0 |
Fertility by Age by Marriage Status in Bear Creek
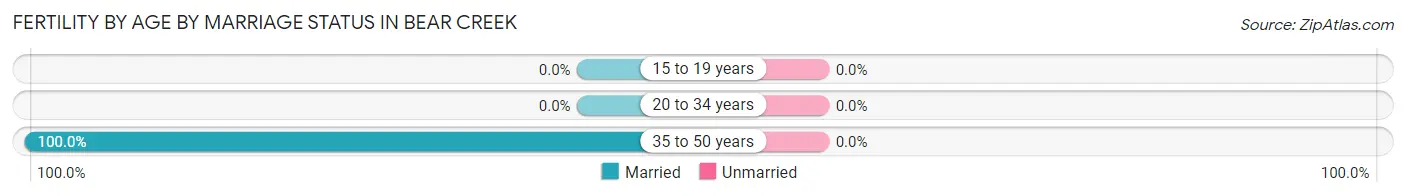
| Age Bracket | Married | Unmarried |
| 15 to 19 years | 0 (0.0%) | 0 (0.0%) |
| 20 to 34 years | 0 (0.0%) | 0 (0.0%) |
| 35 to 50 years | 11 (100.0%) | 0 (0.0%) |
| Total | 11 (100.0%) | 0 (0.0%) |
Fertility by Education in Bear Creek
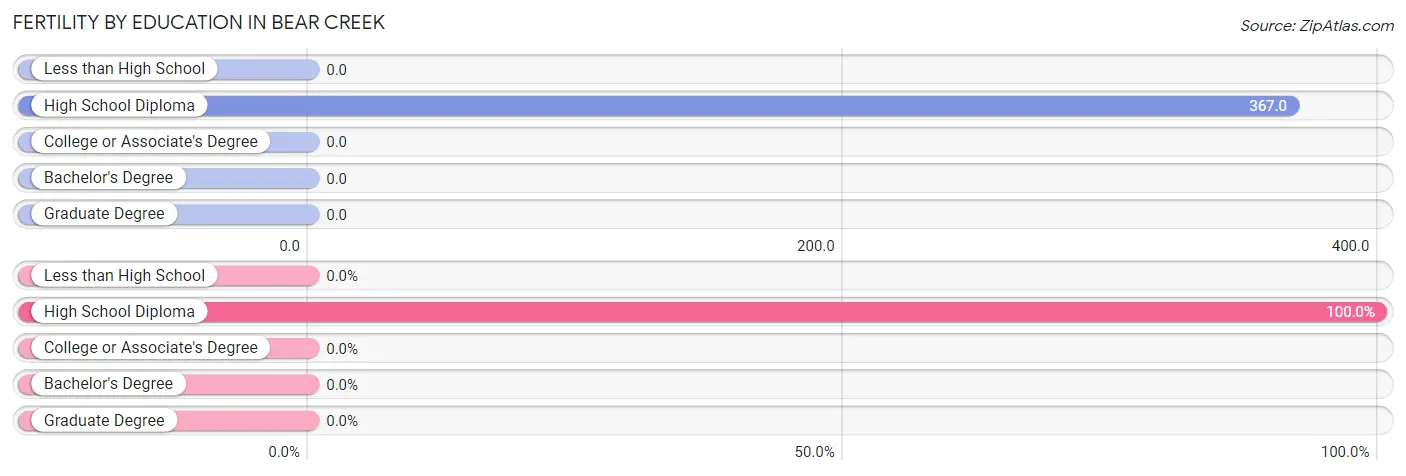
| Educational Attainment | Women with Births | Births / 1,000 Women |
| Less than High School | 0 (0.0%) | 0.0 |
| High School Diploma | 11 (100.0%) | 367.0 |
| College or Associate's Degree | 0 (0.0%) | 0.0 |
| Bachelor's Degree | 0 (0.0%) | 0.0 |
| Graduate Degree | 0 (0.0%) | 0.0 |
| Total | 11 (100.0%) | 141.0 |
Fertility by Education by Marriage Status in Bear Creek
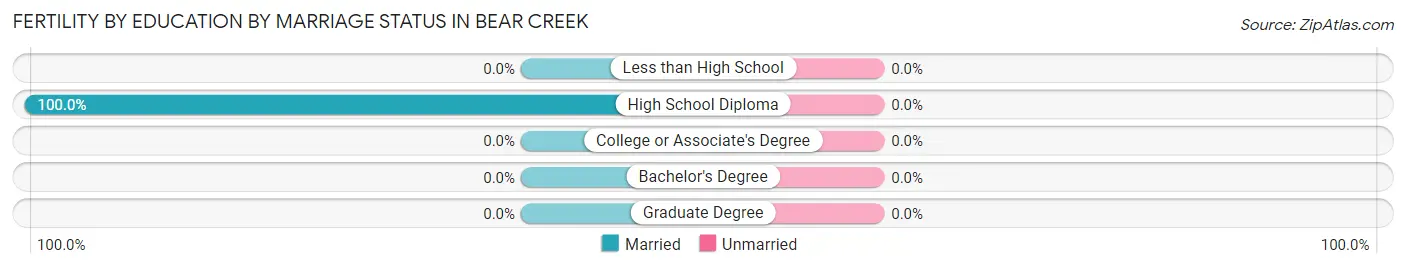
| Educational Attainment | Married | Unmarried |
| Less than High School | 0 (0.0%) | 0 (0.0%) |
| High School Diploma | 11 (100.0%) | 0 (0.0%) |
| College or Associate's Degree | 0 (0.0%) | 0 (0.0%) |
| Bachelor's Degree | 0 (0.0%) | 0 (0.0%) |
| Graduate Degree | 0 (0.0%) | 0 (0.0%) |
| Total | 11 (100.0%) | 0 (0.0%) |
Employment Characteristics in Bear Creek
Employment by Class of Employer in Bear Creek
Among the 72 employed individuals in Bear Creek, state government employees (34 | 47.2%), local government employees (15 | 20.8%), and private company employees (12 | 16.7%) make up the most common classes of employment.
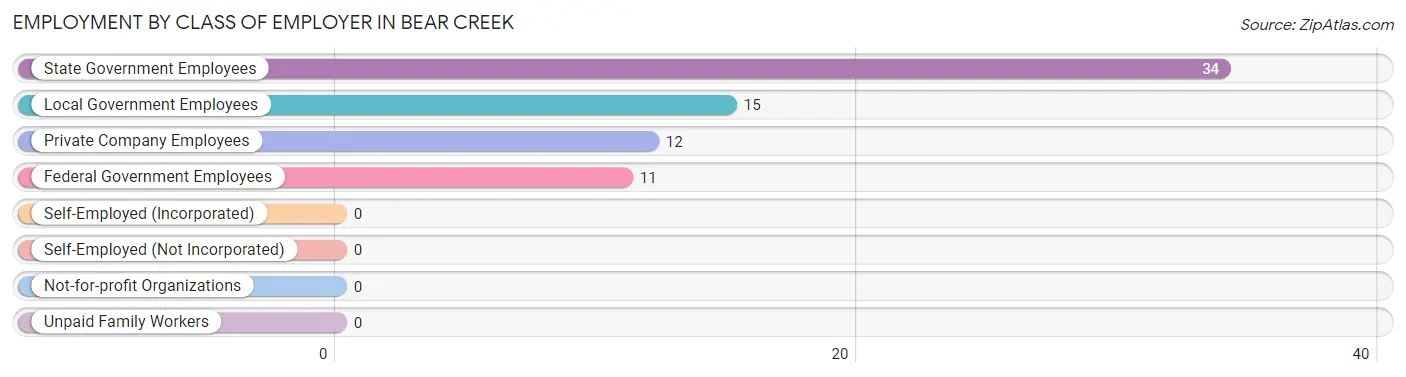
| Employer Class | # Employees | % Employees |
| Private Company Employees | 12 | 16.7% |
| Self-Employed (Incorporated) | 0 | 0.0% |
| Self-Employed (Not Incorporated) | 0 | 0.0% |
| Not-for-profit Organizations | 0 | 0.0% |
| Local Government Employees | 15 | 20.8% |
| State Government Employees | 34 | 47.2% |
| Federal Government Employees | 11 | 15.3% |
| Unpaid Family Workers | 0 | 0.0% |
| Total | 72 | 100.0% |
Employment Status by Age in Bear Creek
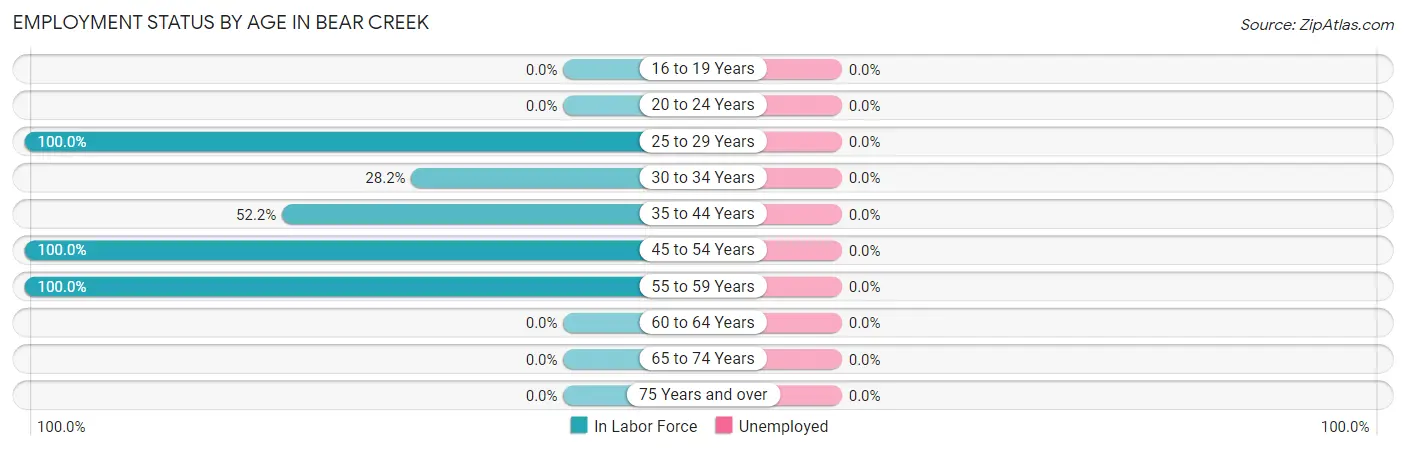
| Age Bracket | In Labor Force | Unemployed |
| 16 to 19 Years | 0 (0.0%) | 0 (0.0%) |
| 20 to 24 Years | 0 (0.0%) | 0 (0.0%) |
| 25 to 29 Years | 9 (100.0%) | 0 (0.0%) |
| 30 to 34 Years | 29 (28.2%) | 0 (0.0%) |
| 35 to 44 Years | 12 (52.2%) | 0 (0.0%) |
| 45 to 54 Years | 11 (100.0%) | 0 (0.0%) |
| 55 to 59 Years | 11 (100.0%) | 0 (0.0%) |
| 60 to 64 Years | 0 (0.0%) | 0 (0.0%) |
| 65 to 74 Years | 0 (0.0%) | 0 (0.0%) |
| 75 Years and over | 0 (0.0%) | 0 (0.0%) |
| Total | 72 (37.7%) | 0 (0.0%) |
Employment Status by Educational Attainment in Bear Creek
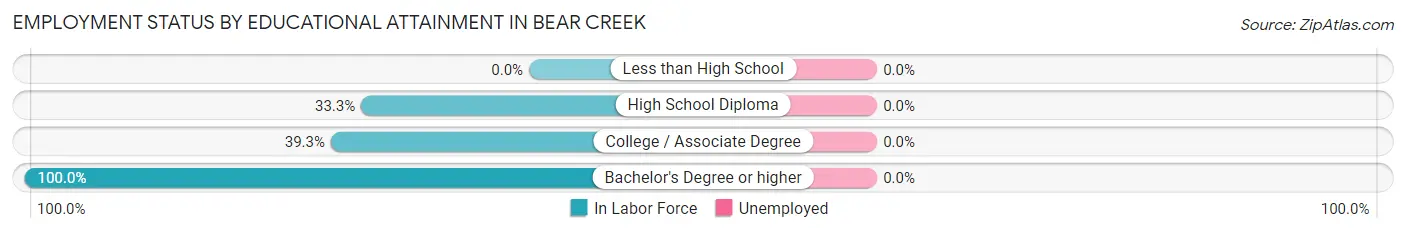
| Educational Attainment | In Labor Force | Unemployed |
| Less than High School | 0 (0.0%) | 0 (0.0%) |
| High School Diploma | 23 (33.3%) | 0 (0.0%) |
| College / Associate Degree | 35 (39.3%) | 0 (0.0%) |
| Bachelor's Degree or higher | 14 (100.0%) | 0 (0.0%) |
| Total | 72 (41.9%) | 0 (0.0%) |
Employment Occupations by Sex in Bear Creek
Management, Business, Science and Arts Occupations
The most common Management, Business, Science and Arts occupations in Bear Creek are Community & Social Service (29 | 40.3%), Education, Arts & Media (15 | 20.8%), and Education Instruction & Library (14 | 19.4%).
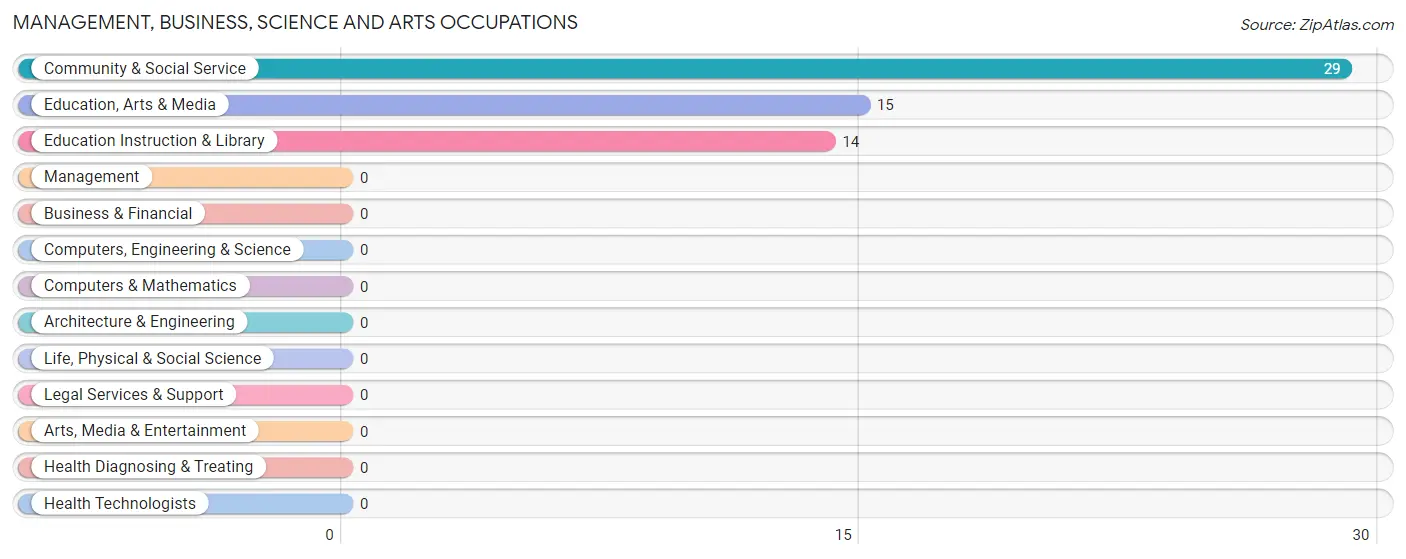
Management, Business, Science and Arts Occupations by Sex
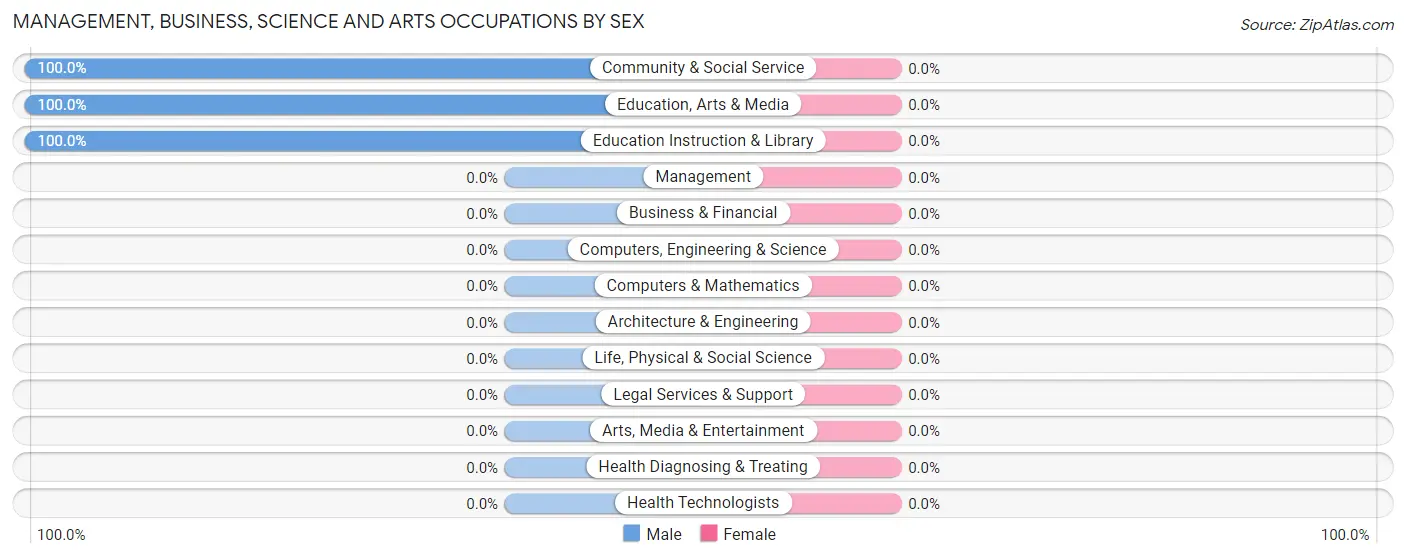
| Occupation | Male | Female |
| Management | 0 (0.0%) | 0 (0.0%) |
| Business & Financial | 0 (0.0%) | 0 (0.0%) |
| Computers, Engineering & Science | 0 (0.0%) | 0 (0.0%) |
| Computers & Mathematics | 0 (0.0%) | 0 (0.0%) |
| Architecture & Engineering | 0 (0.0%) | 0 (0.0%) |
| Life, Physical & Social Science | 0 (0.0%) | 0 (0.0%) |
| Community & Social Service | 29 (100.0%) | 0 (0.0%) |
| Education, Arts & Media | 15 (100.0%) | 0 (0.0%) |
| Legal Services & Support | 0 (0.0%) | 0 (0.0%) |
| Education Instruction & Library | 14 (100.0%) | 0 (0.0%) |
| Arts, Media & Entertainment | 0 (0.0%) | 0 (0.0%) |
| Health Diagnosing & Treating | 0 (0.0%) | 0 (0.0%) |
| Health Technologists | 0 (0.0%) | 0 (0.0%) |
| Total (Category) | 29 (100.0%) | 0 (0.0%) |
| Total (Overall) | 52 (72.2%) | 20 (27.8%) |
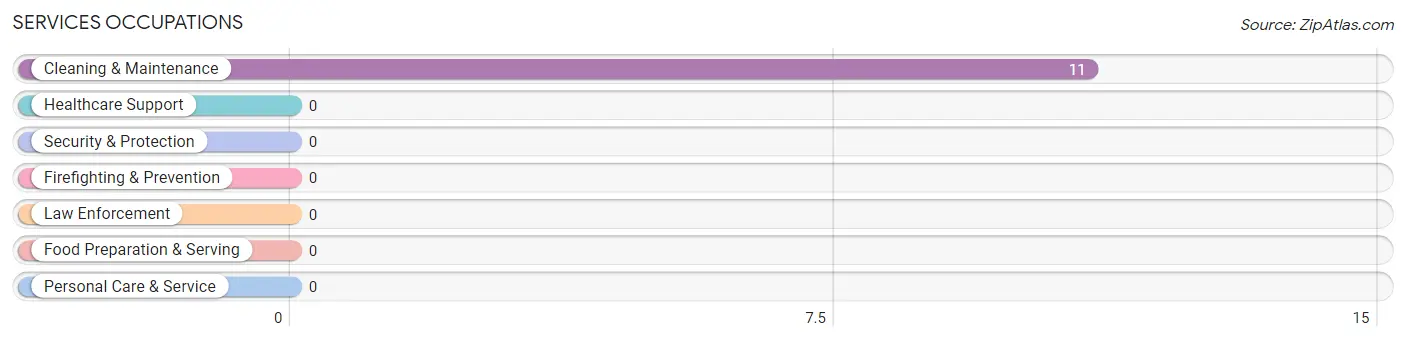
Services Occupations
The most common Services occupations in Bear Creek are , and Cleaning & Maintenance (11 | 15.3%).
Services Occupations by Sex
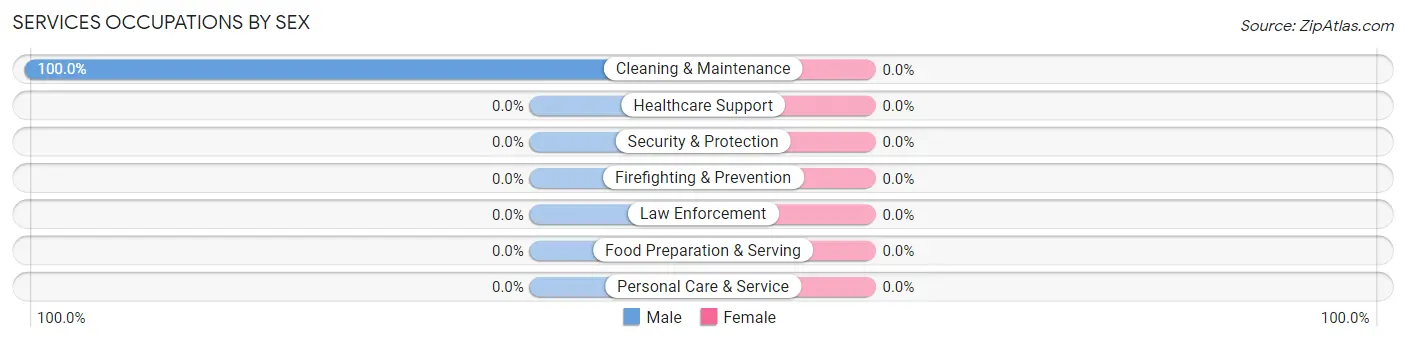
| Occupation | Male | Female |
| Healthcare Support | 0 (0.0%) | 0 (0.0%) |
| Security & Protection | 0 (0.0%) | 0 (0.0%) |
| Firefighting & Prevention | 0 (0.0%) | 0 (0.0%) |
| Law Enforcement | 0 (0.0%) | 0 (0.0%) |
| Food Preparation & Serving | 0 (0.0%) | 0 (0.0%) |
| Cleaning & Maintenance | 11 (100.0%) | 0 (0.0%) |
| Personal Care & Service | 0 (0.0%) | 0 (0.0%) |
| Total (Category) | 11 (100.0%) | 0 (0.0%) |
| Total (Overall) | 52 (72.2%) | 20 (27.8%) |
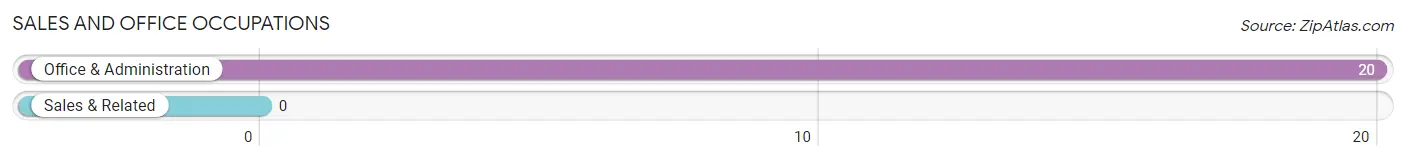
Sales and Office Occupations
The most common Sales and Office occupations in Bear Creek are , and Office & Administration (20 | 27.8%).
Sales and Office Occupations by Sex

| Occupation | Male | Female |
| Sales & Related | 0 (0.0%) | 0 (0.0%) |
| Office & Administration | 0 (0.0%) | 20 (100.0%) |
| Total (Category) | 0 (0.0%) | 20 (100.0%) |
| Total (Overall) | 52 (72.2%) | 20 (27.8%) |
Natural Resources, Construction and Maintenance Occupations
The most common Natural Resources, Construction and Maintenance occupations in Bear Creek are , and Construction & Extraction (12 | 16.7%).
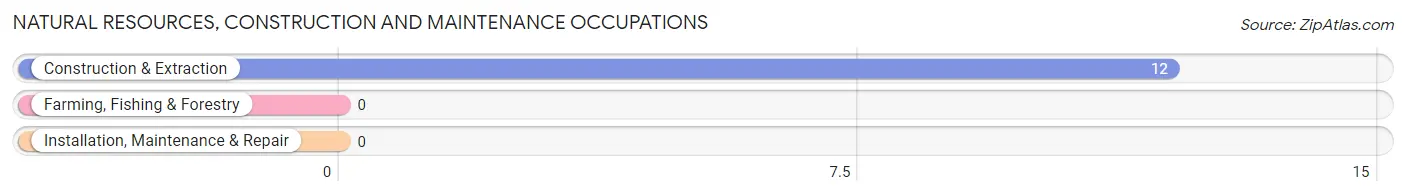
Natural Resources, Construction and Maintenance Occupations by Sex
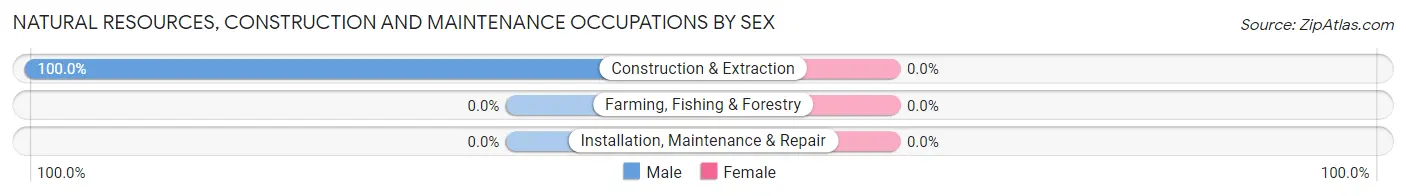
| Occupation | Male | Female |
| Farming, Fishing & Forestry | 0 (0.0%) | 0 (0.0%) |
| Construction & Extraction | 12 (100.0%) | 0 (0.0%) |
| Installation, Maintenance & Repair | 0 (0.0%) | 0 (0.0%) |
| Total (Category) | 12 (100.0%) | 0 (0.0%) |
| Total (Overall) | 52 (72.2%) | 20 (27.8%) |
Production, Transportation and Moving Occupations
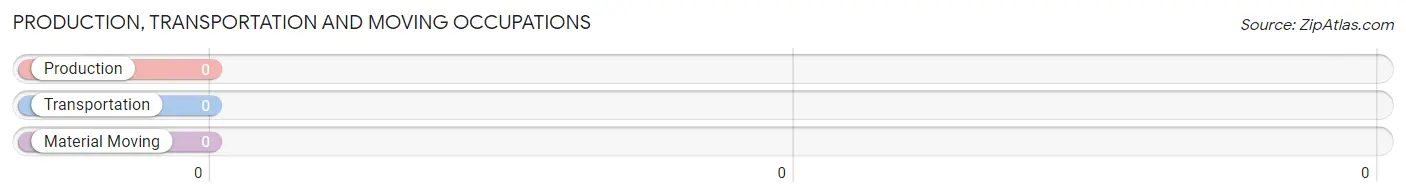
Production, Transportation and Moving Occupations by Sex
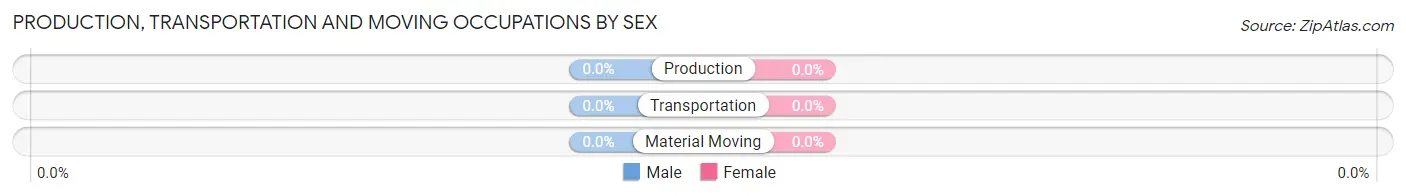
| Occupation | Male | Female |
| Production | 0 (0.0%) | 0 (0.0%) |
| Transportation | 0 (0.0%) | 0 (0.0%) |
| Material Moving | 0 (0.0%) | 0 (0.0%) |
| Total (Category) | 0 (0.0%) | 0 (0.0%) |
| Total (Overall) | 52 (72.2%) | 20 (27.8%) |
Employment Industries by Sex in Bear Creek
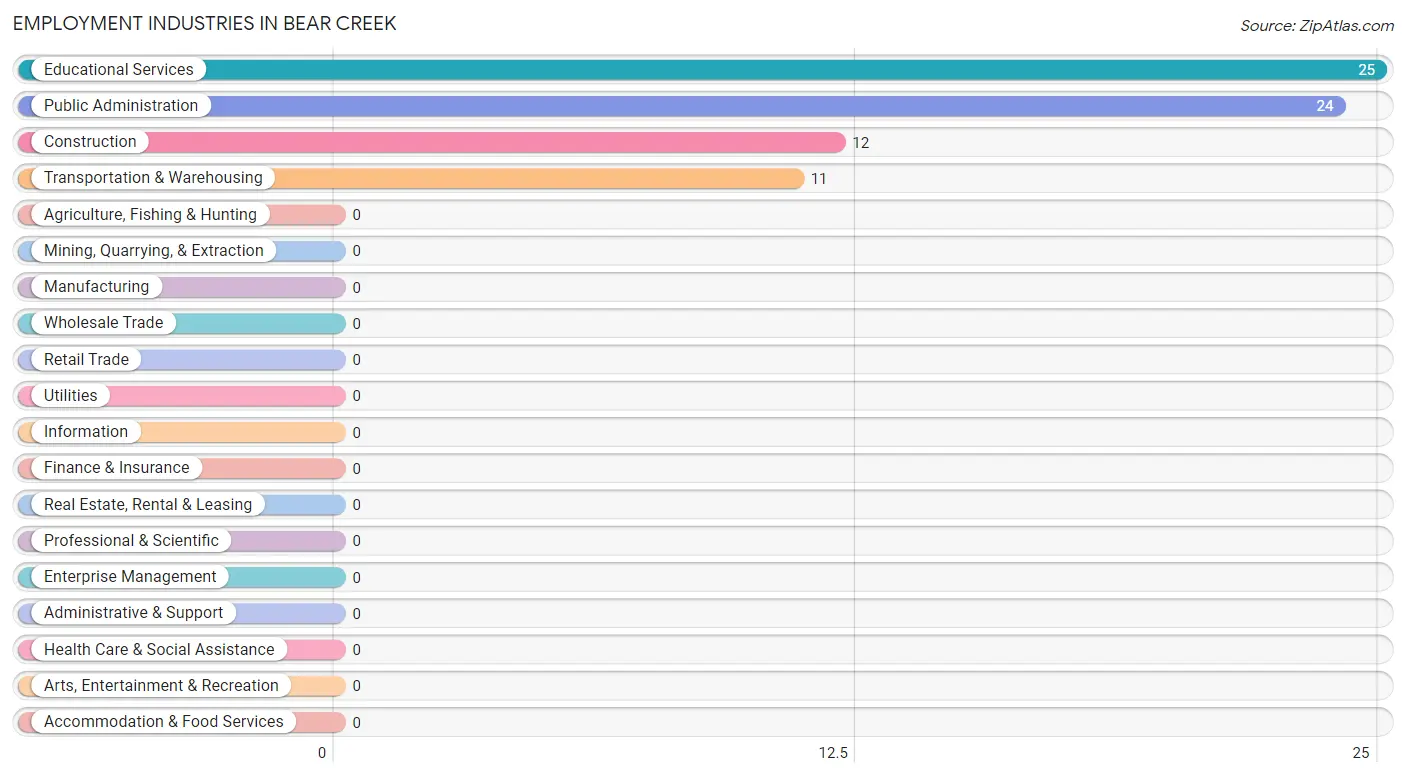
Employment Industries in Bear Creek
The major employment industries in Bear Creek include Educational Services (25 | 34.7%), Public Administration (24 | 33.3%), Construction (12 | 16.7%), and Transportation & Warehousing (11 | 15.3%).
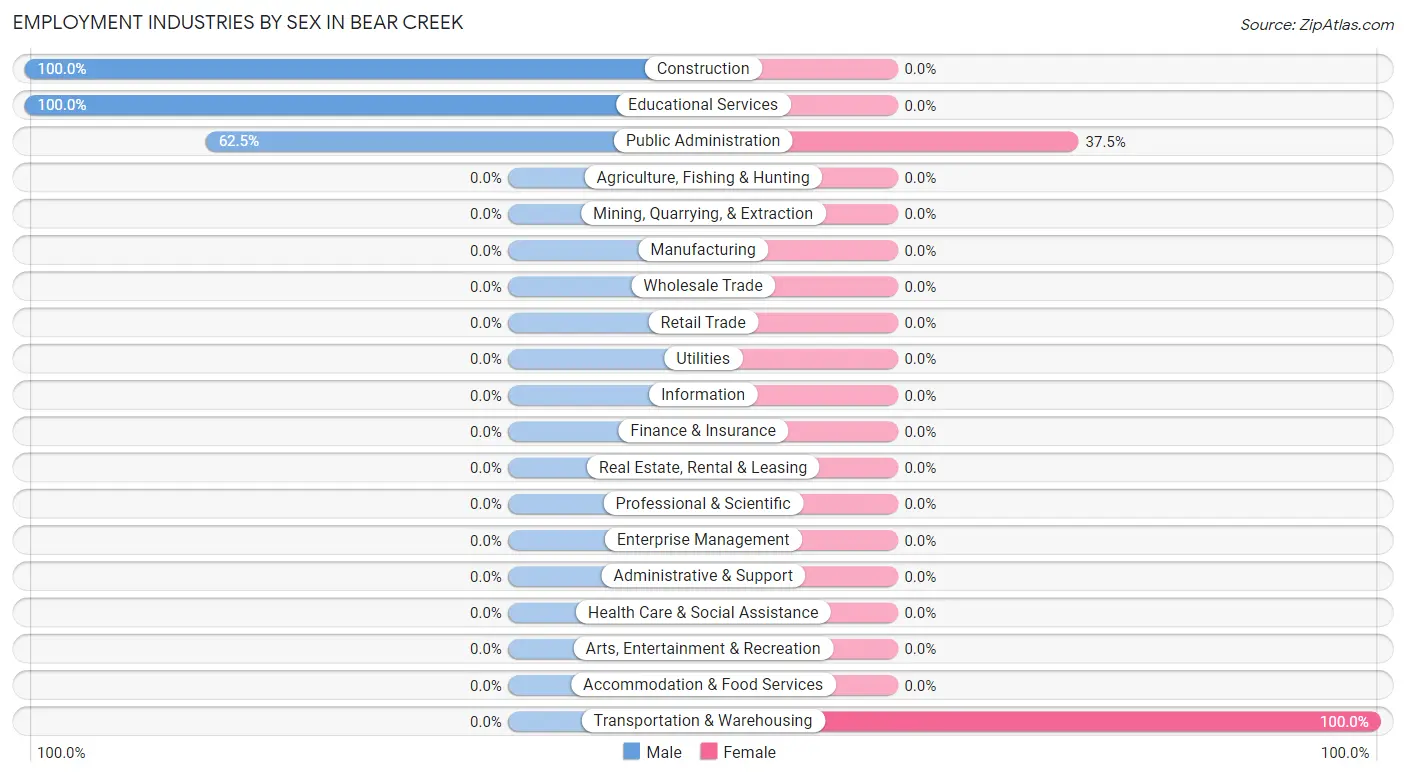
Employment Industries by Sex in Bear Creek
The Bear Creek industries that see more men than women are Construction (100.0%), Educational Services (100.0%), and Public Administration (62.5%), whereas the industries that tend to have a higher number of women are Transportation & Warehousing (100.0%), and Public Administration (37.5%).
| Industry | Male | Female |
| Agriculture, Fishing & Hunting | 0 (0.0%) | 0 (0.0%) |
| Mining, Quarrying, & Extraction | 0 (0.0%) | 0 (0.0%) |
| Construction | 12 (100.0%) | 0 (0.0%) |
| Manufacturing | 0 (0.0%) | 0 (0.0%) |
| Wholesale Trade | 0 (0.0%) | 0 (0.0%) |
| Retail Trade | 0 (0.0%) | 0 (0.0%) |
| Transportation & Warehousing | 0 (0.0%) | 11 (100.0%) |
| Utilities | 0 (0.0%) | 0 (0.0%) |
| Information | 0 (0.0%) | 0 (0.0%) |
| Finance & Insurance | 0 (0.0%) | 0 (0.0%) |
| Real Estate, Rental & Leasing | 0 (0.0%) | 0 (0.0%) |
| Professional & Scientific | 0 (0.0%) | 0 (0.0%) |
| Enterprise Management | 0 (0.0%) | 0 (0.0%) |
| Administrative & Support | 0 (0.0%) | 0 (0.0%) |
| Educational Services | 25 (100.0%) | 0 (0.0%) |
| Health Care & Social Assistance | 0 (0.0%) | 0 (0.0%) |
| Arts, Entertainment & Recreation | 0 (0.0%) | 0 (0.0%) |
| Accommodation & Food Services | 0 (0.0%) | 0 (0.0%) |
| Public Administration | 15 (62.5%) | 9 (37.5%) |
| Total | 52 (72.2%) | 20 (27.8%) |
Education in Bear Creek
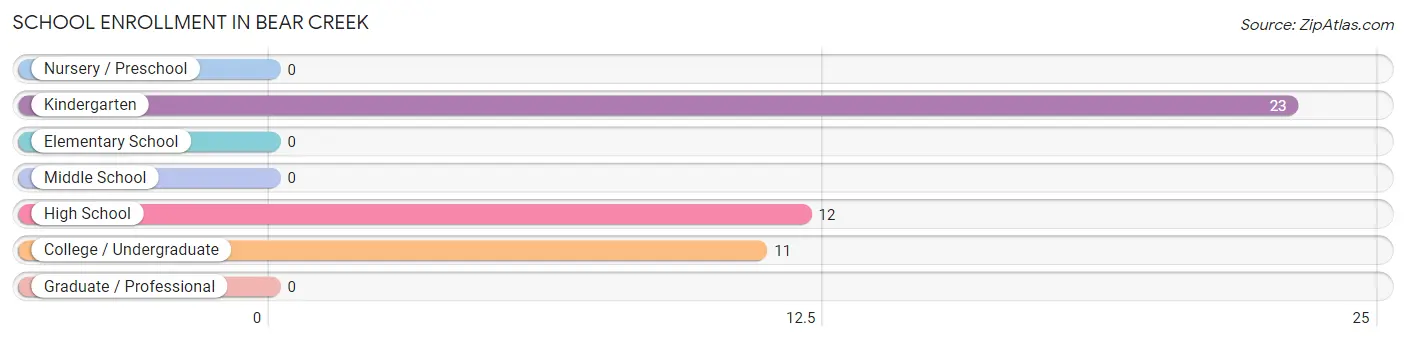
School Enrollment in Bear Creek
The most common levels of schooling among the 46 students in Bear Creek are kindergarten (23 | 50.0%), high school (12 | 26.1%), and college / undergraduate (11 | 23.9%).
| School Level | # Students | % Students |
| Nursery / Preschool | 0 | 0.0% |
| Kindergarten | 23 | 50.0% |
| Elementary School | 0 | 0.0% |
| Middle School | 0 | 0.0% |
| High School | 12 | 26.1% |
| College / Undergraduate | 11 | 23.9% |
| Graduate / Professional | 0 | 0.0% |
| Total | 46 | 100.0% |
School Enrollment by Age by Funding Source in Bear Creek
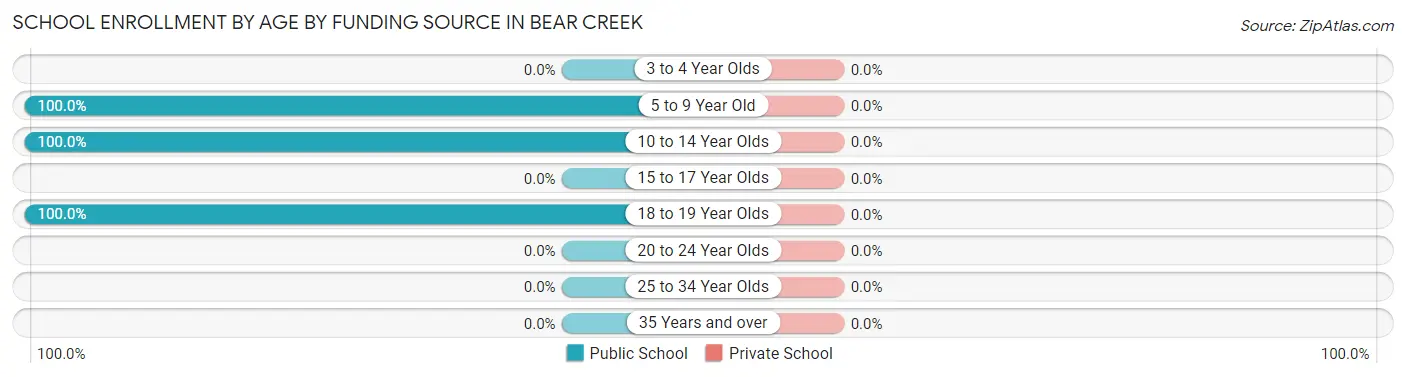
| Age Bracket | Public School | Private School |
| 3 to 4 Year Olds | 0 (0.0%) | 0 (0.0%) |
| 5 to 9 Year Old | 23 (100.0%) | 0 (0.0%) |
| 10 to 14 Year Olds | 12 (100.0%) | 0 (0.0%) |
| 15 to 17 Year Olds | 0 (0.0%) | 0 (0.0%) |
| 18 to 19 Year Olds | 11 (100.0%) | 0 (0.0%) |
| 20 to 24 Year Olds | 0 (0.0%) | 0 (0.0%) |
| 25 to 34 Year Olds | 0 (0.0%) | 0 (0.0%) |
| 35 Years and over | 0 (0.0%) | 0 (0.0%) |
| Total | 46 (100.0%) | 0 (0.0%) |
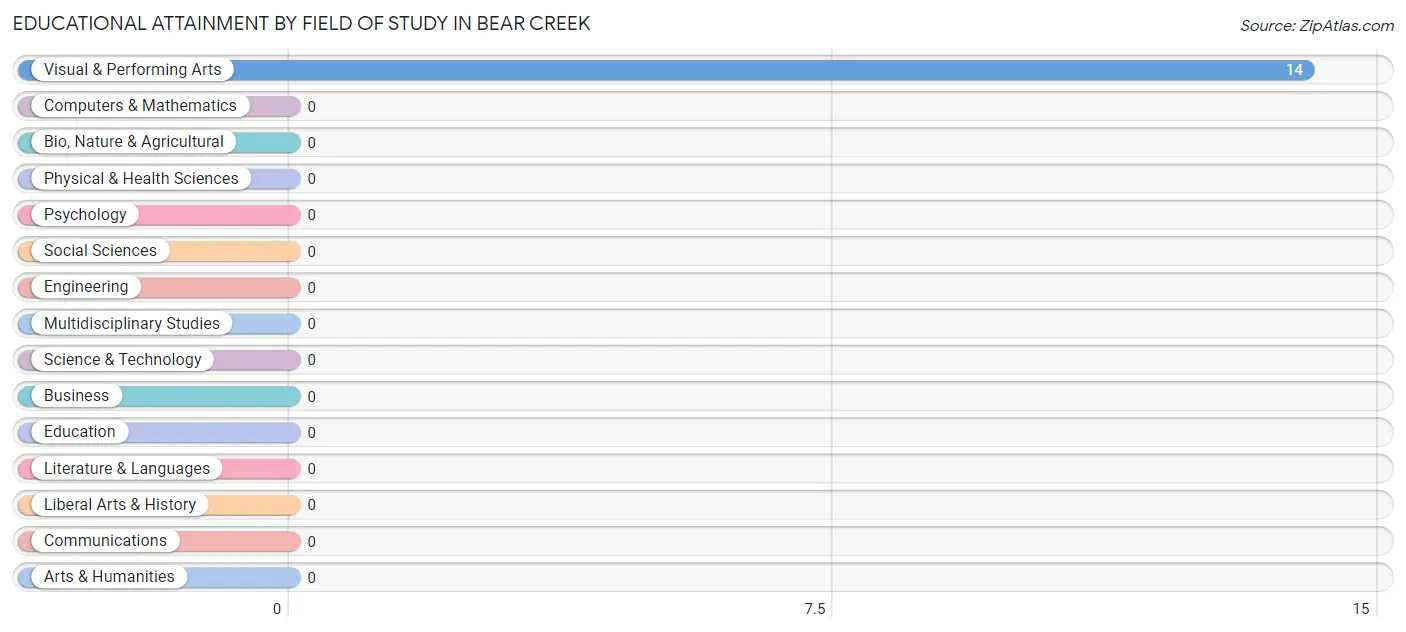
Educational Attainment by Field of Study in Bear Creek
, and visual & performing arts (14 | 100.0%) are the most common fields of study among 14 individuals in Bear Creek who have obtained a bachelor's degree or higher.
| Field of Study | # Graduates | % Graduates |
| Computers & Mathematics | 0 | 0.0% |
| Bio, Nature & Agricultural | 0 | 0.0% |
| Physical & Health Sciences | 0 | 0.0% |
| Psychology | 0 | 0.0% |
| Social Sciences | 0 | 0.0% |
| Engineering | 0 | 0.0% |
| Multidisciplinary Studies | 0 | 0.0% |
| Science & Technology | 0 | 0.0% |
| Business | 0 | 0.0% |
| Education | 0 | 0.0% |
| Literature & Languages | 0 | 0.0% |
| Liberal Arts & History | 0 | 0.0% |
| Visual & Performing Arts | 14 | 100.0% |
| Communications | 0 | 0.0% |
| Arts & Humanities | 0 | 0.0% |
| Total | 14 | 100.0% |
Transportation & Commute in Bear Creek
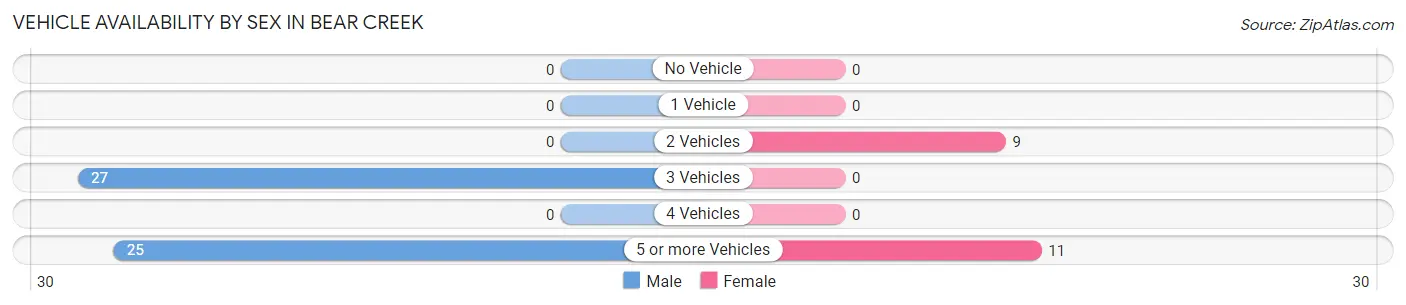
Vehicle Availability by Sex in Bear Creek
The most prevalent vehicle ownership categories in Bear Creek are males with 3 vehicles (27, accounting for 51.9%) and females with 3 vehicles (0, making up 135.0%).
| Vehicles Available | Male | Female |
| No Vehicle | 0 (0.0%) | 0 (0.0%) |
| 1 Vehicle | 0 (0.0%) | 0 (0.0%) |
| 2 Vehicles | 0 (0.0%) | 9 (45.0%) |
| 3 Vehicles | 27 (51.9%) | 0 (0.0%) |
| 4 Vehicles | 0 (0.0%) | 0 (0.0%) |
| 5 or more Vehicles | 25 (48.1%) | 11 (55.0%) |
| Total | 52 (100.0%) | 20 (100.0%) |
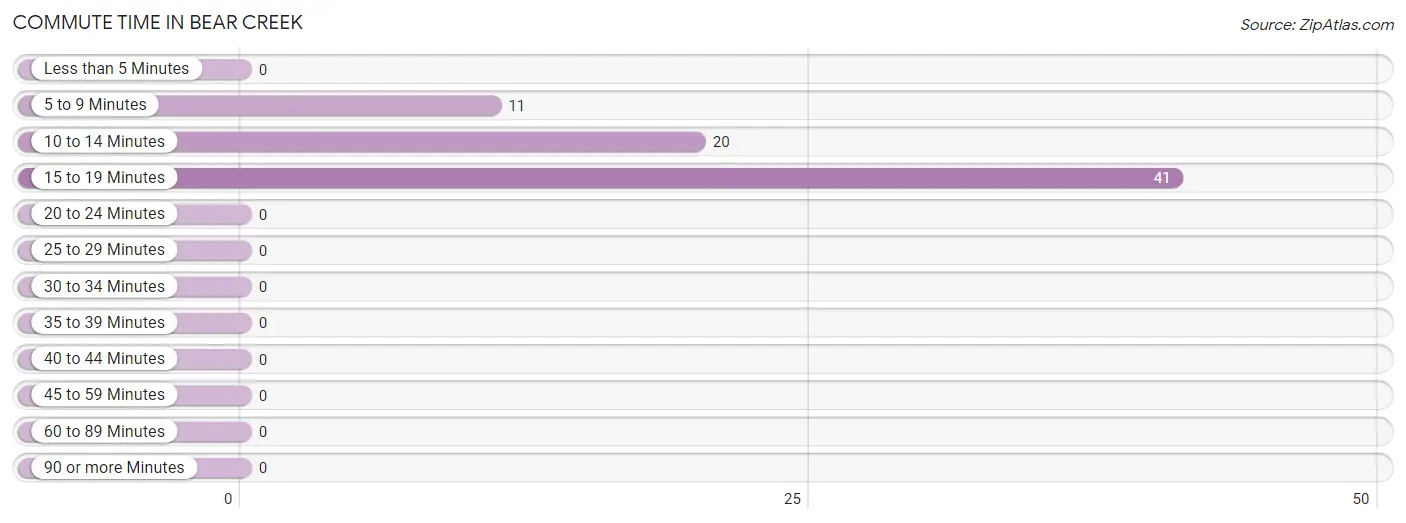
Commute Time in Bear Creek
The most frequently occuring commute durations in Bear Creek are 15 to 19 minutes (41 commuters, 56.9%), 10 to 14 minutes (20 commuters, 27.8%), and 5 to 9 minutes (11 commuters, 15.3%).
| Commute Time | # Commuters | % Commuters |
| Less than 5 Minutes | 0 | 0.0% |
| 5 to 9 Minutes | 11 | 15.3% |
| 10 to 14 Minutes | 20 | 27.8% |
| 15 to 19 Minutes | 41 | 56.9% |
| 20 to 24 Minutes | 0 | 0.0% |
| 25 to 29 Minutes | 0 | 0.0% |
| 30 to 34 Minutes | 0 | 0.0% |
| 35 to 39 Minutes | 0 | 0.0% |
| 40 to 44 Minutes | 0 | 0.0% |
| 45 to 59 Minutes | 0 | 0.0% |
| 60 to 89 Minutes | 0 | 0.0% |
| 90 or more Minutes | 0 | 0.0% |
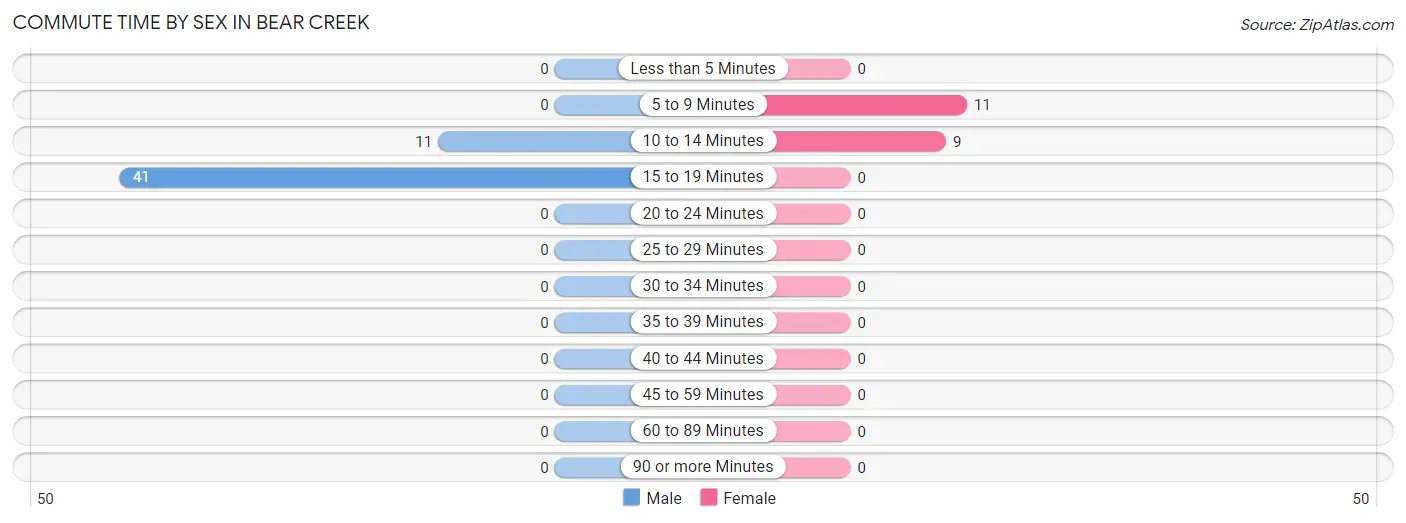
Commute Time by Sex in Bear Creek
The most common commute times in Bear Creek are 15 to 19 minutes (41 commuters, 78.8%) for males and 5 to 9 minutes (11 commuters, 55.0%) for females.
| Commute Time | Male | Female |
| Less than 5 Minutes | 0 (0.0%) | 0 (0.0%) |
| 5 to 9 Minutes | 0 (0.0%) | 11 (55.0%) |
| 10 to 14 Minutes | 11 (21.1%) | 9 (45.0%) |
| 15 to 19 Minutes | 41 (78.8%) | 0 (0.0%) |
| 20 to 24 Minutes | 0 (0.0%) | 0 (0.0%) |
| 25 to 29 Minutes | 0 (0.0%) | 0 (0.0%) |
| 30 to 34 Minutes | 0 (0.0%) | 0 (0.0%) |
| 35 to 39 Minutes | 0 (0.0%) | 0 (0.0%) |
| 40 to 44 Minutes | 0 (0.0%) | 0 (0.0%) |
| 45 to 59 Minutes | 0 (0.0%) | 0 (0.0%) |
| 60 to 89 Minutes | 0 (0.0%) | 0 (0.0%) |
| 90 or more Minutes | 0 (0.0%) | 0 (0.0%) |
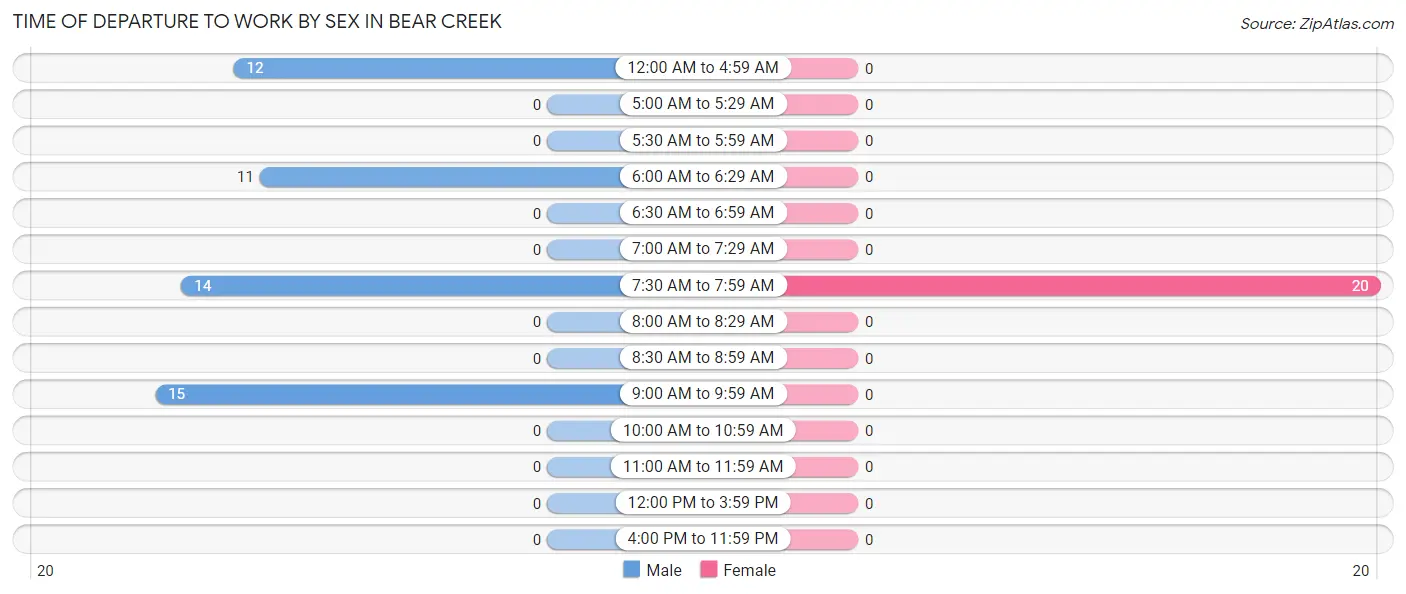
Time of Departure to Work by Sex in Bear Creek
The most frequent times of departure to work in Bear Creek are 9:00 AM to 9:59 AM (15, 28.8%) for males and 7:30 AM to 7:59 AM (20, 100.0%) for females.
| Time of Departure | Male | Female |
| 12:00 AM to 4:59 AM | 12 (23.1%) | 0 (0.0%) |
| 5:00 AM to 5:29 AM | 0 (0.0%) | 0 (0.0%) |
| 5:30 AM to 5:59 AM | 0 (0.0%) | 0 (0.0%) |
| 6:00 AM to 6:29 AM | 11 (21.1%) | 0 (0.0%) |
| 6:30 AM to 6:59 AM | 0 (0.0%) | 0 (0.0%) |
| 7:00 AM to 7:29 AM | 0 (0.0%) | 0 (0.0%) |
| 7:30 AM to 7:59 AM | 14 (26.9%) | 20 (100.0%) |
| 8:00 AM to 8:29 AM | 0 (0.0%) | 0 (0.0%) |
| 8:30 AM to 8:59 AM | 0 (0.0%) | 0 (0.0%) |
| 9:00 AM to 9:59 AM | 15 (28.8%) | 0 (0.0%) |
| 10:00 AM to 10:59 AM | 0 (0.0%) | 0 (0.0%) |
| 11:00 AM to 11:59 AM | 0 (0.0%) | 0 (0.0%) |
| 12:00 PM to 3:59 PM | 0 (0.0%) | 0 (0.0%) |
| 4:00 PM to 11:59 PM | 0 (0.0%) | 0 (0.0%) |
| Total | 52 (100.0%) | 20 (100.0%) |
Housing Occupancy in Bear Creek
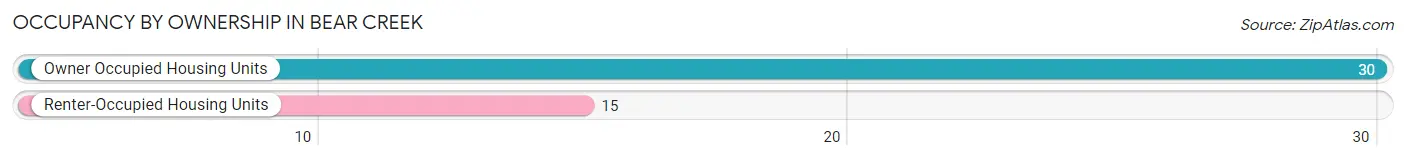
Occupancy by Ownership in Bear Creek
Of the total 45 dwellings in Bear Creek, owner-occupied units account for 30 (66.7%), while renter-occupied units make up 15 (33.3%).
| Occupancy | # Housing Units | % Housing Units |
| Owner Occupied Housing Units | 30 | 66.7% |
| Renter-Occupied Housing Units | 15 | 33.3% |
| Total Occupied Housing Units | 45 | 100.0% |
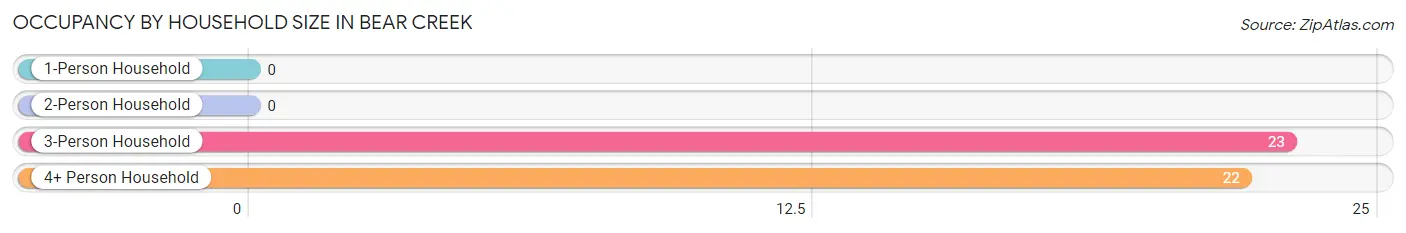
Occupancy by Household Size in Bear Creek
| Household Size | # Housing Units | % Housing Units |
| 1-Person Household | 0 | 0.0% |
| 2-Person Household | 0 | 0.0% |
| 3-Person Household | 23 | 51.1% |
| 4+ Person Household | 22 | 48.9% |
| Total Housing Units | 45 | 100.0% |
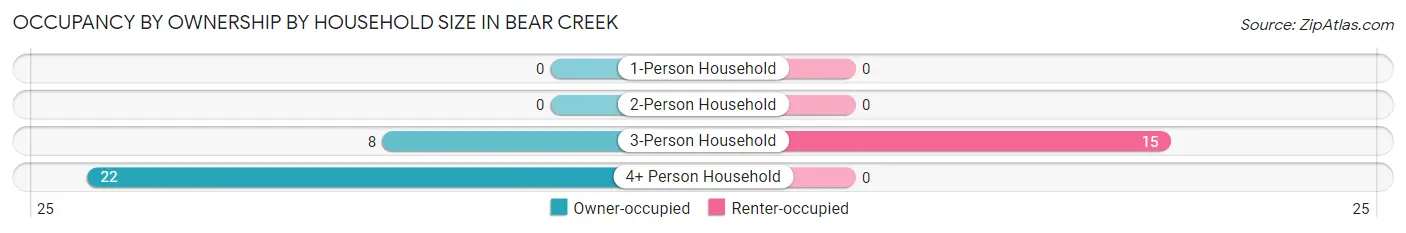
Occupancy by Ownership by Household Size in Bear Creek
| Household Size | Owner-occupied | Renter-occupied |
| 1-Person Household | 0 (0.0%) | 0 (0.0%) |
| 2-Person Household | 0 (0.0%) | 0 (0.0%) |
| 3-Person Household | 8 (34.8%) | 15 (65.2%) |
| 4+ Person Household | 22 (100.0%) | 0 (0.0%) |
| Total Housing Units | 30 (66.7%) | 15 (33.3%) |
Occupancy by Educational Attainment in Bear Creek
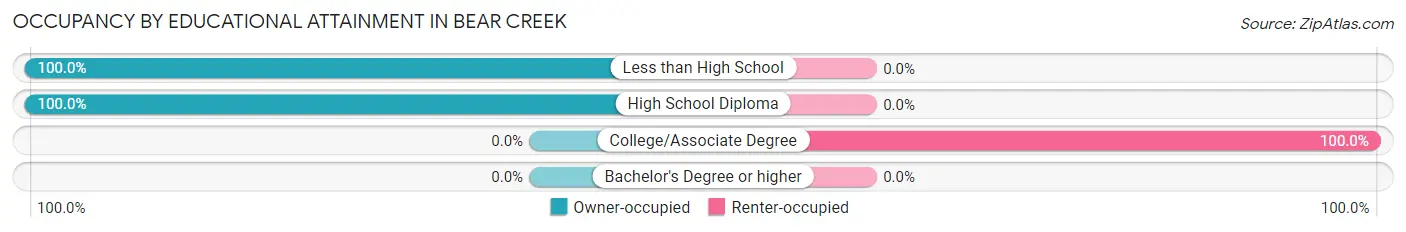
| Household Size | Owner-occupied | Renter-occupied |
| Less than High School | 8 (100.0%) | 0 (0.0%) |
| High School Diploma | 22 (100.0%) | 0 (0.0%) |
| College/Associate Degree | 0 (0.0%) | 15 (100.0%) |
| Bachelor's Degree or higher | 0 (0.0%) | 0 (0.0%) |
Occupancy by Age of Householder in Bear Creek
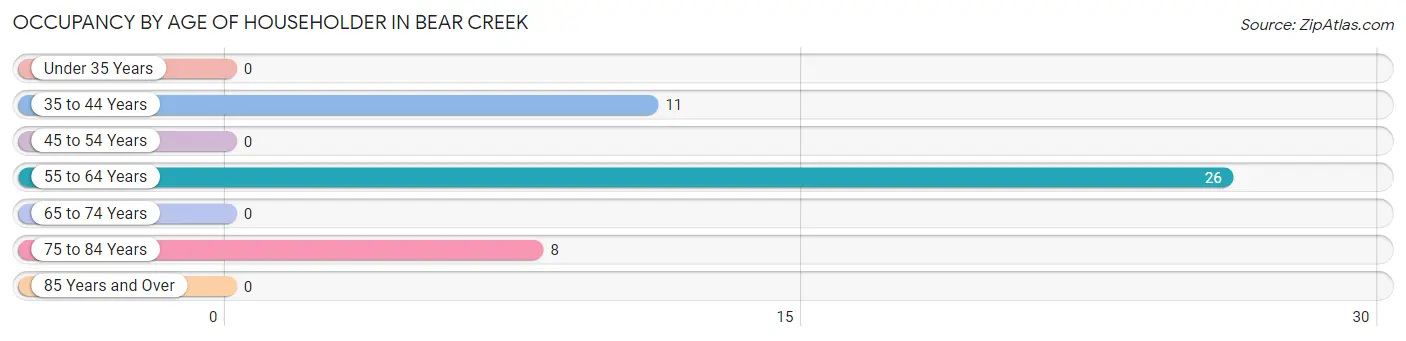
| Age Bracket | # Households | % Households |
| Under 35 Years | 0 | 0.0% |
| 35 to 44 Years | 11 | 24.4% |
| 45 to 54 Years | 0 | 0.0% |
| 55 to 64 Years | 26 | 57.8% |
| 65 to 74 Years | 0 | 0.0% |
| 75 to 84 Years | 8 | 17.8% |
| 85 Years and Over | 0 | 0.0% |
| Total | 45 | 100.0% |
Housing Finances in Bear Creek
Median Income by Occupancy in Bear Creek
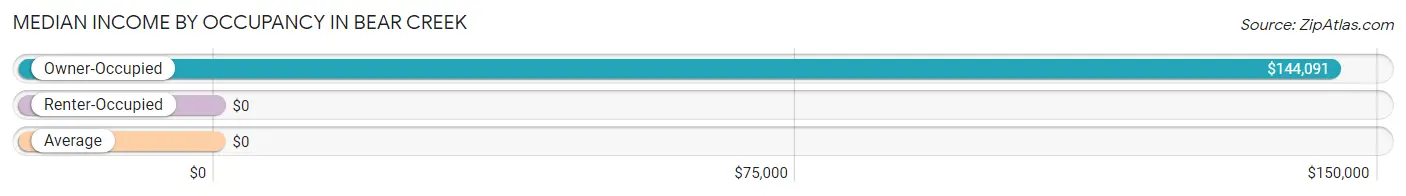
| Occupancy Type | # Households | Median Income |
| Owner-Occupied | 30 (66.7%) | $144,091 |
| Renter-Occupied | 15 (33.3%) | $0 |
| Average | 45 (100.0%) | $0 |
Occupancy by Householder Income Bracket in Bear Creek
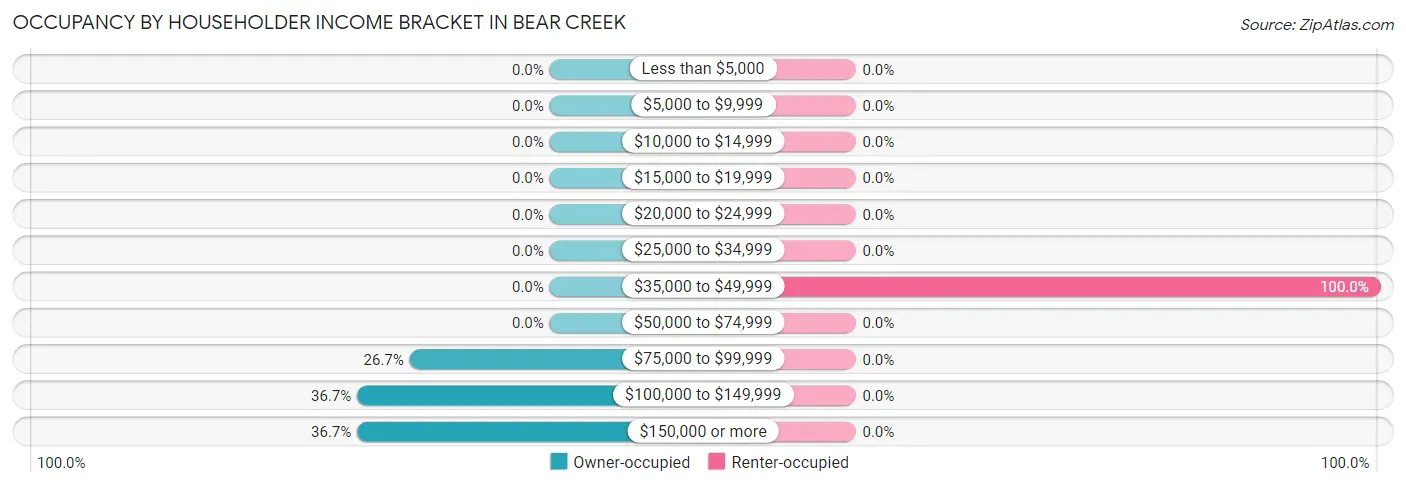
| Income Bracket | Owner-occupied | Renter-occupied |
| Less than $5,000 | 0 (0.0%) | 0 (0.0%) |
| $5,000 to $9,999 | 0 (0.0%) | 0 (0.0%) |
| $10,000 to $14,999 | 0 (0.0%) | 0 (0.0%) |
| $15,000 to $19,999 | 0 (0.0%) | 0 (0.0%) |
| $20,000 to $24,999 | 0 (0.0%) | 0 (0.0%) |
| $25,000 to $34,999 | 0 (0.0%) | 0 (0.0%) |
| $35,000 to $49,999 | 0 (0.0%) | 15 (100.0%) |
| $50,000 to $74,999 | 0 (0.0%) | 0 (0.0%) |
| $75,000 to $99,999 | 8 (26.7%) | 0 (0.0%) |
| $100,000 to $149,999 | 11 (36.7%) | 0 (0.0%) |
| $150,000 or more | 11 (36.7%) | 0 (0.0%) |
| Total | 30 (100.0%) | 15 (100.0%) |
Monthly Housing Cost Tiers in Bear Creek
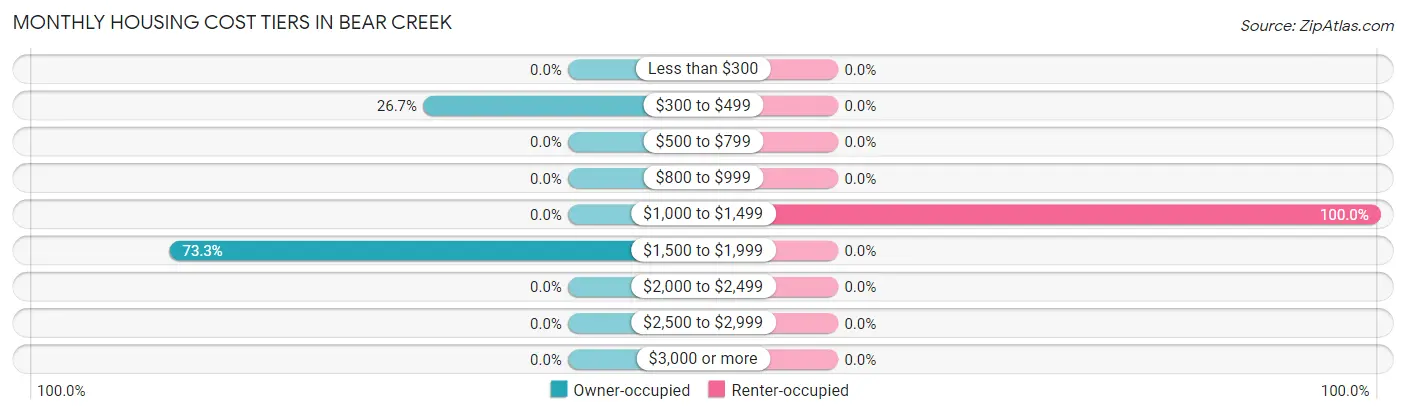
| Monthly Cost | Owner-occupied | Renter-occupied |
| Less than $300 | 0 (0.0%) | 0 (0.0%) |
| $300 to $499 | 8 (26.7%) | 0 (0.0%) |
| $500 to $799 | 0 (0.0%) | 0 (0.0%) |
| $800 to $999 | 0 (0.0%) | 0 (0.0%) |
| $1,000 to $1,499 | 0 (0.0%) | 15 (100.0%) |
| $1,500 to $1,999 | 22 (73.3%) | 0 (0.0%) |
| $2,000 to $2,499 | 0 (0.0%) | 0 (0.0%) |
| $2,500 to $2,999 | 0 (0.0%) | 0 (0.0%) |
| $3,000 or more | 0 (0.0%) | 0 (0.0%) |
| Total | 30 (100.0%) | 15 (100.0%) |
Physical Housing Characteristics in Bear Creek
Housing Structures in Bear Creek
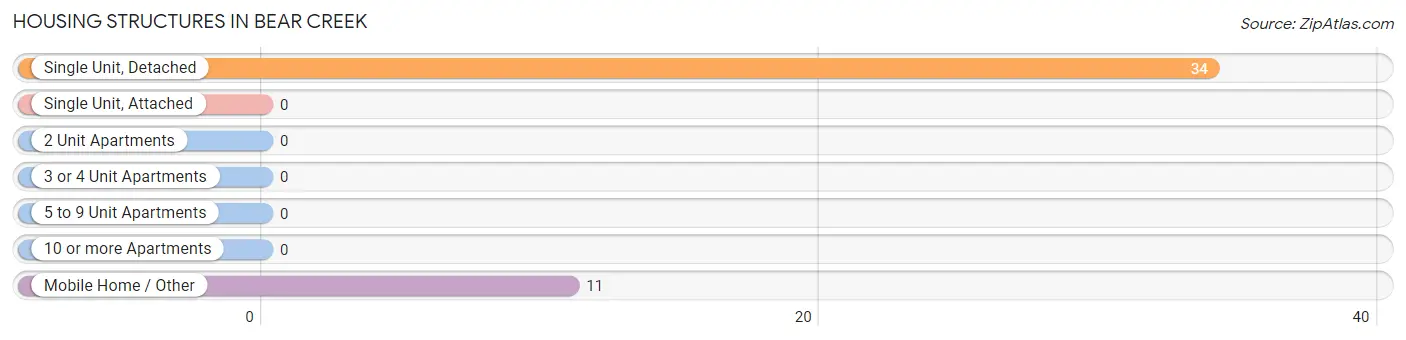
| Structure Type | # Housing Units | % Housing Units |
| Single Unit, Detached | 34 | 75.6% |
| Single Unit, Attached | 0 | 0.0% |
| 2 Unit Apartments | 0 | 0.0% |
| 3 or 4 Unit Apartments | 0 | 0.0% |
| 5 to 9 Unit Apartments | 0 | 0.0% |
| 10 or more Apartments | 0 | 0.0% |
| Mobile Home / Other | 11 | 24.4% |
| Total | 45 | 100.0% |
Housing Structures by Occupancy in Bear Creek
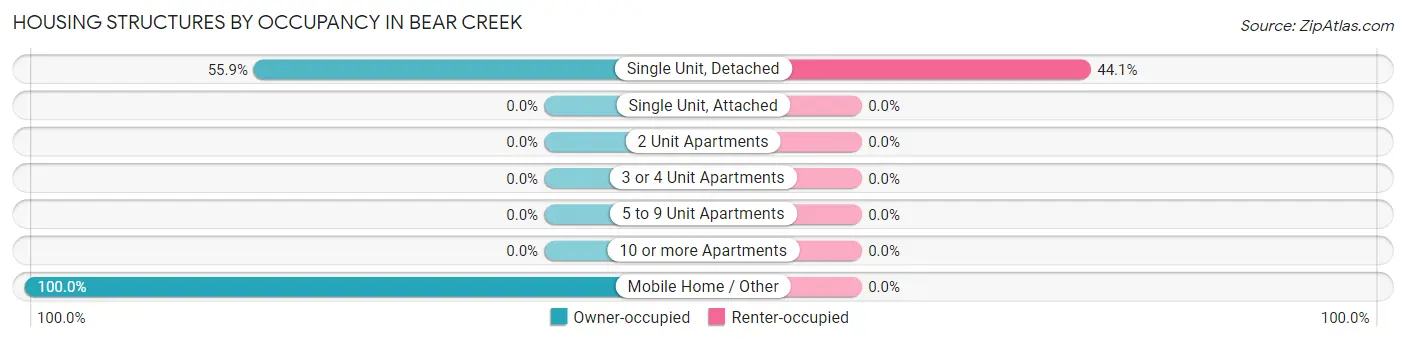
| Structure Type | Owner-occupied | Renter-occupied |
| Single Unit, Detached | 19 (55.9%) | 15 (44.1%) |
| Single Unit, Attached | 0 (0.0%) | 0 (0.0%) |
| 2 Unit Apartments | 0 (0.0%) | 0 (0.0%) |
| 3 or 4 Unit Apartments | 0 (0.0%) | 0 (0.0%) |
| 5 to 9 Unit Apartments | 0 (0.0%) | 0 (0.0%) |
| 10 or more Apartments | 0 (0.0%) | 0 (0.0%) |
| Mobile Home / Other | 11 (100.0%) | 0 (0.0%) |
| Total | 30 (66.7%) | 15 (33.3%) |
Housing Structures by Number of Rooms in Bear Creek
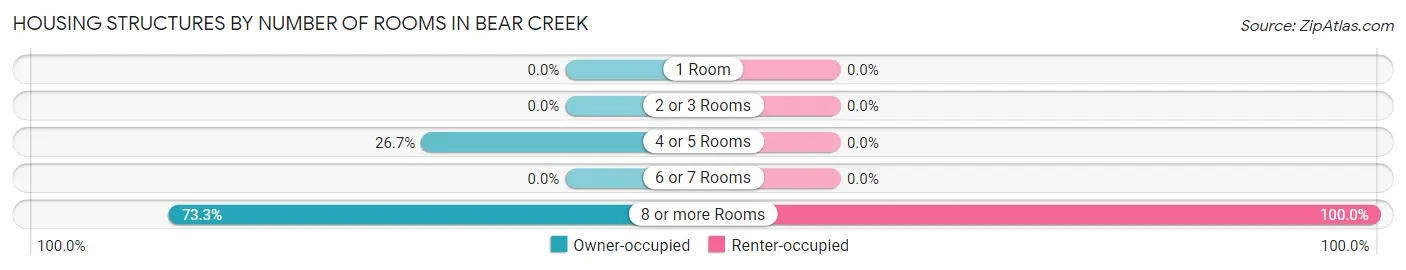
| Number of Rooms | Owner-occupied | Renter-occupied |
| 1 Room | 0 (0.0%) | 0 (0.0%) |
| 2 or 3 Rooms | 0 (0.0%) | 0 (0.0%) |
| 4 or 5 Rooms | 8 (26.7%) | 0 (0.0%) |
| 6 or 7 Rooms | 0 (0.0%) | 0 (0.0%) |
| 8 or more Rooms | 22 (73.3%) | 15 (100.0%) |
| Total | 30 (100.0%) | 15 (100.0%) |
Housing Structure by Heating Type in Bear Creek
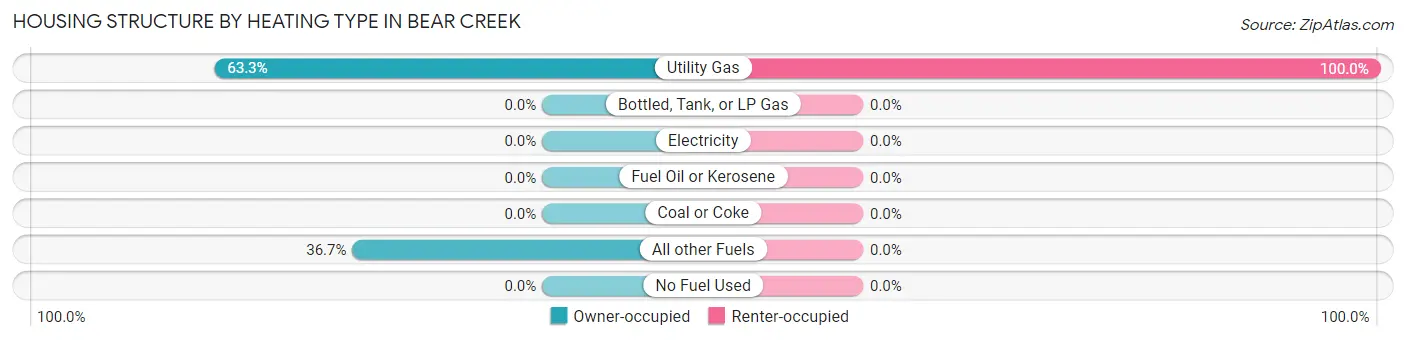
| Heating Type | Owner-occupied | Renter-occupied |
| Utility Gas | 19 (63.3%) | 15 (100.0%) |
| Bottled, Tank, or LP Gas | 0 (0.0%) | 0 (0.0%) |
| Electricity | 0 (0.0%) | 0 (0.0%) |
| Fuel Oil or Kerosene | 0 (0.0%) | 0 (0.0%) |
| Coal or Coke | 0 (0.0%) | 0 (0.0%) |
| All other Fuels | 11 (36.7%) | 0 (0.0%) |
| No Fuel Used | 0 (0.0%) | 0 (0.0%) |
| Total | 30 (100.0%) | 15 (100.0%) |
Household Vehicle Usage in Bear Creek
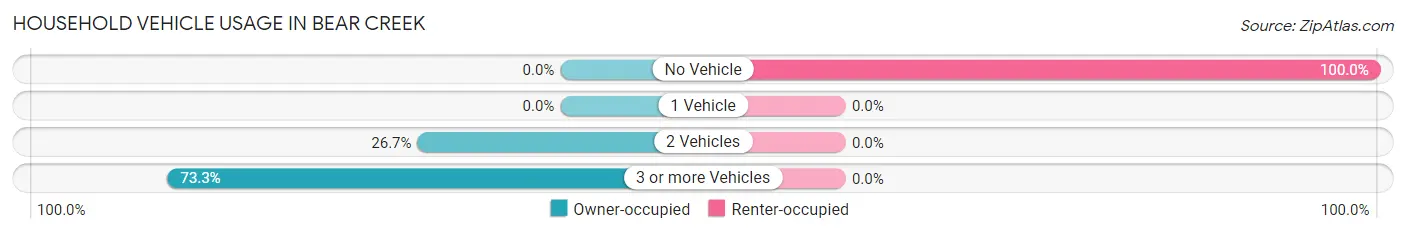
| Vehicles per Household | Owner-occupied | Renter-occupied |
| No Vehicle | 0 (0.0%) | 15 (100.0%) |
| 1 Vehicle | 0 (0.0%) | 0 (0.0%) |
| 2 Vehicles | 8 (26.7%) | 0 (0.0%) |
| 3 or more Vehicles | 22 (73.3%) | 0 (0.0%) |
| Total | 30 (100.0%) | 15 (100.0%) |
Real Estate & Mortgages in Bear Creek
Real Estate and Mortgage Overview in Bear Creek
| Characteristic | Without Mortgage | With Mortgage |
| Housing Units | 19 | 11 |
| Median Property Value | - | - |
| Median Household Income | - | - |
| Monthly Housing Costs | - | - |
| Real Estate Taxes | - | - |
Property Value by Mortgage Status in Bear Creek
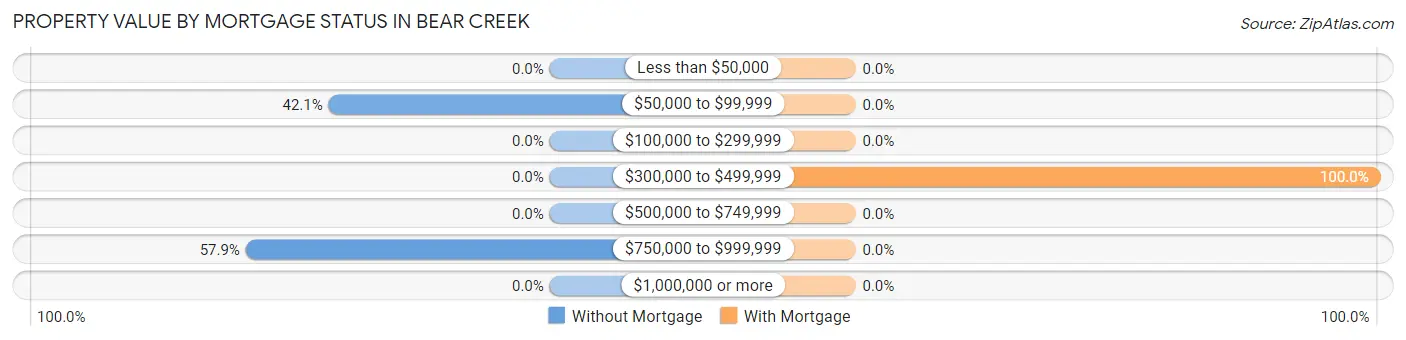
| Property Value | Without Mortgage | With Mortgage |
| Less than $50,000 | 0 (0.0%) | 0 (0.0%) |
| $50,000 to $99,999 | 8 (42.1%) | 0 (0.0%) |
| $100,000 to $299,999 | 0 (0.0%) | 0 (0.0%) |
| $300,000 to $499,999 | 0 (0.0%) | 11 (100.0%) |
| $500,000 to $749,999 | 0 (0.0%) | 0 (0.0%) |
| $750,000 to $999,999 | 11 (57.9%) | 0 (0.0%) |
| $1,000,000 or more | 0 (0.0%) | 0 (0.0%) |
| Total | 19 (100.0%) | 11 (100.0%) |
Household Income by Mortgage Status in Bear Creek
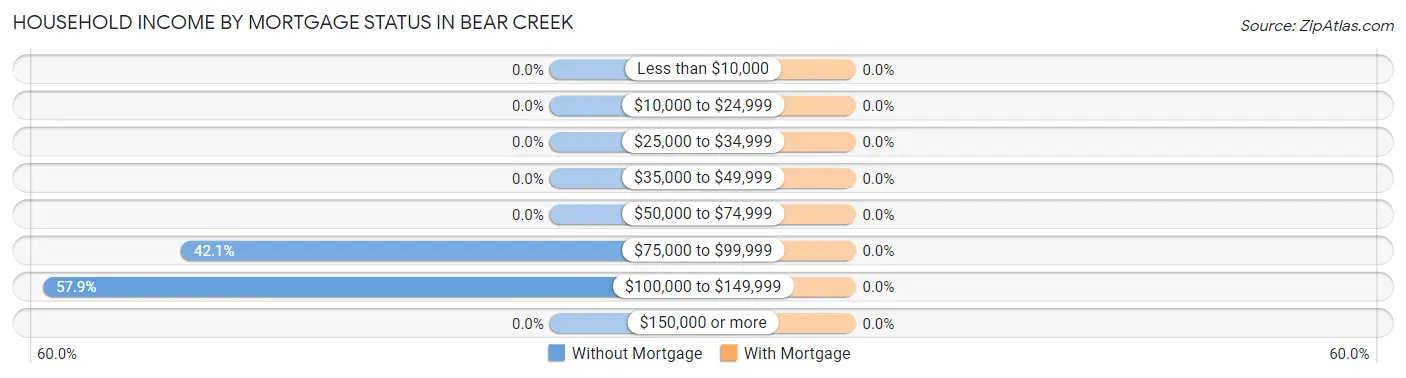
| Household Income | Without Mortgage | With Mortgage |
| Less than $10,000 | 0 (0.0%) | 0 (0.0%) |
| $10,000 to $24,999 | 0 (0.0%) | 0 (0.0%) |
| $25,000 to $34,999 | 0 (0.0%) | 0 (0.0%) |
| $35,000 to $49,999 | 0 (0.0%) | 0 (0.0%) |
| $50,000 to $74,999 | 0 (0.0%) | 0 (0.0%) |
| $75,000 to $99,999 | 8 (42.1%) | 0 (0.0%) |
| $100,000 to $149,999 | 11 (57.9%) | 0 (0.0%) |
| $150,000 or more | 0 (0.0%) | 0 (0.0%) |
| Total | 19 (100.0%) | 11 (100.0%) |
Property Value to Household Income Ratio in Bear Creek
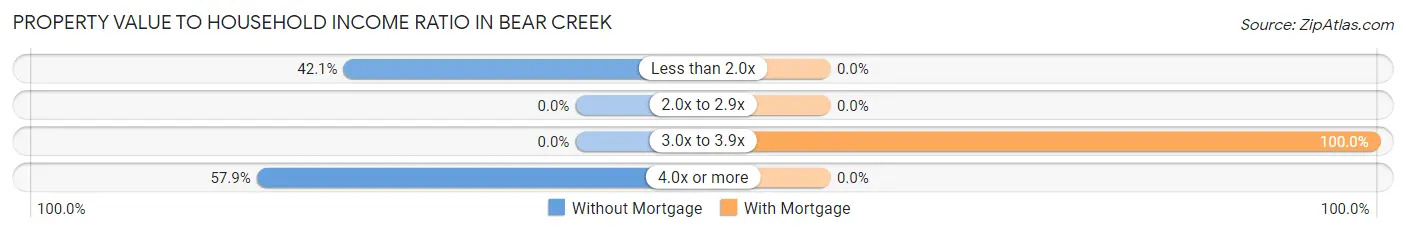
| Value-to-Income Ratio | Without Mortgage | With Mortgage |
| Less than 2.0x | 8 (42.1%) | 0 (0.0%) |
| 2.0x to 2.9x | 0 (0.0%) | 0 (0.0%) |
| 3.0x to 3.9x | 0 (0.0%) | 11 (100.0%) |
| 4.0x or more | 11 (57.9%) | 0 (0.0%) |
| Total | 19 (100.0%) | 11 (100.0%) |
Real Estate Taxes by Mortgage Status in Bear Creek
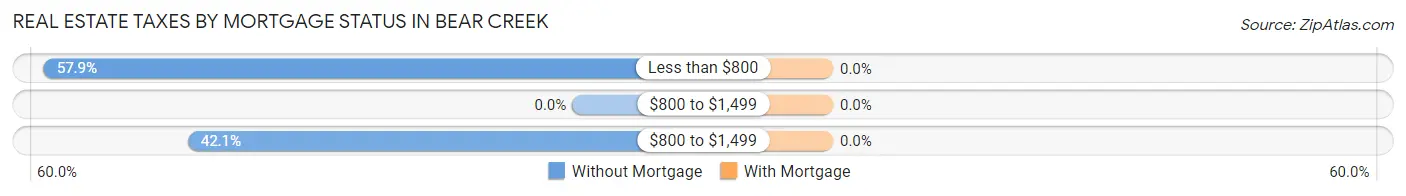
| Property Taxes | Without Mortgage | With Mortgage |
| Less than $800 | 11 (57.9%) | 0 (0.0%) |
| $800 to $1,499 | 0 (0.0%) | 0 (0.0%) |
| $800 to $1,499 | 8 (42.1%) | 0 (0.0%) |
| Total | 19 (100.0%) | 11 (100.0%) |
Health & Disability in Bear Creek
Health Insurance Coverage by Age in Bear Creek
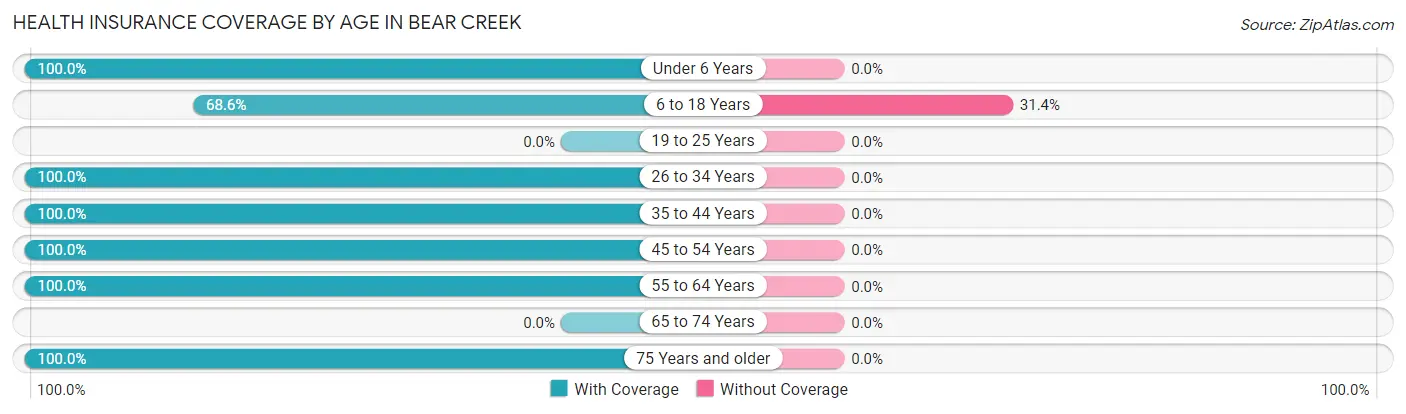
| Age Bracket | With Coverage | Without Coverage |
| Under 6 Years | 36 (100.0%) | 0 (0.0%) |
| 6 to 18 Years | 24 (68.6%) | 11 (31.4%) |
| 19 to 25 Years | 0 (0.0%) | 0 (0.0%) |
| 26 to 34 Years | 112 (100.0%) | 0 (0.0%) |
| 35 to 44 Years | 23 (100.0%) | 0 (0.0%) |
| 45 to 54 Years | 11 (100.0%) | 0 (0.0%) |
| 55 to 64 Years | 26 (100.0%) | 0 (0.0%) |
| 65 to 74 Years | 0 (0.0%) | 0 (0.0%) |
| 75 Years and older | 8 (100.0%) | 0 (0.0%) |
| Total | 240 (95.6%) | 11 (4.4%) |
Health Insurance Coverage by Citizenship Status in Bear Creek
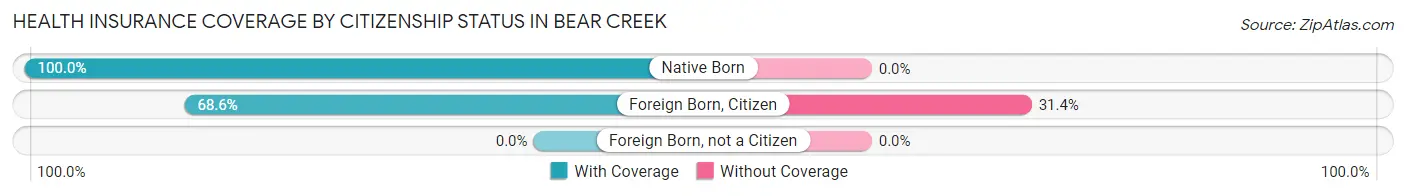
| Citizenship Status | With Coverage | Without Coverage |
| Native Born | 36 (100.0%) | 0 (0.0%) |
| Foreign Born, Citizen | 24 (68.6%) | 11 (31.4%) |
| Foreign Born, not a Citizen | 0 (0.0%) | 0 (0.0%) |
Health Insurance Coverage by Household Income in Bear Creek
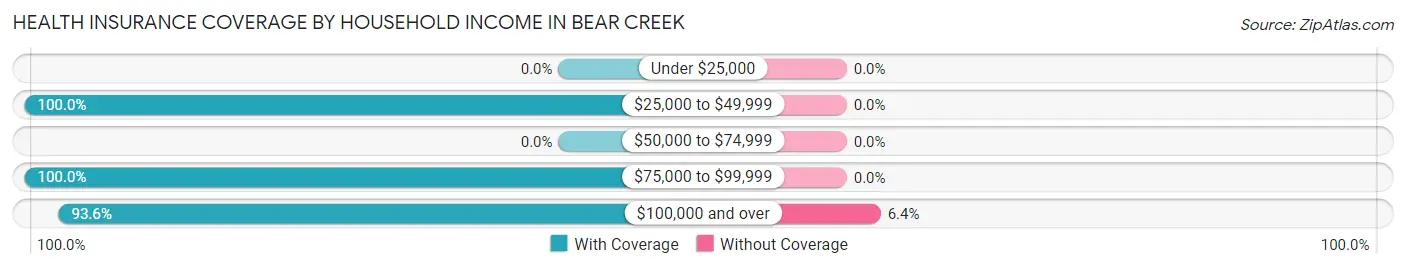
| Household Income | With Coverage | Without Coverage |
| Under $25,000 | 0 (0.0%) | 0 (0.0%) |
| $25,000 to $49,999 | 50 (100.0%) | 0 (0.0%) |
| $50,000 to $74,999 | 0 (0.0%) | 0 (0.0%) |
| $75,000 to $99,999 | 28 (100.0%) | 0 (0.0%) |
| $100,000 and over | 162 (93.6%) | 11 (6.4%) |
Public vs Private Health Insurance Coverage by Age in Bear Creek
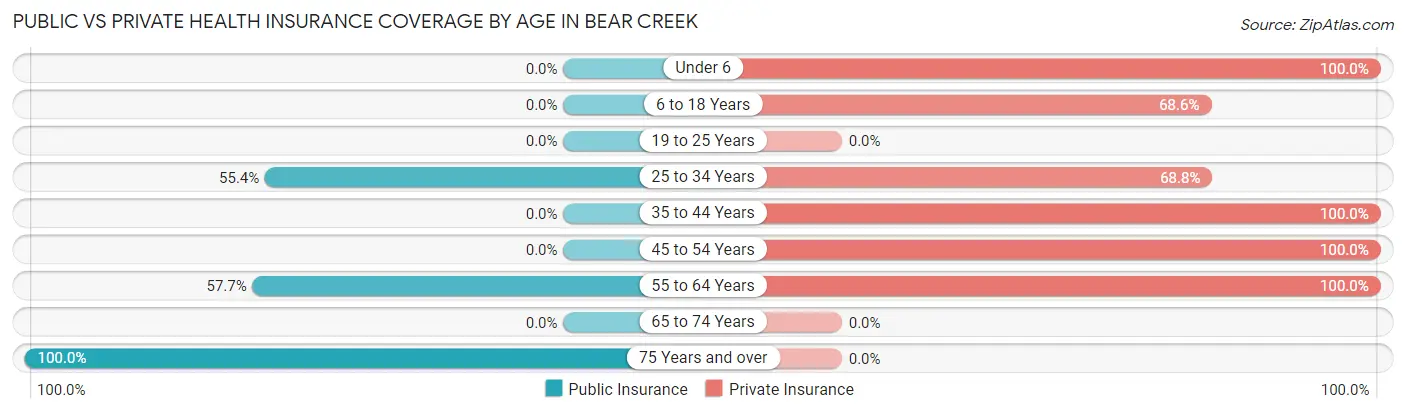
| Age Bracket | Public Insurance | Private Insurance |
| Under 6 | 0 (0.0%) | 36 (100.0%) |
| 6 to 18 Years | 0 (0.0%) | 24 (68.6%) |
| 19 to 25 Years | 0 (0.0%) | 0 (0.0%) |
| 25 to 34 Years | 62 (55.4%) | 77 (68.8%) |
| 35 to 44 Years | 0 (0.0%) | 23 (100.0%) |
| 45 to 54 Years | 0 (0.0%) | 11 (100.0%) |
| 55 to 64 Years | 15 (57.7%) | 26 (100.0%) |
| 65 to 74 Years | 0 (0.0%) | 0 (0.0%) |
| 75 Years and over | 8 (100.0%) | 0 (0.0%) |
| Total | 85 (33.9%) | 197 (78.5%) |
Disability Status by Sex by Age in Bear Creek
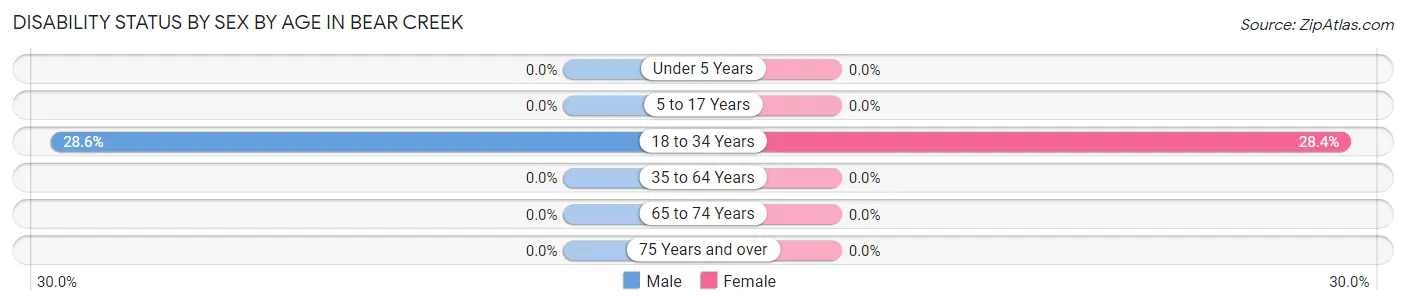
| Age Bracket | Male | Female |
| Under 5 Years | 0 (0.0%) | 0 (0.0%) |
| 5 to 17 Years | 0 (0.0%) | 0 (0.0%) |
| 18 to 34 Years | 16 (28.6%) | 19 (28.4%) |
| 35 to 64 Years | 0 (0.0%) | 0 (0.0%) |
| 65 to 74 Years | 0 (0.0%) | 0 (0.0%) |
| 75 Years and over | 0 (0.0%) | 0 (0.0%) |
Disability Class by Sex by Age in Bear Creek
Disability Class: Hearing Difficulty
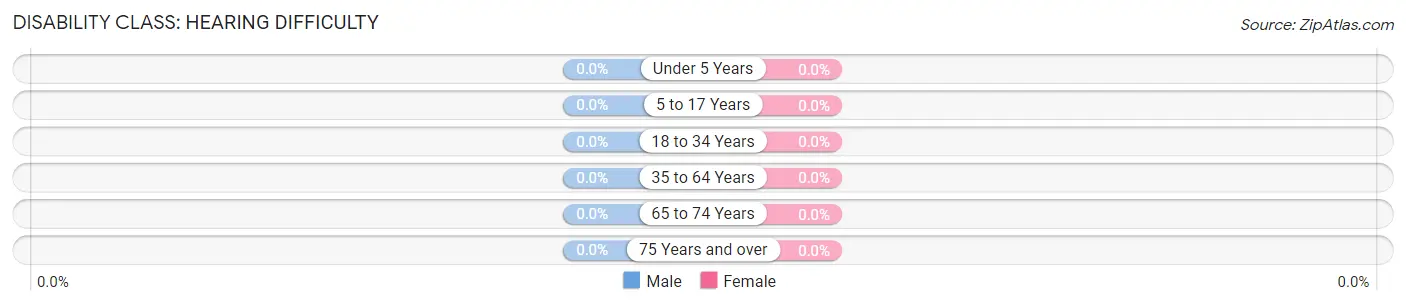
| Age Bracket | Male | Female |
| Under 5 Years | 0 (0.0%) | 0 (0.0%) |
| 5 to 17 Years | 0 (0.0%) | 0 (0.0%) |
| 18 to 34 Years | 0 (0.0%) | 0 (0.0%) |
| 35 to 64 Years | 0 (0.0%) | 0 (0.0%) |
| 65 to 74 Years | 0 (0.0%) | 0 (0.0%) |
| 75 Years and over | 0 (0.0%) | 0 (0.0%) |
Disability Class: Vision Difficulty
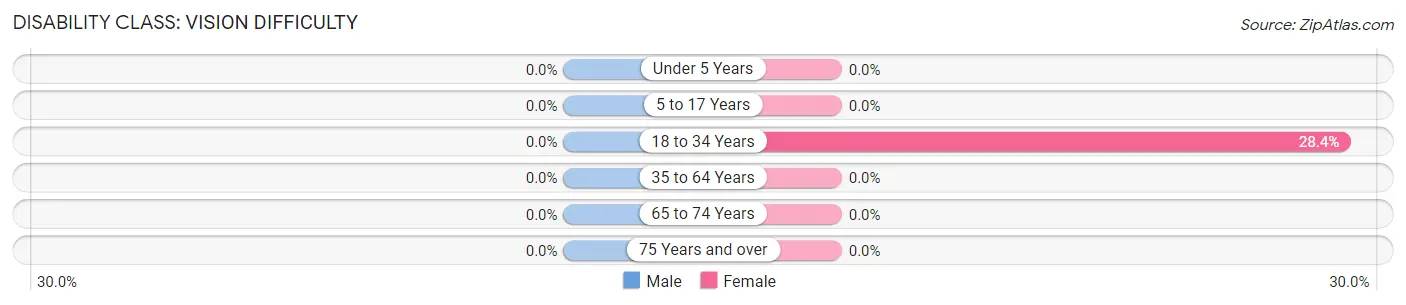
| Age Bracket | Male | Female |
| Under 5 Years | 0 (0.0%) | 0 (0.0%) |
| 5 to 17 Years | 0 (0.0%) | 0 (0.0%) |
| 18 to 34 Years | 0 (0.0%) | 19 (28.4%) |
| 35 to 64 Years | 0 (0.0%) | 0 (0.0%) |
| 65 to 74 Years | 0 (0.0%) | 0 (0.0%) |
| 75 Years and over | 0 (0.0%) | 0 (0.0%) |
Disability Class: Cognitive Difficulty
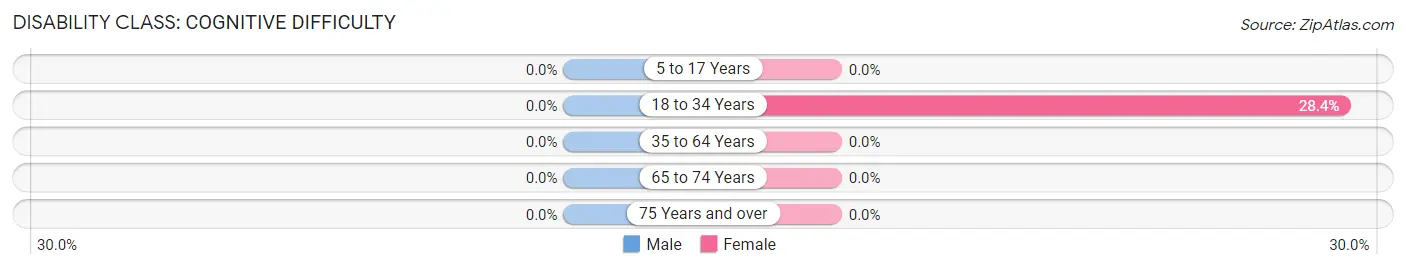
| Age Bracket | Male | Female |
| 5 to 17 Years | 0 (0.0%) | 0 (0.0%) |
| 18 to 34 Years | 0 (0.0%) | 19 (28.4%) |
| 35 to 64 Years | 0 (0.0%) | 0 (0.0%) |
| 65 to 74 Years | 0 (0.0%) | 0 (0.0%) |
| 75 Years and over | 0 (0.0%) | 0 (0.0%) |
Disability Class: Ambulatory Difficulty
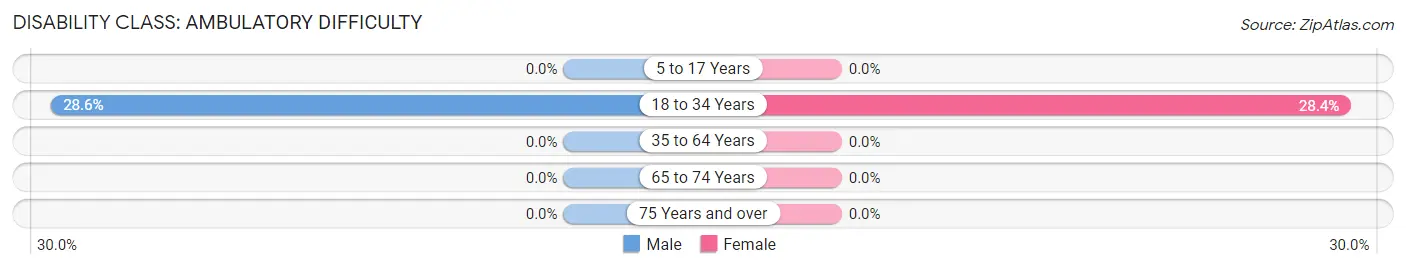
| Age Bracket | Male | Female |
| 5 to 17 Years | 0 (0.0%) | 0 (0.0%) |
| 18 to 34 Years | 16 (28.6%) | 19 (28.4%) |
| 35 to 64 Years | 0 (0.0%) | 0 (0.0%) |
| 65 to 74 Years | 0 (0.0%) | 0 (0.0%) |
| 75 Years and over | 0 (0.0%) | 0 (0.0%) |
Disability Class: Self-Care Difficulty
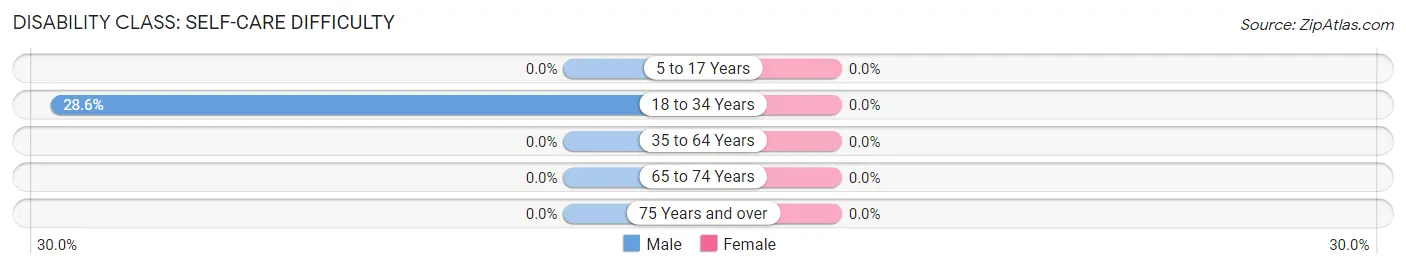
| Age Bracket | Male | Female |
| 5 to 17 Years | 0 (0.0%) | 0 (0.0%) |
| 18 to 34 Years | 16 (28.6%) | 0 (0.0%) |
| 35 to 64 Years | 0 (0.0%) | 0 (0.0%) |
| 65 to 74 Years | 0 (0.0%) | 0 (0.0%) |
| 75 Years and over | 0 (0.0%) | 0 (0.0%) |
Technology Access in Bear Creek
Computing Device Access in Bear Creek
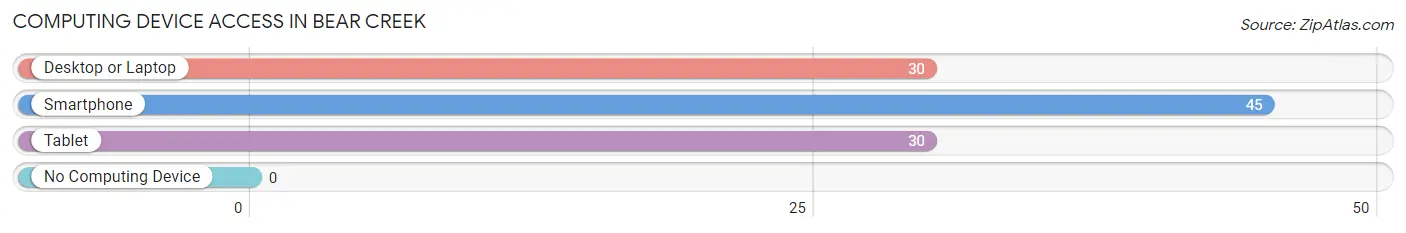
| Device Type | # Households | % Households |
| Desktop or Laptop | 30 | 66.7% |
| Smartphone | 45 | 100.0% |
| Tablet | 30 | 66.7% |
| No Computing Device | 0 | 0.0% |
| Total | 45 | 100.0% |
Internet Access in Bear Creek
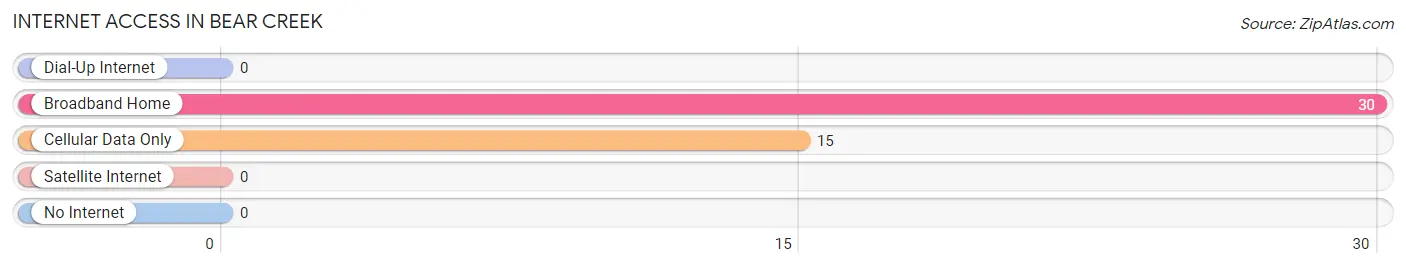
| Internet Type | # Households | % Households |
| Dial-Up Internet | 0 | 0.0% |
| Broadband Home | 30 | 66.7% |
| Cellular Data Only | 15 | 33.3% |
| Satellite Internet | 0 | 0.0% |
| No Internet | 0 | 0.0% |
| Total | 45 | 100.0% |
Bear Creek Summary
Introduction
Bear Creek is a small unincorporated community located in the foothills of the Sierra Nevada Mountains in El Dorado County, California. It is situated in the Sierra Nevada foothills, approximately 25 miles east of Placerville and 40 miles northeast of Sacramento. The community is located in a rural area and is surrounded by rolling hills, oak trees, and open space. The population of Bear Creek is estimated to be around 500 people.
History
The area that is now known as Bear Creek was originally inhabited by the Miwok and Maidu Native American tribes. The first European settlers arrived in the area in the early 1800s. The area was originally known as “Bear Valley” and was home to a number of small farms and ranches. In the late 1800s, the area was renamed “Bear Creek” after a nearby creek.
In the early 1900s, the area began to develop as a small rural community. The first post office was established in 1910 and the first school was built in 1912. The community continued to grow throughout the 20th century and by the 1950s, Bear Creek had become a popular destination for outdoor recreation.
Geography
Bear Creek is located in the foothills of the Sierra Nevada Mountains in El Dorado County, California. The community is situated in a rural area and is surrounded by rolling hills, oak trees, and open space. The area is known for its scenic beauty and is a popular destination for outdoor recreation.
The climate in Bear Creek is mild and temperate. The average temperature in the summer is around 75 degrees Fahrenheit and the average temperature in the winter is around 40 degrees Fahrenheit. The area receives an average of 20 inches of rain per year.
Economy
The economy of Bear Creek is largely based on agriculture and tourism. The area is home to a number of small farms and ranches that produce a variety of crops, including apples, pears, and walnuts. The area is also popular with tourists who come to enjoy the scenic beauty and outdoor recreation opportunities.
The community is also home to a number of small businesses, including restaurants, stores, and a post office. The area is served by a number of local roads and highways, including Highway 50 and Highway 49.
Demographics
The population of Bear Creek is estimated to be around 500 people. The majority of the population is white (90%) and the median household income is around $50,000. The area is served by a number of local schools, including Bear Creek Elementary School and Bear Creek High School.
Conclusion
Bear Creek is a small unincorporated community located in the foothills of the Sierra Nevada Mountains in El Dorado County, California. The area is known for its scenic beauty and is a popular destination for outdoor recreation. The economy of Bear Creek is largely based on agriculture and tourism and the population is estimated to be around 500 people.
Common Questions
What is Per Capita Income in Bear Creek?
Per Capita income in Bear Creek is $25,001.
What is Inequality or Gini Index in Bear Creek?
Inequality or Gini Index in Bear Creek is 0.31.
What is the Total Population of Bear Creek?
Total Population of Bear Creek is 251.
What is the Total Male Population of Bear Creek?
Total Male Population of Bear Creek is 102.
What is the Total Female Population of Bear Creek?
Total Female Population of Bear Creek is 149.
What is the Ratio of Males per 100 Females in Bear Creek?
There are 68.46 Males per 100 Females in Bear Creek.
What is the Ratio of Females per 100 Males in Bear Creek?
There are 146.08 Females per 100 Males in Bear Creek.
What is the Median Population Age in Bear Creek?
Median Population Age in Bear Creek is 32.3 Years.
What is the Average Family Size in Bear Creek
Average Family Size in Bear Creek is 5.6 People.
What is the Average Household Size in Bear Creek
Average Household Size in Bear Creek is 5.6 People.
How Large is the Labor Force in Bear Creek?
There are 72 People in the Labor Forcein in Bear Creek.
What is the Percentage of People in the Labor Force in Bear Creek?
37.7% of People are in the Labor Force in Bear Creek.