Seville, CA Map & Demographics
Seville Map
Seville Overview
$11,728
PER CAPITA INCOME
$44,844
AVG FAMILY INCOME
$39,500
AVG HOUSEHOLD INCOME
16.1%
WAGE / INCOME GAP [ % ]
83.9¢/ $1
WAGE / INCOME GAP [ $ ]
0.36
INEQUALITY / GINI INDEX
411
TOTAL POPULATION
204
MALE POPULATION
207
FEMALE POPULATION
98.55
MALES / 100 FEMALES
101.47
FEMALES / 100 MALES
21.1
MEDIAN AGE
5.2
AVG FAMILY SIZE
4.6
AVG HOUSEHOLD SIZE
144
LABOR FORCE [ PEOPLE ]
57.6%
PERCENT IN LABOR FORCE
13.9%
UNEMPLOYMENT RATE
Income in Seville
Income Overview in Seville
Per Capita Income in Seville is $11,728, while median incomes of families and households are $44,844 and $39,500 respectively.
| Characteristic | Number | Measure |
| Per Capita Income | 411 | $11,728 |
| Median Family Income | 73 | $44,844 |
| Mean Family Income | 73 | $51,962 |
| Median Household Income | 90 | $39,500 |
| Mean Household Income | 90 | $47,927 |
| Income Deficit | 73 | $0 |
| Wage / Income Gap (%) | 411 | 16.08% |
| Wage / Income Gap ($) | 411 | 83.92¢ per $1 |
| Gini / Inequality Index | 411 | 0.36 |
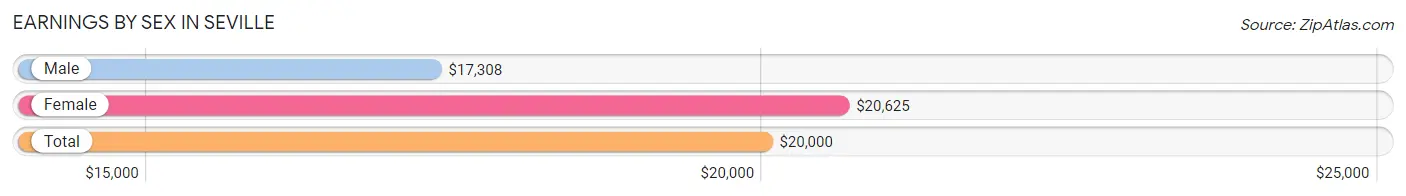
Earnings by Sex in Seville
Average Earnings in Seville are $20,000, $17,308 for men and $20,625 for women, a difference of 16.1%.
| Sex | Number | Average Earnings |
| Male | 92 (61.3%) | $17,308 |
| Female | 58 (38.7%) | $20,625 |
| Total | 150 (100.0%) | $20,000 |
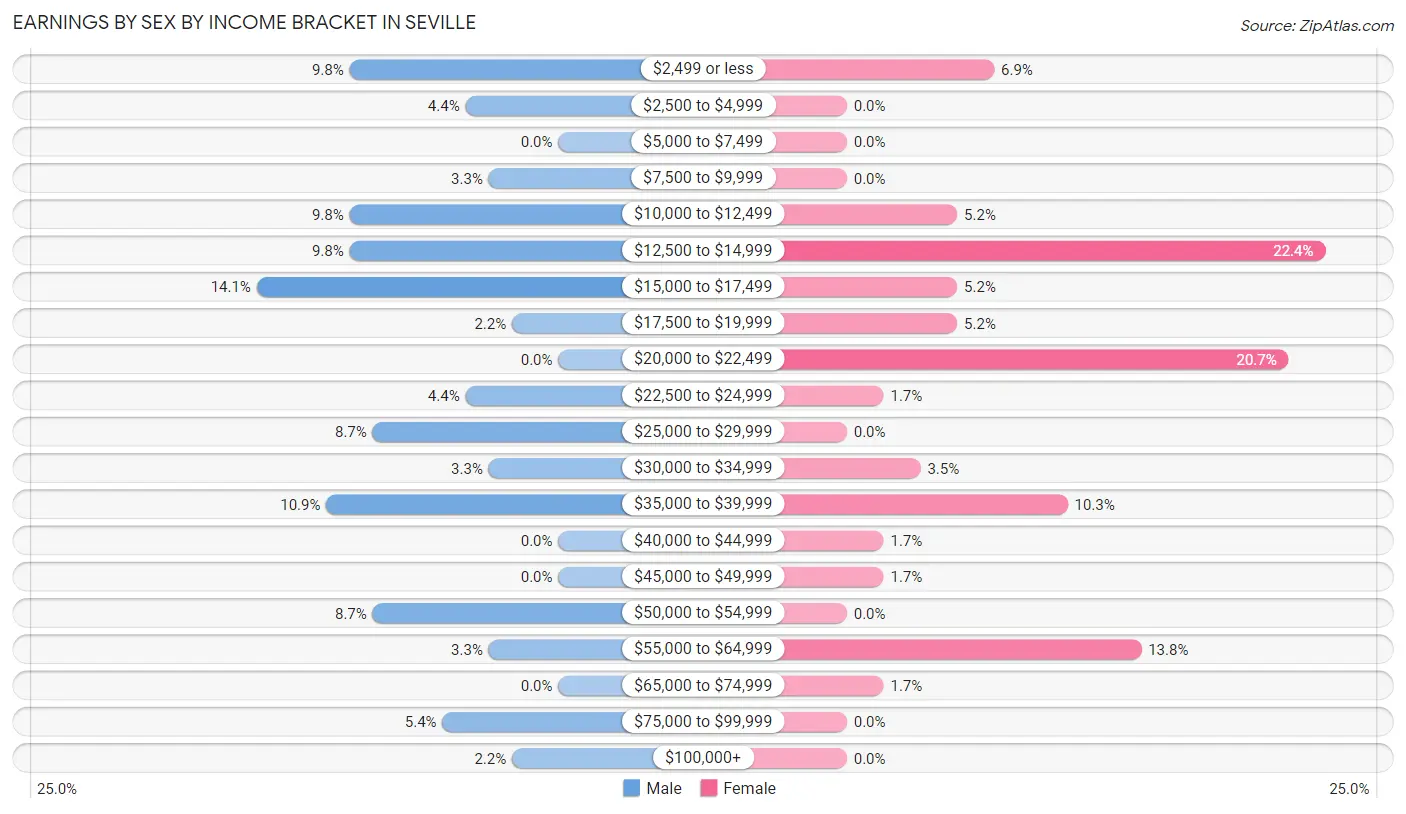
Earnings by Sex by Income Bracket in Seville
The most common earnings brackets in Seville are $15,000 to $17,499 for men (13 | 14.1%) and $12,500 to $14,999 for women (13 | 22.4%).
| Income | Male | Female |
| $2,499 or less | 9 (9.8%) | 4 (6.9%) |
| $2,500 to $4,999 | 4 (4.3%) | 0 (0.0%) |
| $5,000 to $7,499 | 0 (0.0%) | 0 (0.0%) |
| $7,500 to $9,999 | 3 (3.3%) | 0 (0.0%) |
| $10,000 to $12,499 | 9 (9.8%) | 3 (5.2%) |
| $12,500 to $14,999 | 9 (9.8%) | 13 (22.4%) |
| $15,000 to $17,499 | 13 (14.1%) | 3 (5.2%) |
| $17,500 to $19,999 | 2 (2.2%) | 3 (5.2%) |
| $20,000 to $22,499 | 0 (0.0%) | 12 (20.7%) |
| $22,500 to $24,999 | 4 (4.3%) | 1 (1.7%) |
| $25,000 to $29,999 | 8 (8.7%) | 0 (0.0%) |
| $30,000 to $34,999 | 3 (3.3%) | 2 (3.5%) |
| $35,000 to $39,999 | 10 (10.9%) | 6 (10.3%) |
| $40,000 to $44,999 | 0 (0.0%) | 1 (1.7%) |
| $45,000 to $49,999 | 0 (0.0%) | 1 (1.7%) |
| $50,000 to $54,999 | 8 (8.7%) | 0 (0.0%) |
| $55,000 to $64,999 | 3 (3.3%) | 8 (13.8%) |
| $65,000 to $74,999 | 0 (0.0%) | 1 (1.7%) |
| $75,000 to $99,999 | 5 (5.4%) | 0 (0.0%) |
| $100,000+ | 2 (2.2%) | 0 (0.0%) |
| Total | 92 (100.0%) | 58 (100.0%) |
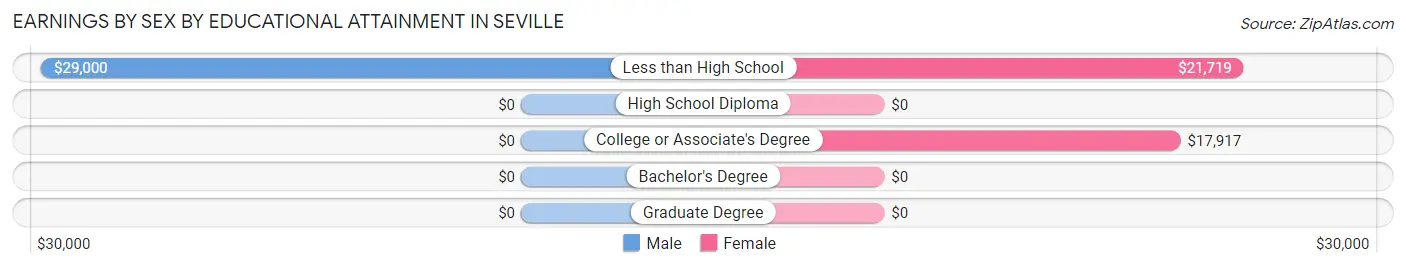
Earnings by Sex by Educational Attainment in Seville
Average earnings in Seville are $27,750 for men and $20,625 for women, a difference of 25.7%. Men with an educational attainment of less than high school enjoy the highest average annual earnings of $29,000, while those with less than high school education earn the least with $29,000. Women with an educational attainment of less than high school earn the most with the average annual earnings of $21,719, while those with college or associate's degree education have the smallest earnings of $17,917.
| Educational Attainment | Male Income | Female Income |
| Less than High School | $29,000 | $21,719 |
| High School Diploma | - | - |
| College or Associate's Degree | - | - |
| Bachelor's Degree | - | - |
| Graduate Degree | - | - |
| Total | $27,750 | $20,625 |
Family Income in Seville
Family Income Brackets in Seville
According to the Seville family income data, there are 16 families falling into the $50,000 to $74,999 income range, which is the most common income bracket and makes up 21.9% of all families.
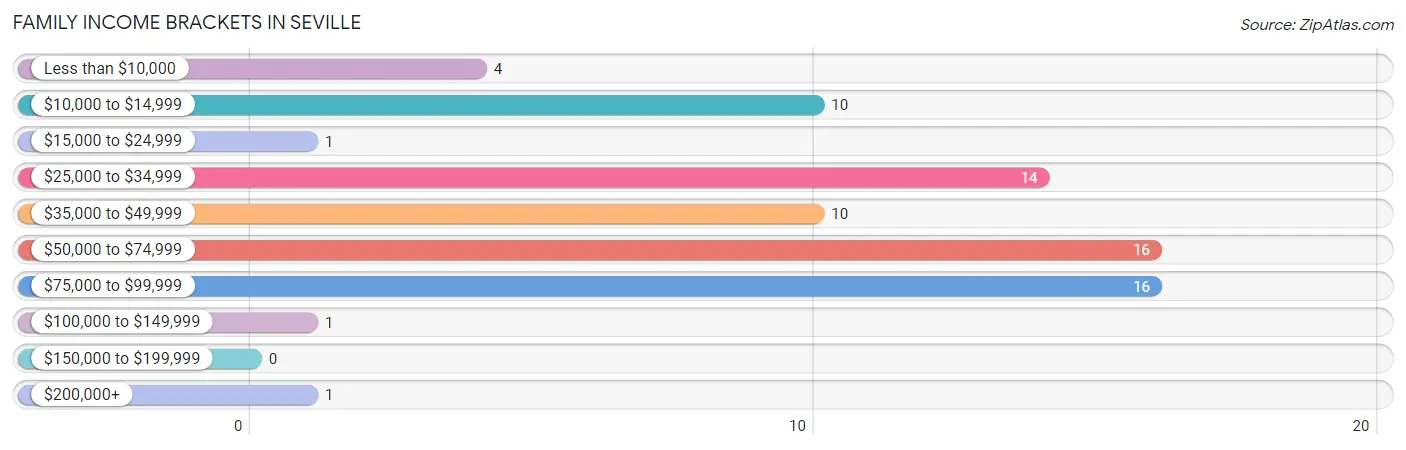
| Income Bracket | # Families | % Families |
| Less than $10,000 | 4 | 5.5% |
| $10,000 to $14,999 | 10 | 13.7% |
| $15,000 to $24,999 | 1 | 1.4% |
| $25,000 to $34,999 | 14 | 19.2% |
| $35,000 to $49,999 | 10 | 13.7% |
| $50,000 to $74,999 | 16 | 21.9% |
| $75,000 to $99,999 | 16 | 21.9% |
| $100,000 to $149,999 | 1 | 1.4% |
| $150,000 to $199,999 | 0 | 0.0% |
| $200,000+ | 1 | 1.4% |
Family Income by Famaliy Size in Seville
7+ person families (22 | 30.1%) account for the highest median family income in Seville with $61,250 per family, while 2-person families (20 | 27.4%) have the highest median income of $17,084 per family member.
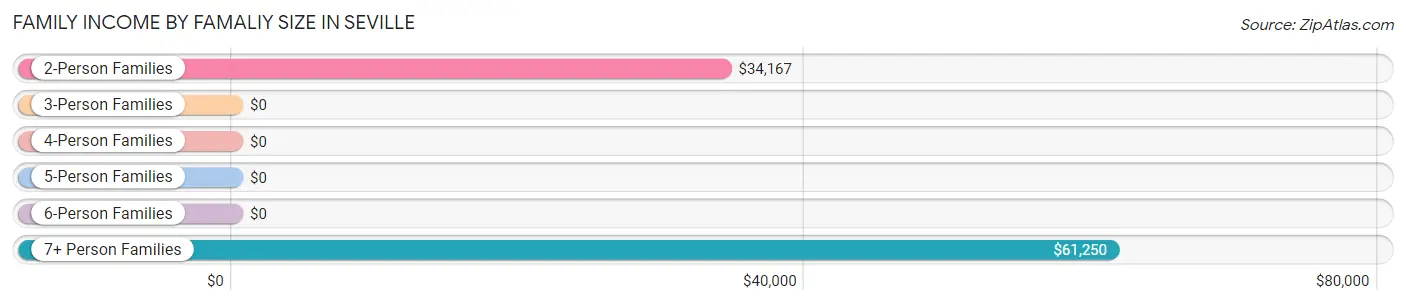
| Income Bracket | # Families | Median Income |
| 2-Person Families | 20 (27.4%) | $34,167 |
| 3-Person Families | 8 (11.0%) | $0 |
| 4-Person Families | 2 (2.7%) | $0 |
| 5-Person Families | 15 (20.5%) | $0 |
| 6-Person Families | 6 (8.2%) | $0 |
| 7+ Person Families | 22 (30.1%) | $61,250 |
| Total | 73 (100.0%) | $44,844 |
Family Income by Number of Earners in Seville
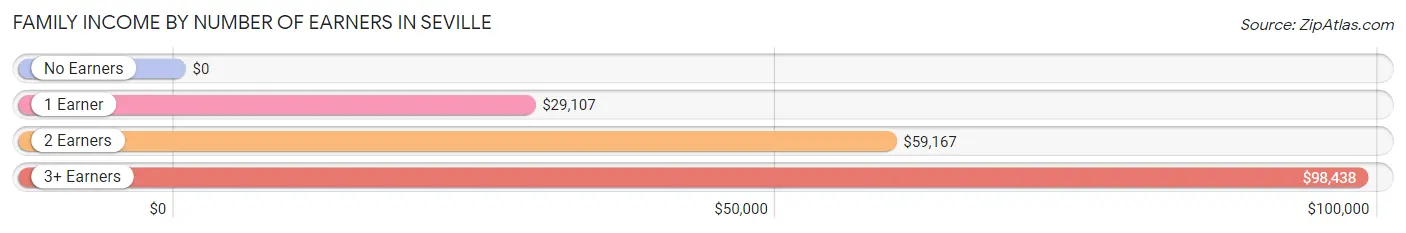
| Number of Earners | # Families | Median Income |
| No Earners | 2 (2.7%) | $0 |
| 1 Earner | 39 (53.4%) | $29,107 |
| 2 Earners | 20 (27.4%) | $59,167 |
| 3+ Earners | 12 (16.4%) | $98,438 |
| Total | 73 (100.0%) | $44,844 |
Household Income in Seville
Household Income Brackets in Seville
With 21 households falling in the category, the $25,000 to $34,999 income range is the most frequent in Seville, accounting for 23.3% of all households.
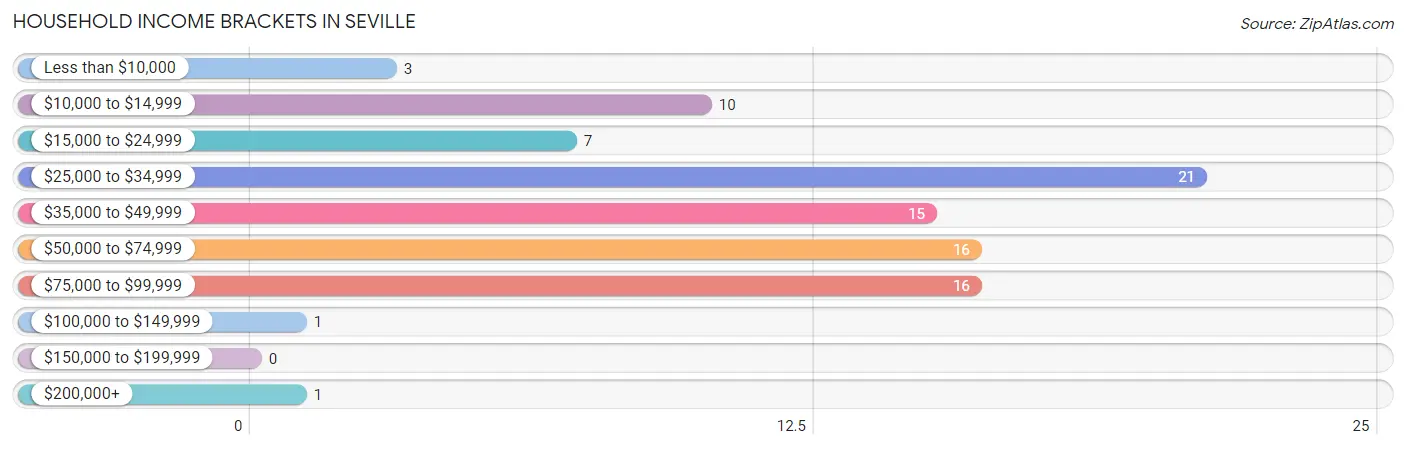
| Income Bracket | # Households | % Households |
| Less than $10,000 | 3 | 3.3% |
| $10,000 to $14,999 | 10 | 11.1% |
| $15,000 to $24,999 | 7 | 7.8% |
| $25,000 to $34,999 | 21 | 23.3% |
| $35,000 to $49,999 | 15 | 16.7% |
| $50,000 to $74,999 | 16 | 17.8% |
| $75,000 to $99,999 | 16 | 17.8% |
| $100,000 to $149,999 | 1 | 1.1% |
| $150,000 to $199,999 | 0 | 0.0% |
| $200,000+ | 1 | 1.1% |
Household Income by Householder Age in Seville
The median household income in Seville is $39,500, with the highest median household income of $43,281 found in the 45 to 64 years age bracket for the primary householder. A total of 43 households (47.8%) fall into this category. Meanwhile, the 15 to 24 years age bracket for the primary householder has the lowest median household income of $0, with 2 households (2.2%) in this group.
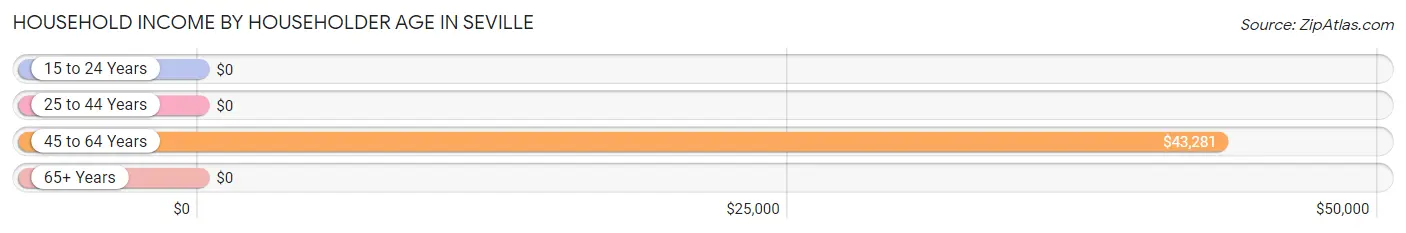
| Income Bracket | # Households | Median Income |
| 15 to 24 Years | 2 (2.2%) | $0 |
| 25 to 44 Years | 29 (32.2%) | $0 |
| 45 to 64 Years | 43 (47.8%) | $43,281 |
| 65+ Years | 16 (17.8%) | $0 |
| Total | 90 (100.0%) | $39,500 |
Poverty in Seville
Income Below Poverty by Sex and Age in Seville
With 18.1% poverty level for males and 30.4% for females among the residents of Seville, under 5 year old males and 18 to 24 year old females are the most vulnerable to poverty, with 4 males (57.1%) and 13 females (86.7%) in their respective age groups living below the poverty level.
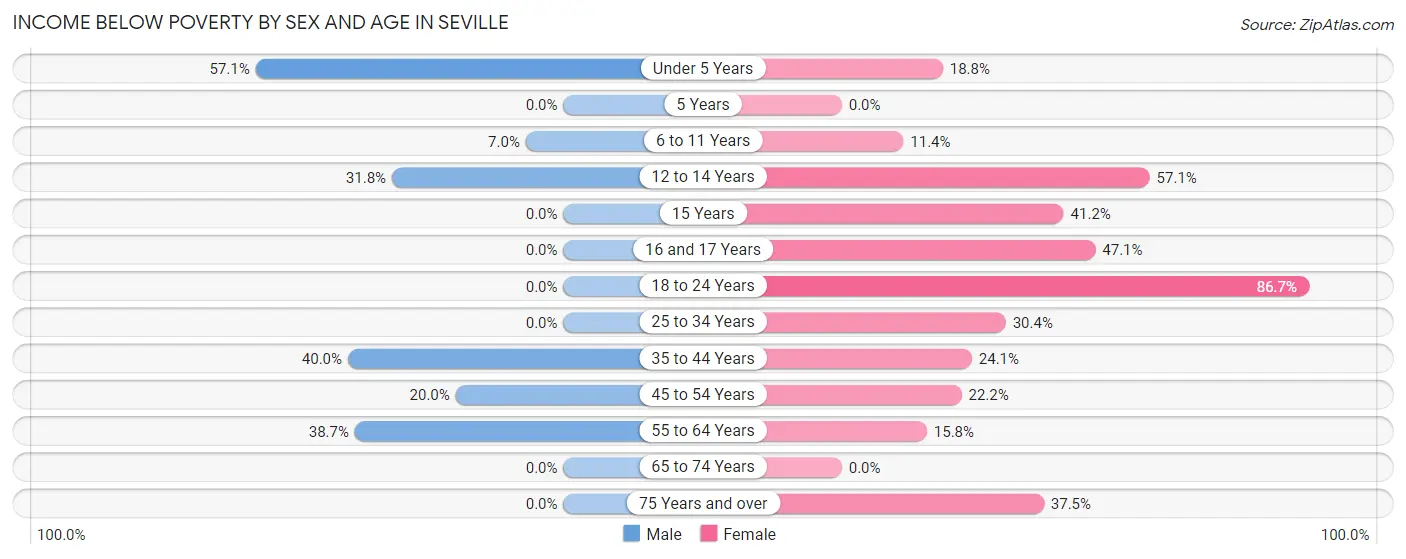
| Age Bracket | Male | Female |
| Under 5 Years | 4 (57.1%) | 3 (18.8%) |
| 5 Years | 0 (0.0%) | 0 (0.0%) |
| 6 to 11 Years | 3 (7.0%) | 4 (11.4%) |
| 12 to 14 Years | 7 (31.8%) | 4 (57.1%) |
| 15 Years | 0 (0.0%) | 7 (41.2%) |
| 16 and 17 Years | 0 (0.0%) | 8 (47.1%) |
| 18 to 24 Years | 0 (0.0%) | 13 (86.7%) |
| 25 to 34 Years | 0 (0.0%) | 7 (30.4%) |
| 35 to 44 Years | 8 (40.0%) | 7 (24.1%) |
| 45 to 54 Years | 3 (20.0%) | 4 (22.2%) |
| 55 to 64 Years | 12 (38.7%) | 3 (15.8%) |
| 65 to 74 Years | 0 (0.0%) | 0 (0.0%) |
| 75 Years and over | 0 (0.0%) | 3 (37.5%) |
| Total | 37 (18.1%) | 63 (30.4%) |
Income Above Poverty by Sex and Age in Seville
According to the poverty statistics in Seville, males aged 5 years and females aged 5 years are the age groups that are most secure financially, with 100.0% of males and 100.0% of females in these age groups living above the poverty line.
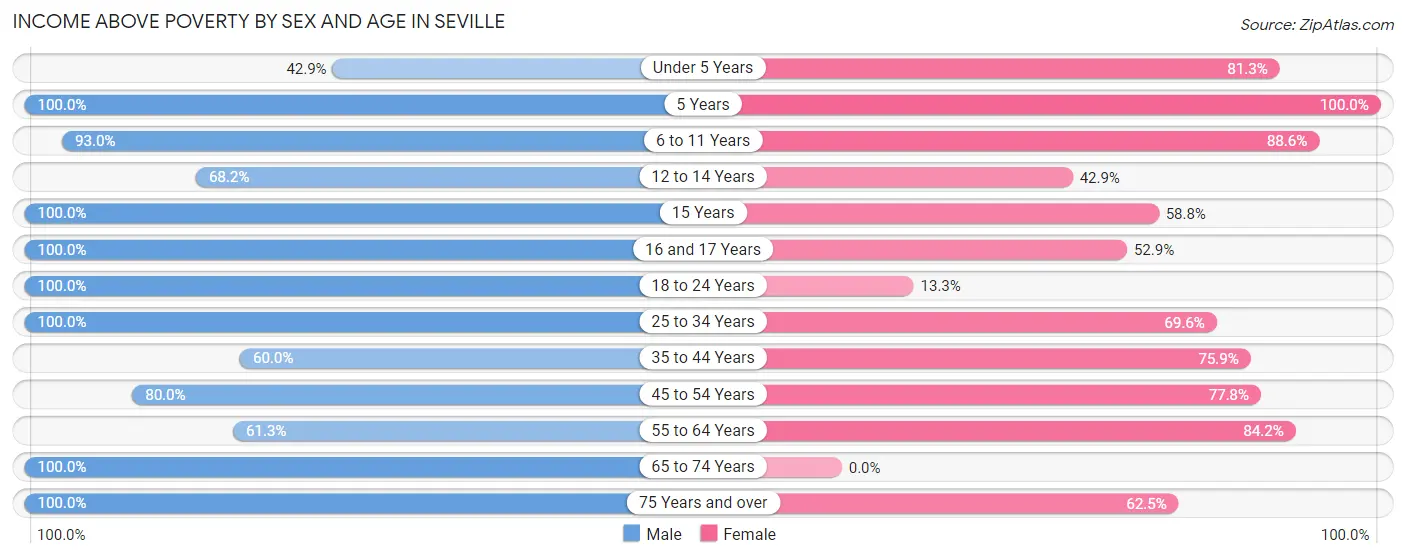
| Age Bracket | Male | Female |
| Under 5 Years | 3 (42.9%) | 13 (81.2%) |
| 5 Years | 7 (100.0%) | 3 (100.0%) |
| 6 to 11 Years | 40 (93.0%) | 31 (88.6%) |
| 12 to 14 Years | 15 (68.2%) | 3 (42.9%) |
| 15 Years | 4 (100.0%) | 10 (58.8%) |
| 16 and 17 Years | 9 (100.0%) | 9 (52.9%) |
| 18 to 24 Years | 15 (100.0%) | 2 (13.3%) |
| 25 to 34 Years | 20 (100.0%) | 16 (69.6%) |
| 35 to 44 Years | 12 (60.0%) | 22 (75.9%) |
| 45 to 54 Years | 12 (80.0%) | 14 (77.8%) |
| 55 to 64 Years | 19 (61.3%) | 16 (84.2%) |
| 65 to 74 Years | 5 (100.0%) | 0 (0.0%) |
| 75 Years and over | 6 (100.0%) | 5 (62.5%) |
| Total | 167 (81.9%) | 144 (69.6%) |
Income Below Poverty Among Married-Couple Families in Seville
The poverty statistics for married-couple families in Seville show that 15.6% or 5 of the total 32 families live below the poverty line. Families with no children have the highest poverty rate of 38.5%, comprising of 5 families. On the other hand, families with 3 or 4 children have the lowest poverty rate of 0.0%, which includes 0 families.
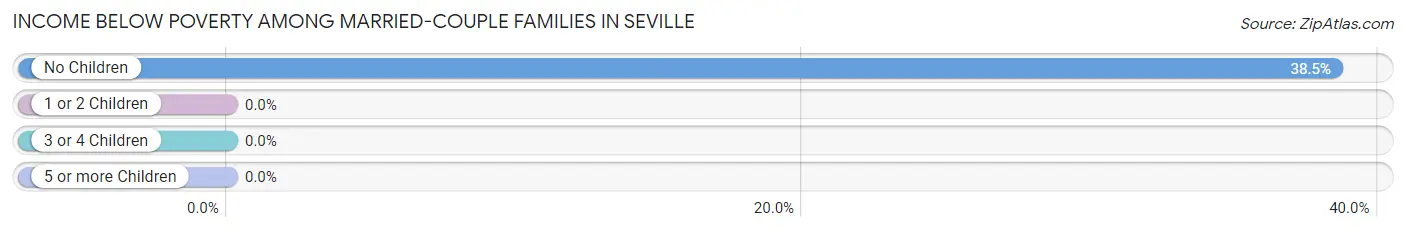
| Children | Above Poverty | Below Poverty |
| No Children | 8 (61.5%) | 5 (38.5%) |
| 1 or 2 Children | 0 (0.0%) | 0 (0.0%) |
| 3 or 4 Children | 14 (100.0%) | 0 (0.0%) |
| 5 or more Children | 5 (100.0%) | 0 (0.0%) |
| Total | 27 (84.4%) | 5 (15.6%) |
Income Below Poverty Among Single-Parent Households in Seville
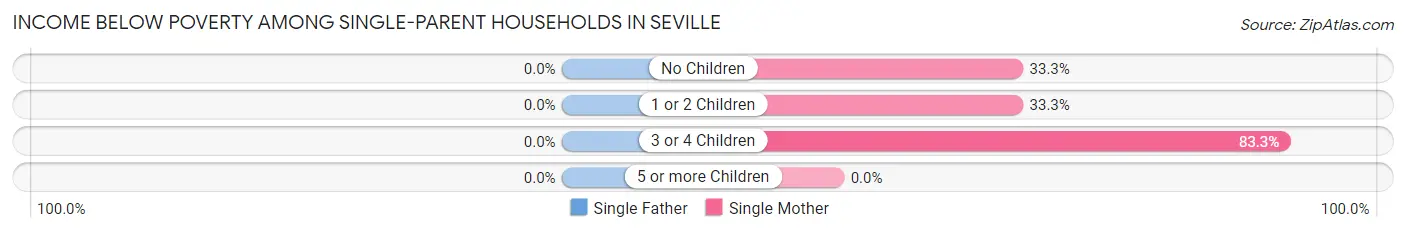
| Children | Single Father | Single Mother |
| No Children | 0 (0.0%) | 2 (33.3%) |
| 1 or 2 Children | 0 (0.0%) | 4 (33.3%) |
| 3 or 4 Children | 0 (0.0%) | 10 (83.3%) |
| 5 or more Children | 0 (0.0%) | 0 (0.0%) |
| Total | 0 (0.0%) | 16 (44.4%) |
Income Below Poverty Among Married-Couple vs Single-Parent Households in Seville
The poverty data for Seville shows that 5 of the married-couple family households (15.6%) and 16 of the single-parent households (39.0%) are living below the poverty level. Within the married-couple family households, those with no children have the highest poverty rate, with 5 households (38.5%) falling below the poverty line. Among the single-parent households, those with 3 or 4 children have the highest poverty rate, with 10 household (83.3%) living below poverty.
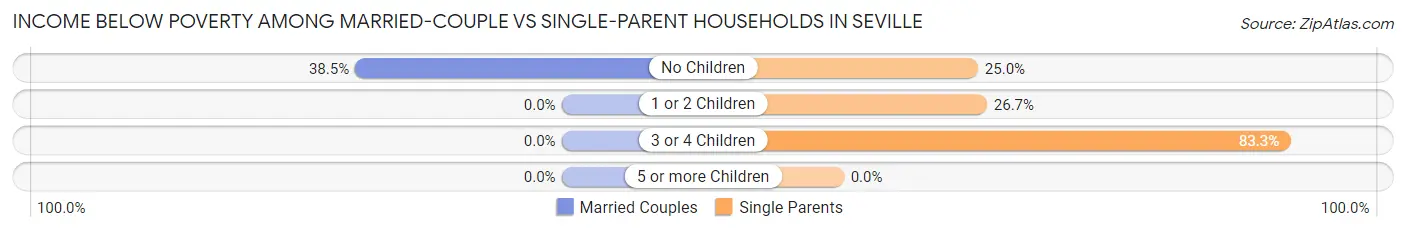
| Children | Married-Couple Families | Single-Parent Households |
| No Children | 5 (38.5%) | 2 (25.0%) |
| 1 or 2 Children | 0 (0.0%) | 4 (26.7%) |
| 3 or 4 Children | 0 (0.0%) | 10 (83.3%) |
| 5 or more Children | 0 (0.0%) | 0 (0.0%) |
| Total | 5 (15.6%) | 16 (39.0%) |
Race in Seville
The most populous races in Seville are Hispanic or Latino (390 | 94.9%), Some other Race (263 | 64.0%), and White / Caucasian (114 | 27.7%).
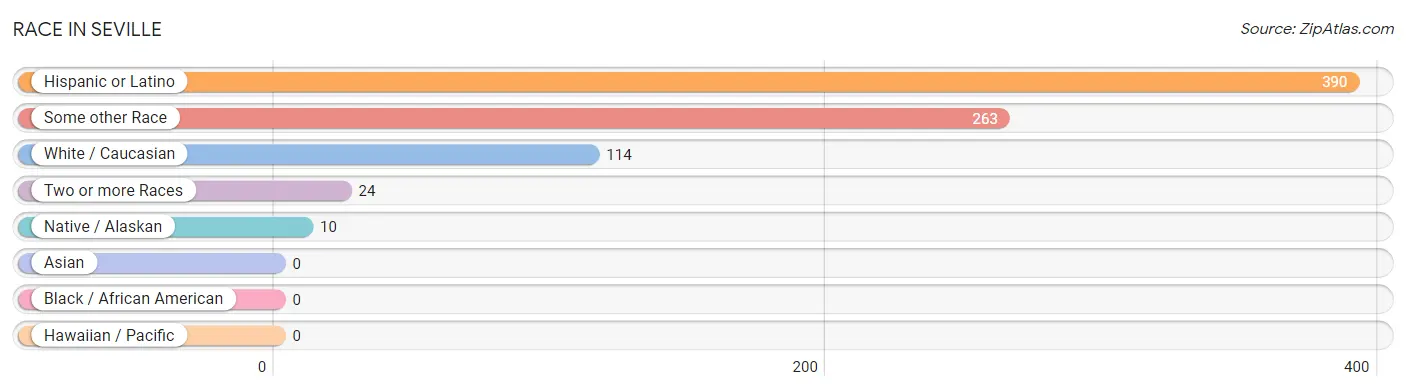
| Race | # Population | % Population |
| Asian | 0 | 0.0% |
| Black / African American | 0 | 0.0% |
| Hawaiian / Pacific | 0 | 0.0% |
| Hispanic or Latino | 390 | 94.9% |
| Native / Alaskan | 10 | 2.4% |
| White / Caucasian | 114 | 27.7% |
| Two or more Races | 24 | 5.8% |
| Some other Race | 263 | 64.0% |
| Total | 411 | 100.0% |
Ancestry in Seville
The most populous ancestries reported in Seville are Mexican (390 | 94.9%), and Mexican American Indian (7 | 1.7%), together accounting for 96.6% of all Seville residents.
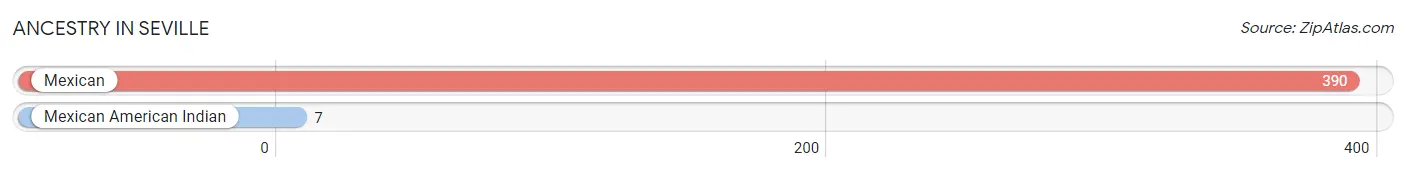
| Ancestry | # Population | % Population |
| Mexican | 390 | 94.9% |
| Mexican American Indian | 7 | 1.7% | View All 2 Rows |
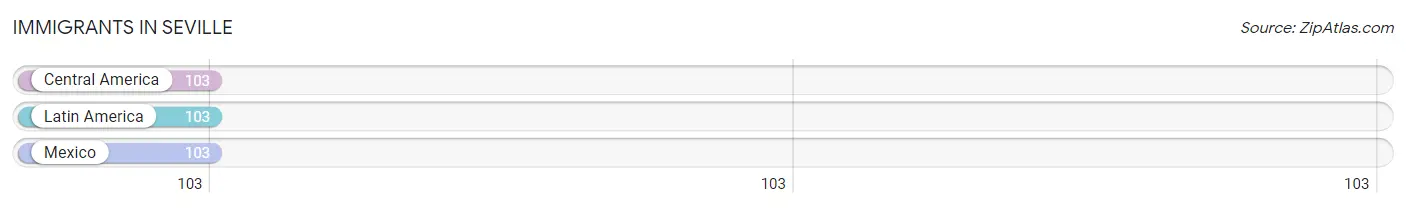
Immigrants in Seville
The most numerous immigrant groups reported in Seville came from Central America (103 | 25.1%), Latin America (103 | 25.1%), and Mexico (103 | 25.1%), together accounting for 75.2% of all Seville residents.
| Immigration Origin | # Population | % Population |
| Central America | 103 | 25.1% |
| Latin America | 103 | 25.1% |
| Mexico | 103 | 25.1% | View All 3 Rows |
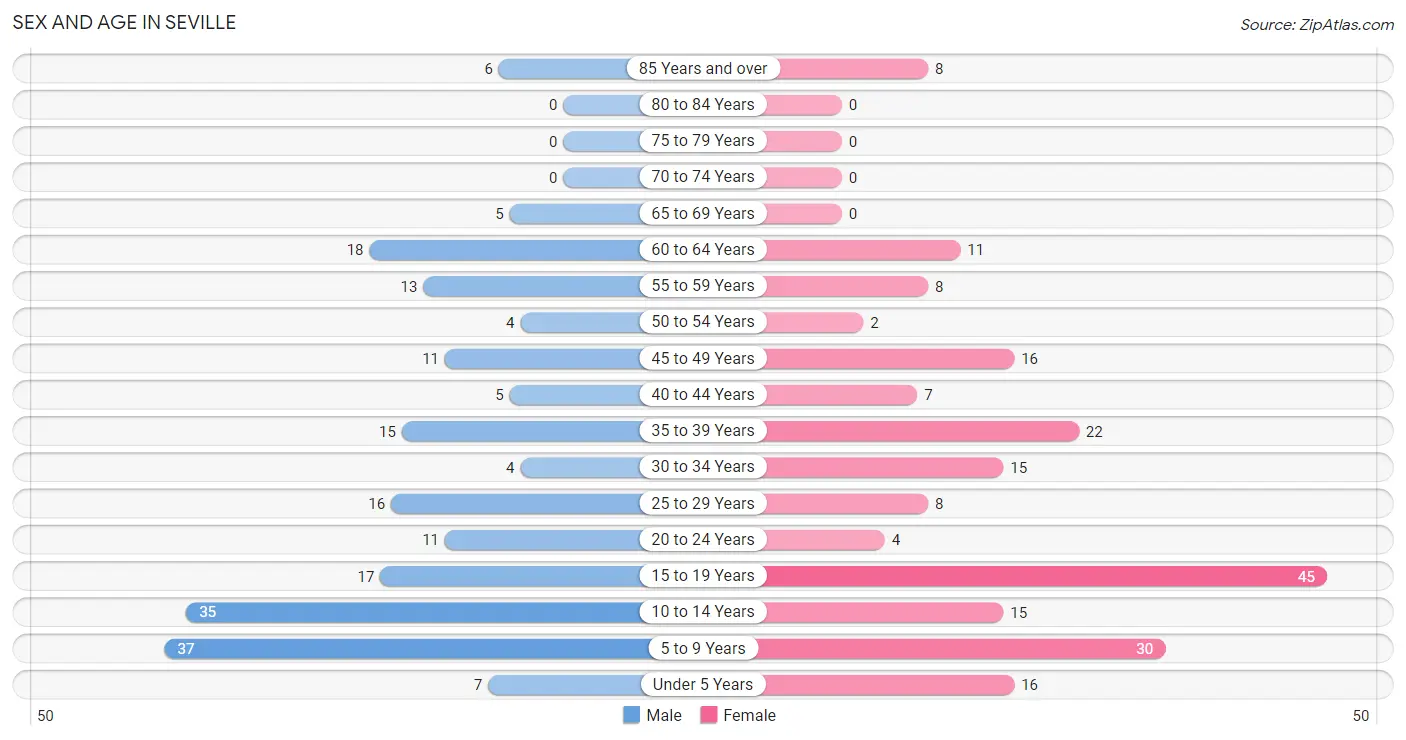
Sex and Age in Seville
Sex and Age in Seville
The most populous age groups in Seville are 5 to 9 Years (37 | 18.1%) for men and 15 to 19 Years (45 | 21.7%) for women.
| Age Bracket | Male | Female |
| Under 5 Years | 7 (3.4%) | 16 (7.7%) |
| 5 to 9 Years | 37 (18.1%) | 30 (14.5%) |
| 10 to 14 Years | 35 (17.2%) | 15 (7.2%) |
| 15 to 19 Years | 17 (8.3%) | 45 (21.7%) |
| 20 to 24 Years | 11 (5.4%) | 4 (1.9%) |
| 25 to 29 Years | 16 (7.8%) | 8 (3.9%) |
| 30 to 34 Years | 4 (2.0%) | 15 (7.2%) |
| 35 to 39 Years | 15 (7.3%) | 22 (10.6%) |
| 40 to 44 Years | 5 (2.5%) | 7 (3.4%) |
| 45 to 49 Years | 11 (5.4%) | 16 (7.7%) |
| 50 to 54 Years | 4 (2.0%) | 2 (1.0%) |
| 55 to 59 Years | 13 (6.4%) | 8 (3.9%) |
| 60 to 64 Years | 18 (8.8%) | 11 (5.3%) |
| 65 to 69 Years | 5 (2.5%) | 0 (0.0%) |
| 70 to 74 Years | 0 (0.0%) | 0 (0.0%) |
| 75 to 79 Years | 0 (0.0%) | 0 (0.0%) |
| 80 to 84 Years | 0 (0.0%) | 0 (0.0%) |
| 85 Years and over | 6 (2.9%) | 8 (3.9%) |
| Total | 204 (100.0%) | 207 (100.0%) |
Families and Households in Seville
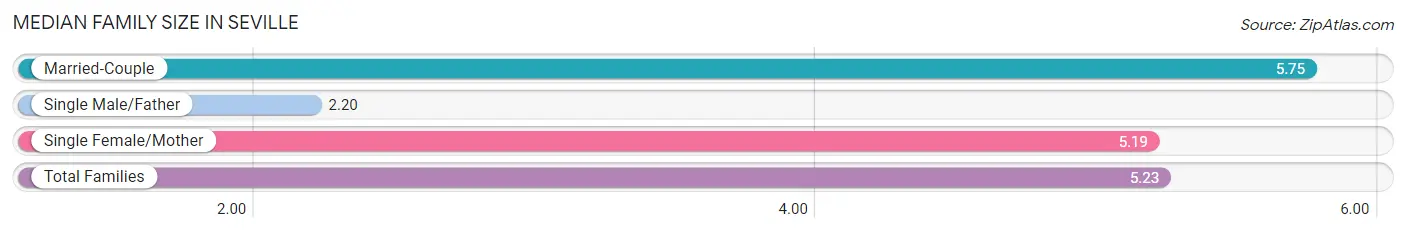
Median Family Size in Seville
The median family size in Seville is 5.23 persons per family, with married-couple families (32 | 43.8%) accounting for the largest median family size of 5.75 persons per family. On the other hand, single male/father families (5 | 6.9%) represent the smallest median family size with 2.20 persons per family.
| Family Type | # Families | Family Size |
| Married-Couple | 32 (43.8%) | 5.75 |
| Single Male/Father | 5 (6.9%) | 2.20 |
| Single Female/Mother | 36 (49.3%) | 5.19 |
| Total Families | 73 (100.0%) | 5.23 |
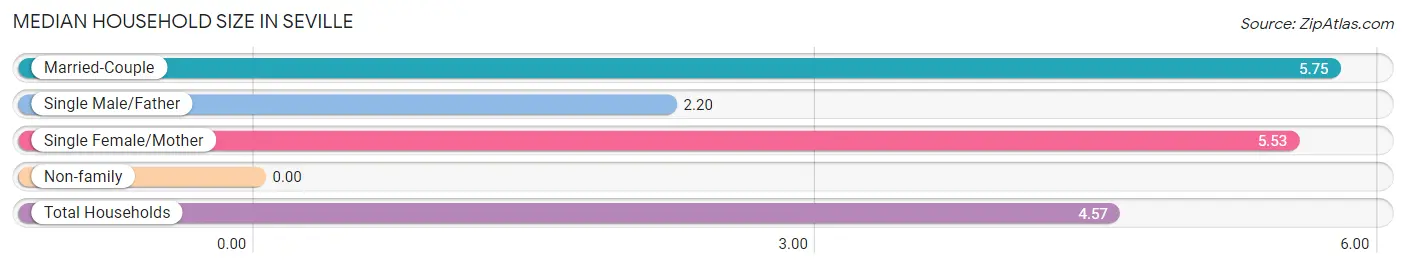
Median Household Size in Seville
| Household Type | # Households | Household Size |
| Married-Couple | 32 (35.6%) | 5.75 |
| Single Male/Father | 5 (5.6%) | 2.20 |
| Single Female/Mother | 36 (40.0%) | 5.53 |
| Non-family | 17 (18.9%) | - |
| Total Households | 90 (100.0%) | 4.57 |
Household Size by Marriage Status in Seville
Out of a total of 90 households in Seville, 73 (81.1%) are family households, while 17 (18.9%) are nonfamily households. The most numerous type of family households are 7+ person households, comprising 25, and the most common type of nonfamily households are 1-person households, comprising 17.
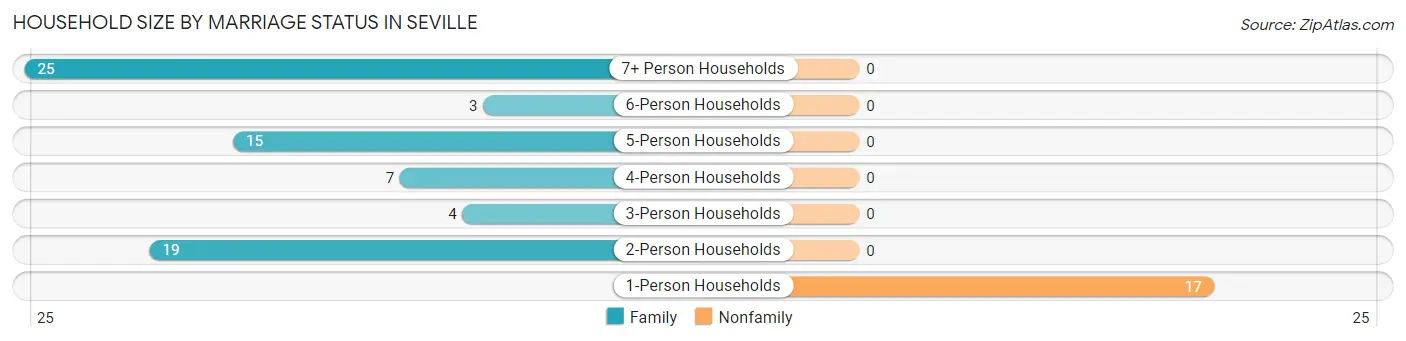
| Household Size | Family Households | Nonfamily Households |
| 1-Person Households | - | 17 (18.9%) |
| 2-Person Households | 19 (21.1%) | 0 (0.0%) |
| 3-Person Households | 4 (4.4%) | 0 (0.0%) |
| 4-Person Households | 7 (7.8%) | 0 (0.0%) |
| 5-Person Households | 15 (16.7%) | 0 (0.0%) |
| 6-Person Households | 3 (3.3%) | 0 (0.0%) |
| 7+ Person Households | 25 (27.8%) | 0 (0.0%) |
| Total | 73 (81.1%) | 17 (18.9%) |
Female Fertility in Seville
Fertility by Age in Seville
Average fertility rate in Seville is 42.0 births per 1,000 women. Women in the age bracket of 20 to 34 years have the highest fertility rate with 185.0 births per 1,000 women. Women in the age bracket of 20 to 34 years acount for 100.0% of all women with births.

| Age Bracket | Women with Births | Births / 1,000 Women |
| 15 to 19 years | 0 (0.0%) | 0.0 |
| 20 to 34 years | 5 (100.0%) | 185.0 |
| 35 to 50 years | 0 (0.0%) | 0.0 |
| Total | 5 (100.0%) | 42.0 |
Fertility by Age by Marriage Status in Seville
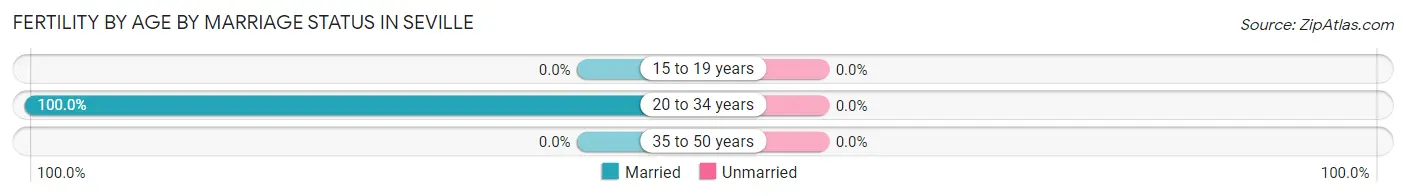
| Age Bracket | Married | Unmarried |
| 15 to 19 years | 0 (0.0%) | 0 (0.0%) |
| 20 to 34 years | 5 (100.0%) | 0 (0.0%) |
| 35 to 50 years | 0 (0.0%) | 0 (0.0%) |
| Total | 5 (100.0%) | 0 (0.0%) |
Fertility by Education in Seville
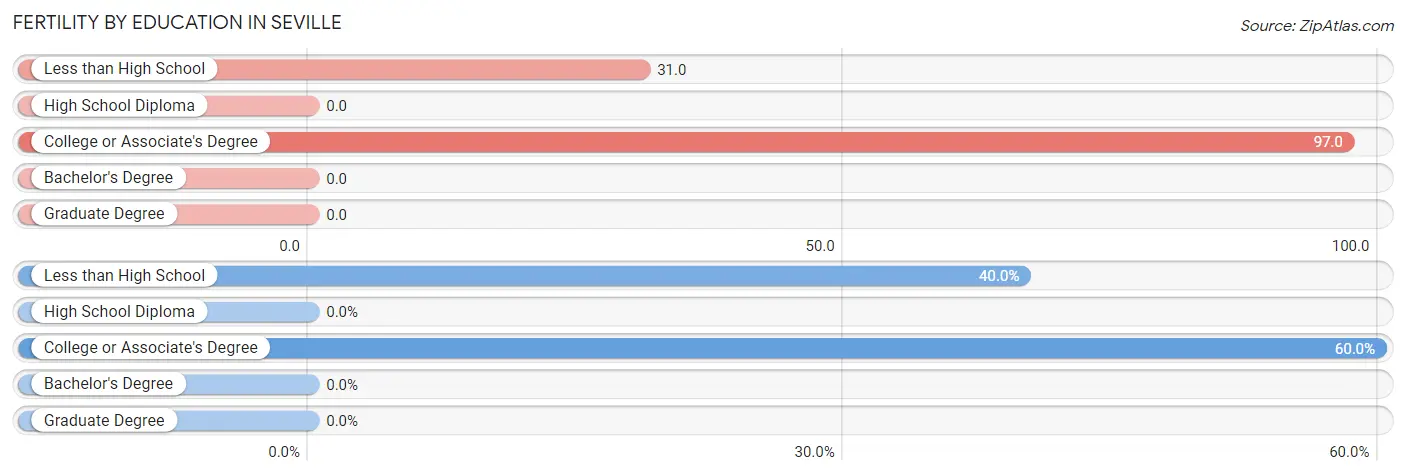
| Educational Attainment | Women with Births | Births / 1,000 Women |
| Less than High School | 2 (40.0%) | 31.0 |
| High School Diploma | 0 (0.0%) | 0.0 |
| College or Associate's Degree | 3 (60.0%) | 97.0 |
| Bachelor's Degree | 0 (0.0%) | 0.0 |
| Graduate Degree | 0 (0.0%) | 0.0 |
| Total | 5 (100.0%) | 42.0 |
Fertility by Education by Marriage Status in Seville
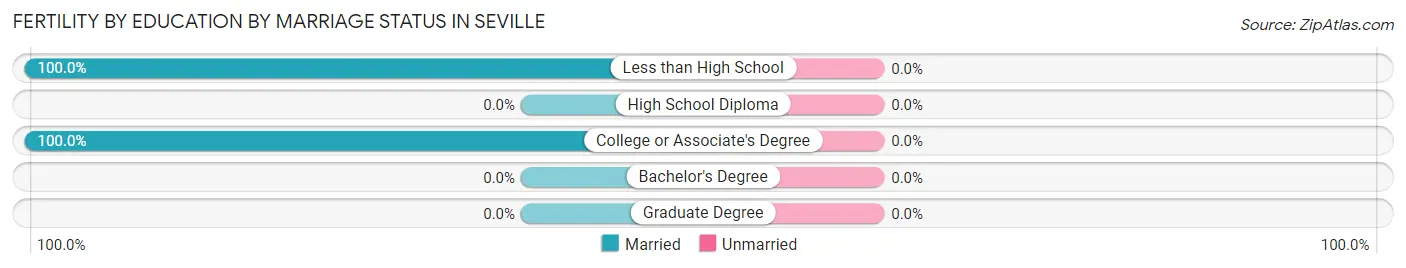
| Educational Attainment | Married | Unmarried |
| Less than High School | 2 (100.0%) | 0 (0.0%) |
| High School Diploma | 0 (0.0%) | 0 (0.0%) |
| College or Associate's Degree | 3 (100.0%) | 0 (0.0%) |
| Bachelor's Degree | 0 (0.0%) | 0 (0.0%) |
| Graduate Degree | 0 (0.0%) | 0 (0.0%) |
| Total | 5 (100.0%) | 0 (0.0%) |
Employment Characteristics in Seville
Employment by Class of Employer in Seville
Among the 124 employed individuals in Seville, private company employees (83 | 66.9%), not-for-profit organizations (27 | 21.8%), and local government employees (8 | 6.5%) make up the most common classes of employment.
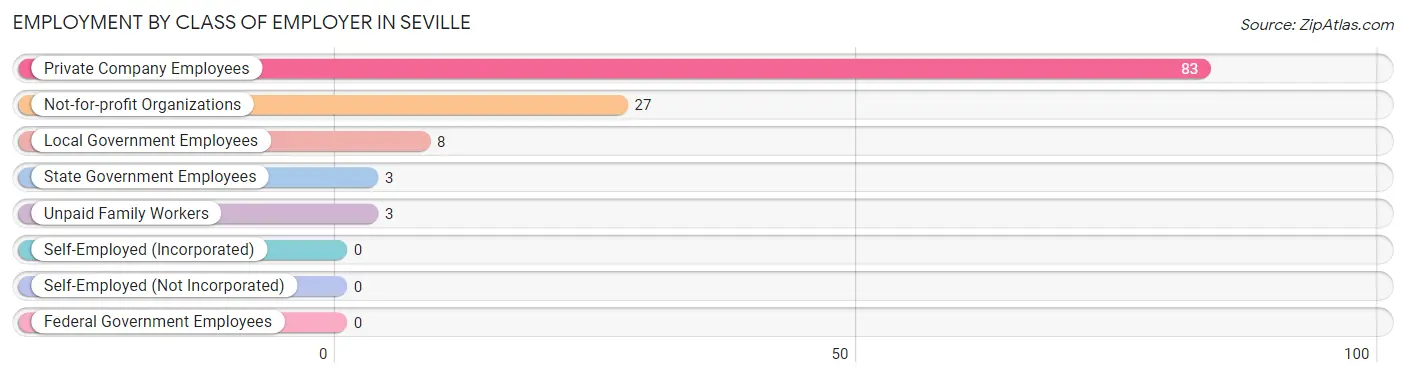
| Employer Class | # Employees | % Employees |
| Private Company Employees | 83 | 66.9% |
| Self-Employed (Incorporated) | 0 | 0.0% |
| Self-Employed (Not Incorporated) | 0 | 0.0% |
| Not-for-profit Organizations | 27 | 21.8% |
| Local Government Employees | 8 | 6.5% |
| State Government Employees | 3 | 2.4% |
| Federal Government Employees | 0 | 0.0% |
| Unpaid Family Workers | 3 | 2.4% |
| Total | 124 | 100.0% |
Employment Status by Age in Seville
According to the labor force statistics for Seville, out of the total population over 16 years of age (250), 57.6% or 144 individuals are in the labor force, with 13.9% or 20 of them unemployed. The age group with the highest labor force participation rate is 25 to 29 years, with 91.7% or 22 individuals in the labor force. Within the labor force, the 16 to 19 years age range has the highest percentage of unemployed individuals, with 100.0% or 4 of them being unemployed.
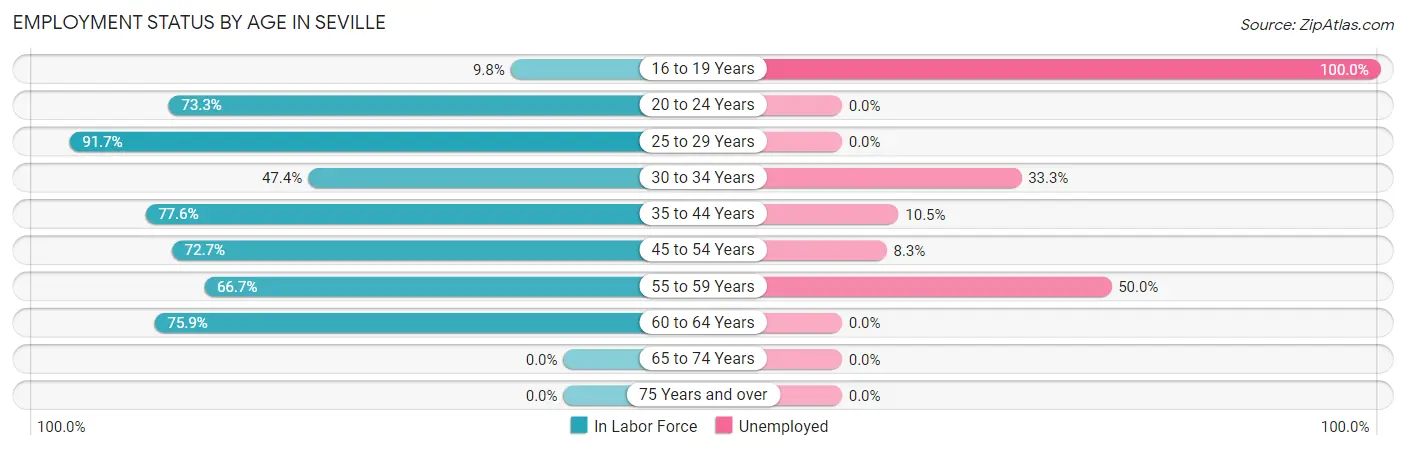
| Age Bracket | In Labor Force | Unemployed |
| 16 to 19 Years | 4 (9.8%) | 4 (100.0%) |
| 20 to 24 Years | 11 (73.3%) | 0 (0.0%) |
| 25 to 29 Years | 22 (91.7%) | 0 (0.0%) |
| 30 to 34 Years | 9 (47.4%) | 3 (33.3%) |
| 35 to 44 Years | 38 (77.6%) | 4 (10.5%) |
| 45 to 54 Years | 24 (72.7%) | 2 (8.3%) |
| 55 to 59 Years | 14 (66.7%) | 7 (50.0%) |
| 60 to 64 Years | 22 (75.9%) | 0 (0.0%) |
| 65 to 74 Years | 0 (0.0%) | 0 (0.0%) |
| 75 Years and over | 0 (0.0%) | 0 (0.0%) |
| Total | 144 (57.6%) | 20 (13.9%) |
Employment Status by Educational Attainment in Seville
According to labor force statistics for Seville, 73.7% of individuals (129) out of the total population between 25 and 64 years of age (175) are in the labor force, with 12.4% or 16 of them being unemployed. The group with the highest labor force participation rate are those with the educational attainment of bachelor's degree or higher, with 100.0% or 6 individuals in the labor force. Within the labor force, individuals with college / associate degree education have the highest percentage of unemployment, with 18.5% or 5 of them being unemployed.
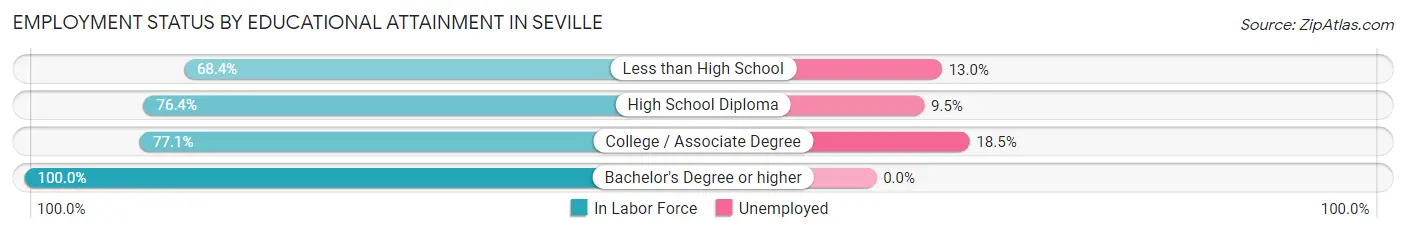
| Educational Attainment | In Labor Force | Unemployed |
| Less than High School | 54 (68.4%) | 10 (13.0%) |
| High School Diploma | 42 (76.4%) | 5 (9.5%) |
| College / Associate Degree | 27 (77.1%) | 6 (18.5%) |
| Bachelor's Degree or higher | 6 (100.0%) | 0 (0.0%) |
| Total | 129 (73.7%) | 22 (12.4%) |
Employment Occupations by Sex in Seville
Management, Business, Science and Arts Occupations
The most common Management, Business, Science and Arts occupations in Seville are Community & Social Service (7 | 5.7%), Education Instruction & Library (5 | 4.0%), Management (2 | 1.6%), and Education, Arts & Media (2 | 1.6%).
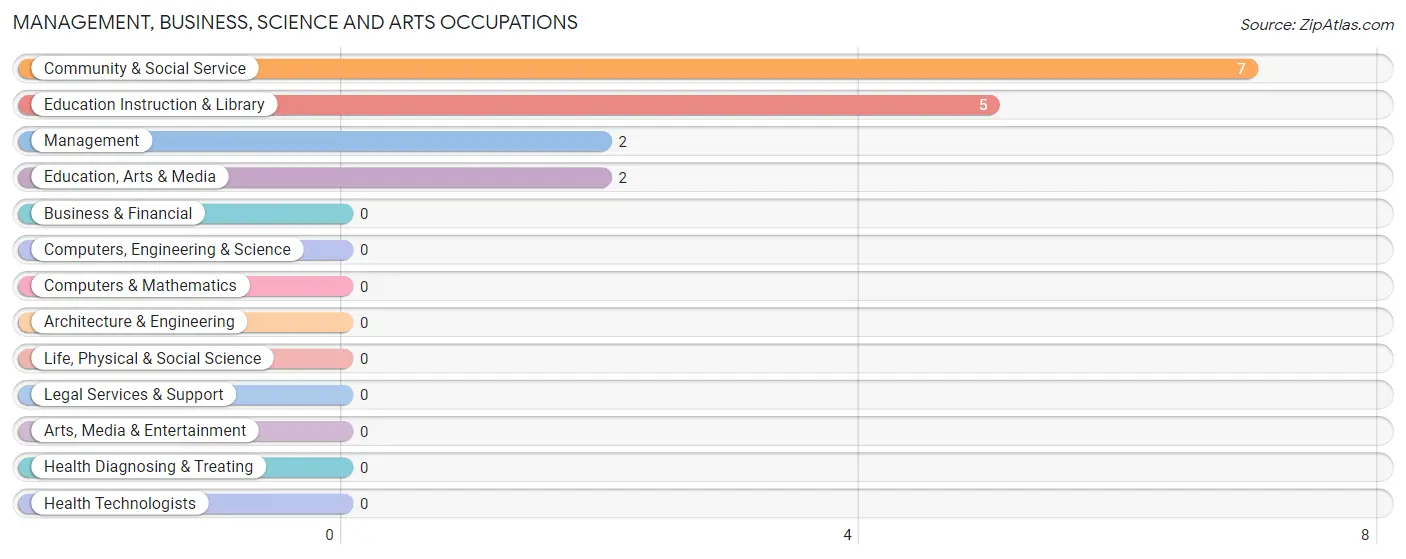
Management, Business, Science and Arts Occupations by Sex
Within the Management, Business, Science and Arts occupations in Seville, the most male-oriented occupations are Management (100.0%), Education Instruction & Library (80.0%), and Community & Social Service (57.1%), while the most female-oriented occupations are Education, Arts & Media (100.0%), Community & Social Service (42.9%), and Education Instruction & Library (20.0%).
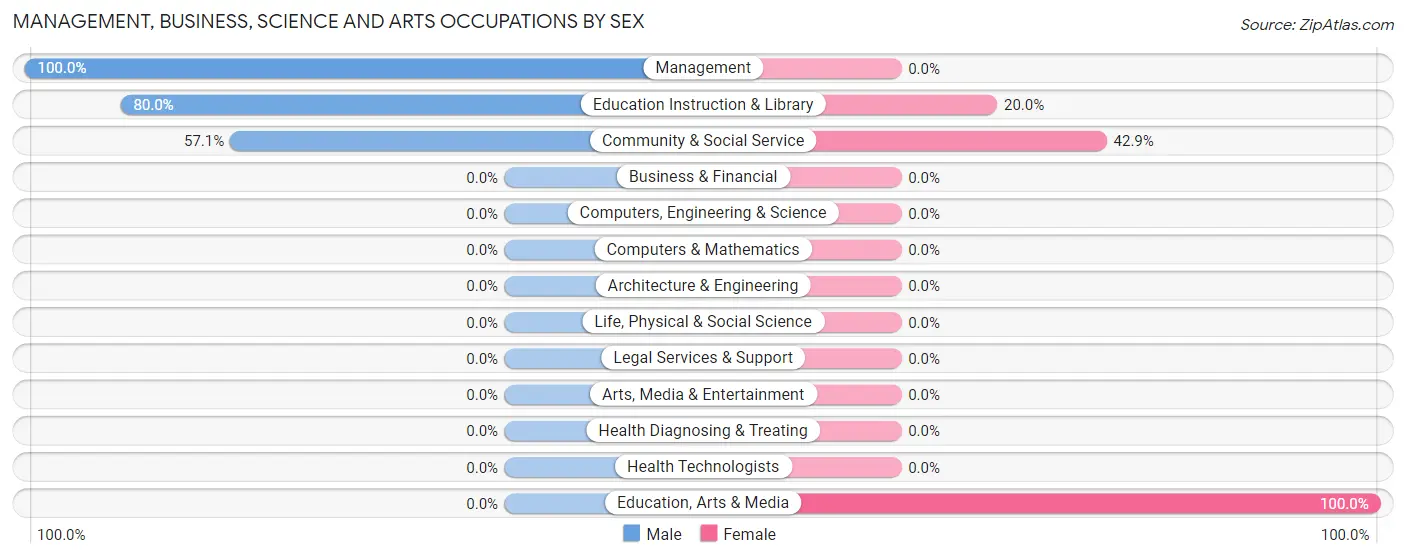
| Occupation | Male | Female |
| Management | 2 (100.0%) | 0 (0.0%) |
| Business & Financial | 0 (0.0%) | 0 (0.0%) |
| Computers, Engineering & Science | 0 (0.0%) | 0 (0.0%) |
| Computers & Mathematics | 0 (0.0%) | 0 (0.0%) |
| Architecture & Engineering | 0 (0.0%) | 0 (0.0%) |
| Life, Physical & Social Science | 0 (0.0%) | 0 (0.0%) |
| Community & Social Service | 4 (57.1%) | 3 (42.9%) |
| Education, Arts & Media | 0 (0.0%) | 2 (100.0%) |
| Legal Services & Support | 0 (0.0%) | 0 (0.0%) |
| Education Instruction & Library | 4 (80.0%) | 1 (20.0%) |
| Arts, Media & Entertainment | 0 (0.0%) | 0 (0.0%) |
| Health Diagnosing & Treating | 0 (0.0%) | 0 (0.0%) |
| Health Technologists | 0 (0.0%) | 0 (0.0%) |
| Total (Category) | 6 (66.7%) | 3 (33.3%) |
| Total (Overall) | 70 (56.5%) | 54 (43.5%) |
Services Occupations
The most common Services occupations in Seville are Healthcare Support (16 | 12.9%), Security & Protection (4 | 3.2%), Firefighting & Prevention (4 | 3.2%), and Cleaning & Maintenance (3 | 2.4%).
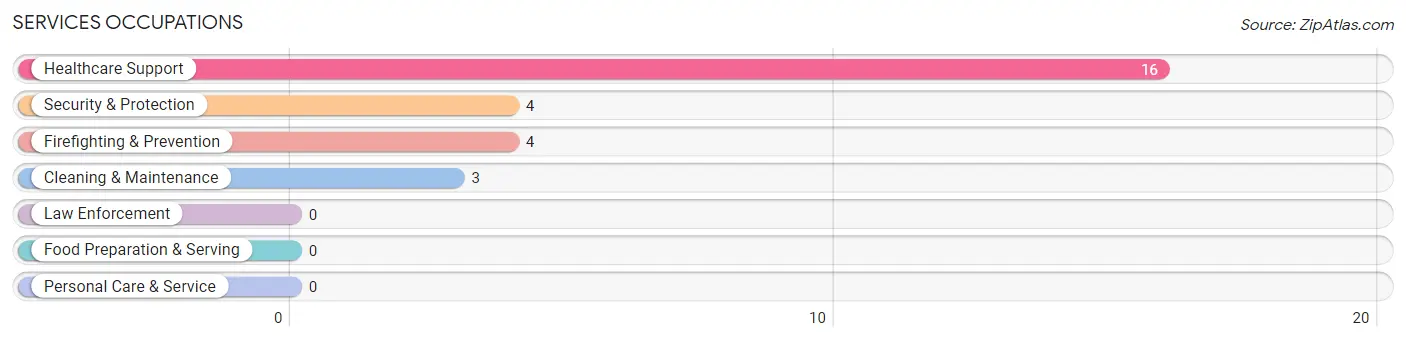
Services Occupations by Sex
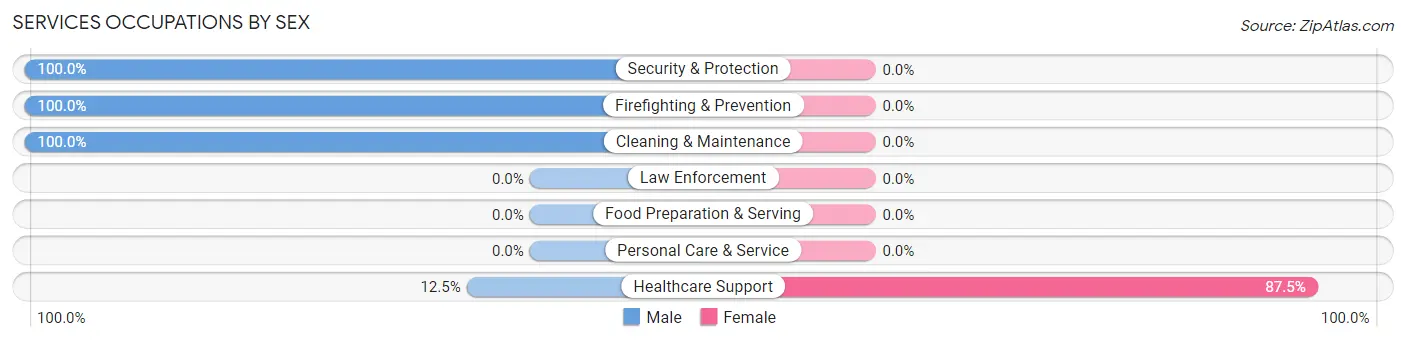
| Occupation | Male | Female |
| Healthcare Support | 2 (12.5%) | 14 (87.5%) |
| Security & Protection | 4 (100.0%) | 0 (0.0%) |
| Firefighting & Prevention | 4 (100.0%) | 0 (0.0%) |
| Law Enforcement | 0 (0.0%) | 0 (0.0%) |
| Food Preparation & Serving | 0 (0.0%) | 0 (0.0%) |
| Cleaning & Maintenance | 3 (100.0%) | 0 (0.0%) |
| Personal Care & Service | 0 (0.0%) | 0 (0.0%) |
| Total (Category) | 9 (39.1%) | 14 (60.9%) |
| Total (Overall) | 70 (56.5%) | 54 (43.5%) |
Sales and Office Occupations
The most common Sales and Office occupations in Seville are Sales & Related (11 | 8.9%), and Office & Administration (8 | 6.5%).

Sales and Office Occupations by Sex

| Occupation | Male | Female |
| Sales & Related | 4 (36.4%) | 7 (63.6%) |
| Office & Administration | 0 (0.0%) | 8 (100.0%) |
| Total (Category) | 4 (21.0%) | 15 (78.9%) |
| Total (Overall) | 70 (56.5%) | 54 (43.5%) |
Natural Resources, Construction and Maintenance Occupations
The most common Natural Resources, Construction and Maintenance occupations in Seville are Farming, Fishing & Forestry (39 | 31.5%), and Installation, Maintenance & Repair (3 | 2.4%).
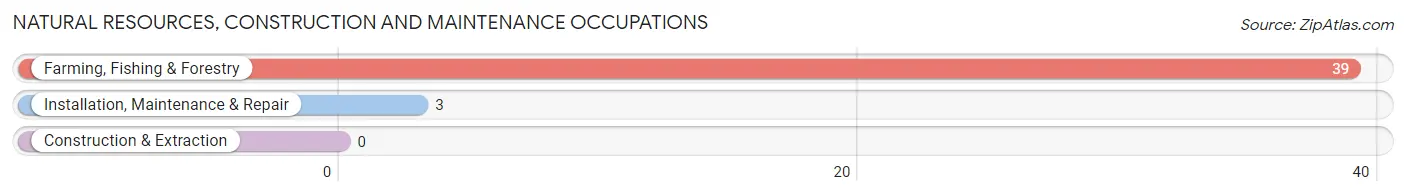
Natural Resources, Construction and Maintenance Occupations by Sex
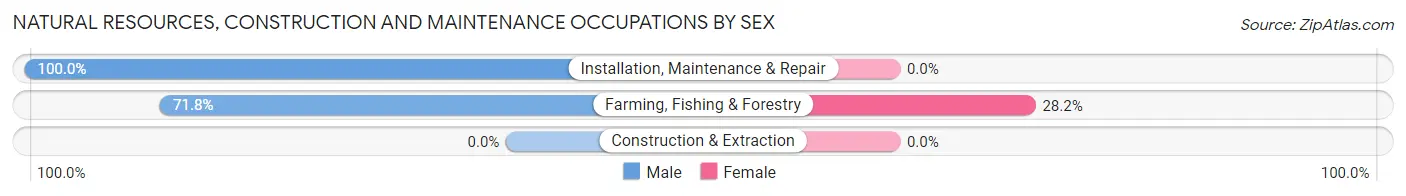
| Occupation | Male | Female |
| Farming, Fishing & Forestry | 28 (71.8%) | 11 (28.2%) |
| Construction & Extraction | 0 (0.0%) | 0 (0.0%) |
| Installation, Maintenance & Repair | 3 (100.0%) | 0 (0.0%) |
| Total (Category) | 31 (73.8%) | 11 (26.2%) |
| Total (Overall) | 70 (56.5%) | 54 (43.5%) |
Production, Transportation and Moving Occupations
The most common Production, Transportation and Moving occupations in Seville are Material Moving (28 | 22.6%), and Production (3 | 2.4%).
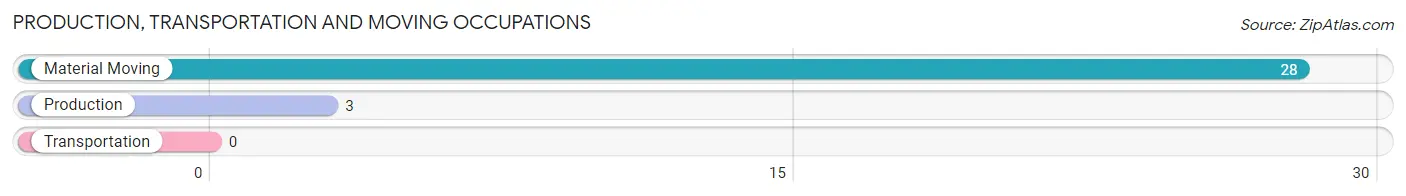
Production, Transportation and Moving Occupations by Sex
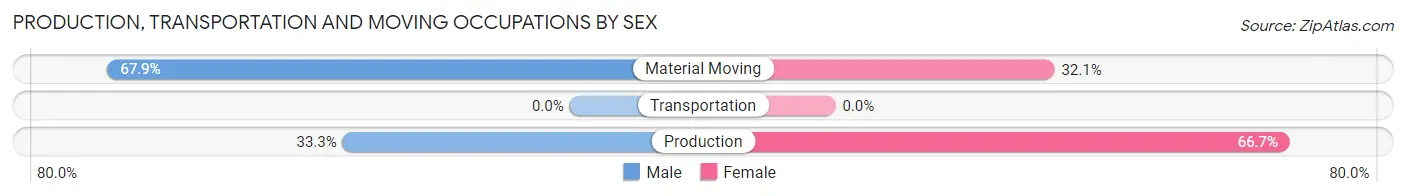
| Occupation | Male | Female |
| Production | 1 (33.3%) | 2 (66.7%) |
| Transportation | 0 (0.0%) | 0 (0.0%) |
| Material Moving | 19 (67.9%) | 9 (32.1%) |
| Total (Category) | 20 (64.5%) | 11 (35.5%) |
| Total (Overall) | 70 (56.5%) | 54 (43.5%) |
Employment Industries by Sex in Seville
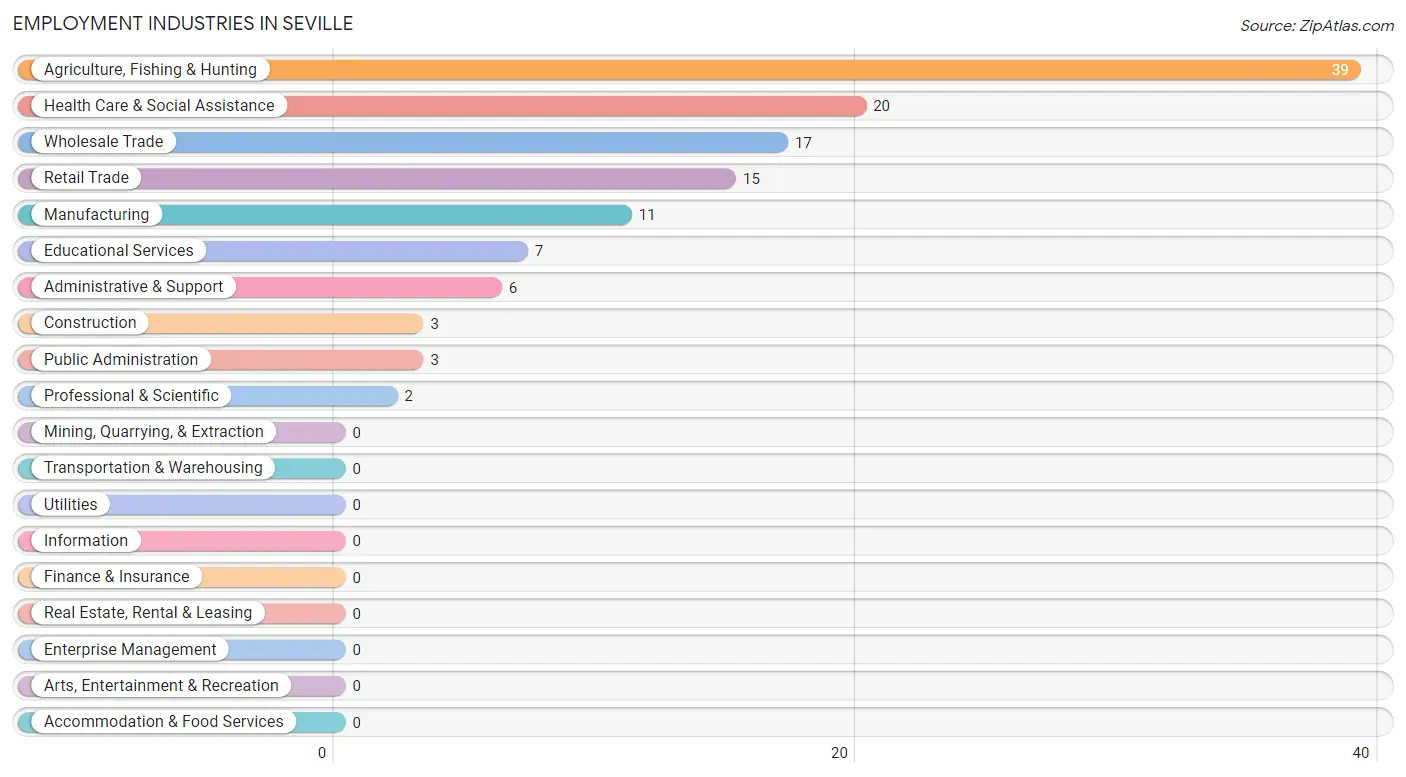
Employment Industries in Seville
The major employment industries in Seville include Agriculture, Fishing & Hunting (39 | 31.5%), Health Care & Social Assistance (20 | 16.1%), Wholesale Trade (17 | 13.7%), Retail Trade (15 | 12.1%), and Manufacturing (11 | 8.9%).
Employment Industries by Sex in Seville
The Seville industries that see more men than women are Construction (100.0%), Educational Services (85.7%), and Administrative & Support (83.3%), whereas the industries that tend to have a higher number of women are Professional & Scientific (100.0%), Public Administration (100.0%), and Health Care & Social Assistance (90.0%).
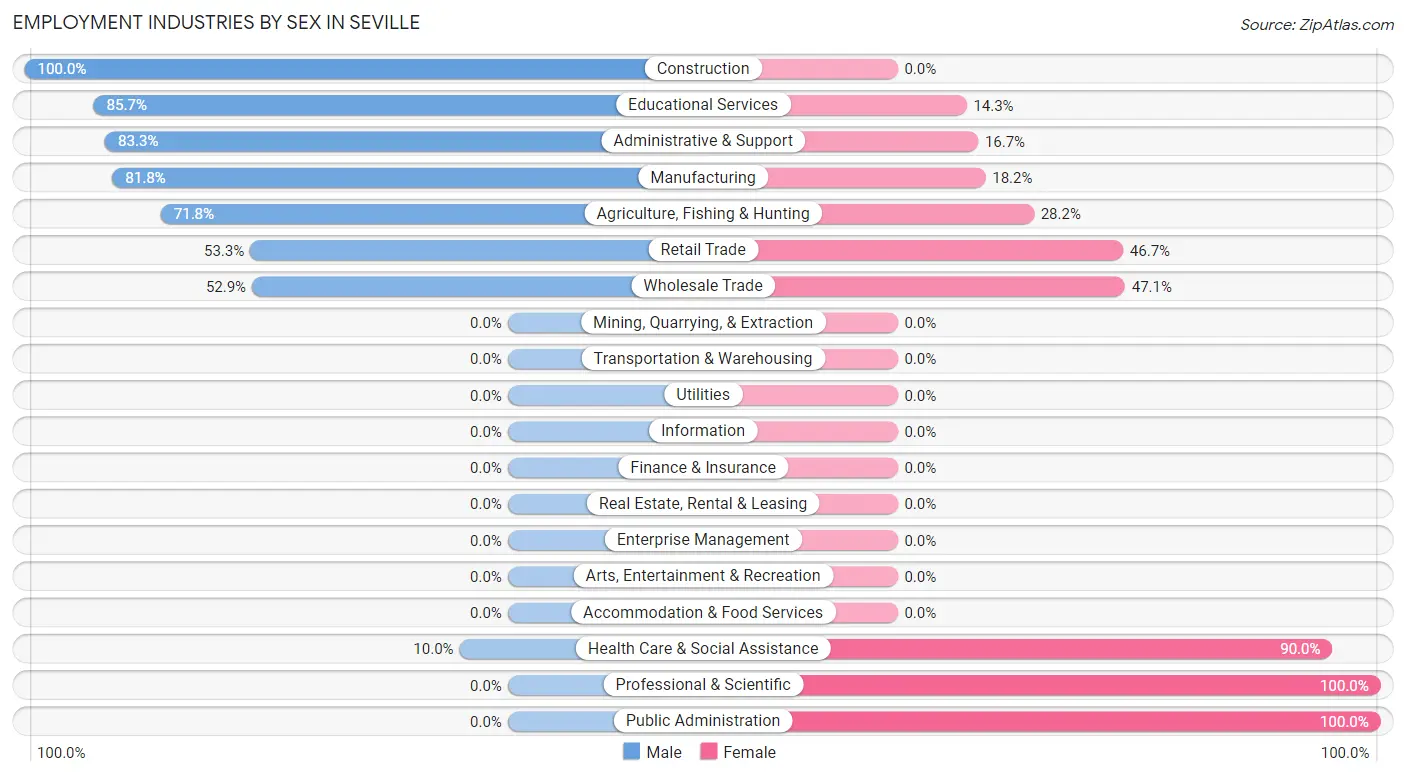
| Industry | Male | Female |
| Agriculture, Fishing & Hunting | 28 (71.8%) | 11 (28.2%) |
| Mining, Quarrying, & Extraction | 0 (0.0%) | 0 (0.0%) |
| Construction | 3 (100.0%) | 0 (0.0%) |
| Manufacturing | 9 (81.8%) | 2 (18.2%) |
| Wholesale Trade | 9 (52.9%) | 8 (47.1%) |
| Retail Trade | 8 (53.3%) | 7 (46.7%) |
| Transportation & Warehousing | 0 (0.0%) | 0 (0.0%) |
| Utilities | 0 (0.0%) | 0 (0.0%) |
| Information | 0 (0.0%) | 0 (0.0%) |
| Finance & Insurance | 0 (0.0%) | 0 (0.0%) |
| Real Estate, Rental & Leasing | 0 (0.0%) | 0 (0.0%) |
| Professional & Scientific | 0 (0.0%) | 2 (100.0%) |
| Enterprise Management | 0 (0.0%) | 0 (0.0%) |
| Administrative & Support | 5 (83.3%) | 1 (16.7%) |
| Educational Services | 6 (85.7%) | 1 (14.3%) |
| Health Care & Social Assistance | 2 (10.0%) | 18 (90.0%) |
| Arts, Entertainment & Recreation | 0 (0.0%) | 0 (0.0%) |
| Accommodation & Food Services | 0 (0.0%) | 0 (0.0%) |
| Public Administration | 0 (0.0%) | 3 (100.0%) |
| Total | 70 (56.5%) | 54 (43.5%) |
Education in Seville
School Enrollment in Seville
The most common levels of schooling among the 208 students in Seville are high school (69 | 33.2%), elementary school (57 | 27.4%), and middle school (38 | 18.3%).
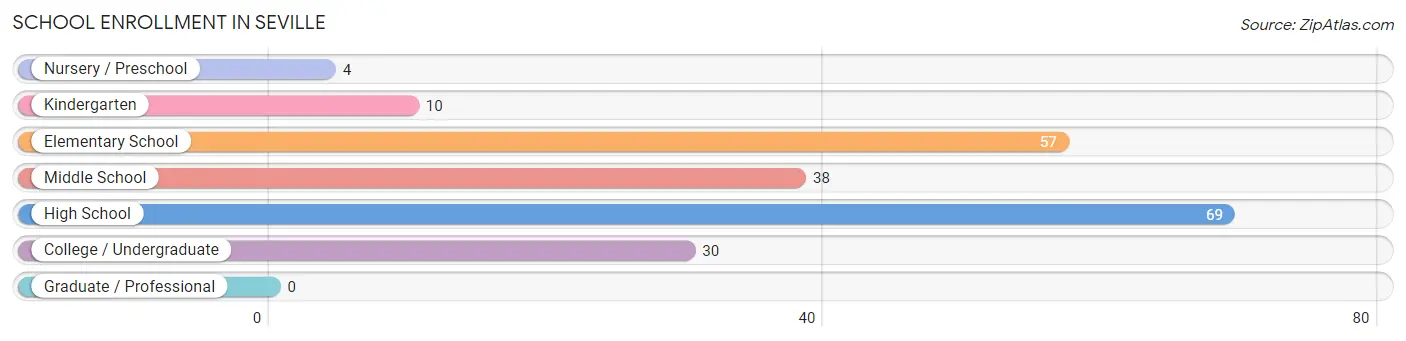
| School Level | # Students | % Students |
| Nursery / Preschool | 4 | 1.9% |
| Kindergarten | 10 | 4.8% |
| Elementary School | 57 | 27.4% |
| Middle School | 38 | 18.3% |
| High School | 69 | 33.2% |
| College / Undergraduate | 30 | 14.4% |
| Graduate / Professional | 0 | 0.0% |
| Total | 208 | 100.0% |
School Enrollment by Age by Funding Source in Seville
Out of a total of 208 students who are enrolled in schools in Seville, 26 (12.5%) attend a private institution, while the remaining 182 (87.5%) are enrolled in public schools. The age group of 35 years and over has the highest likelihood of being enrolled in private schools, with 7 (100.0% in the age bracket) enrolled. Conversely, the age group of 3 to 4 year olds has the lowest likelihood of being enrolled in a private school, with 4 (100.0% in the age bracket) attending a public institution.
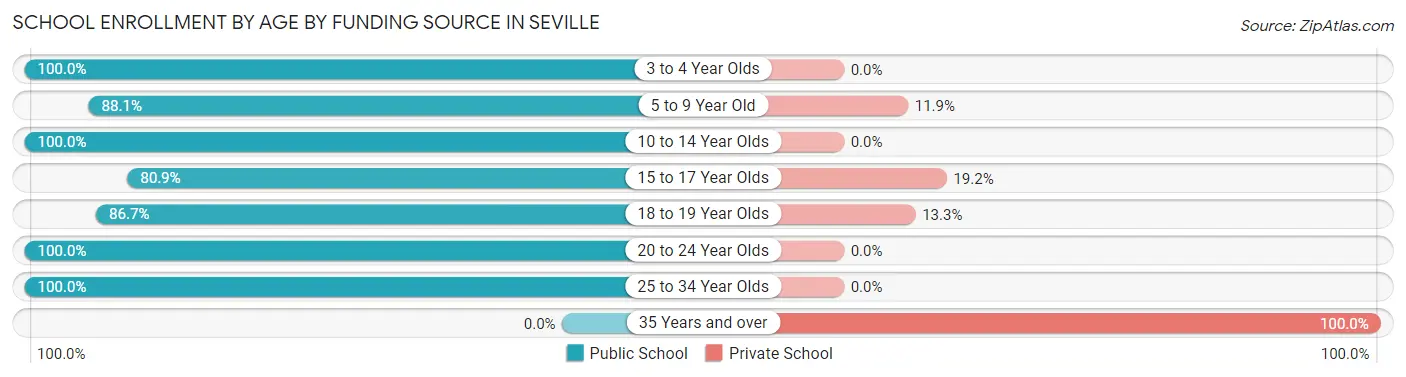
| Age Bracket | Public School | Private School |
| 3 to 4 Year Olds | 4 (100.0%) | 0 (0.0%) |
| 5 to 9 Year Old | 59 (88.1%) | 8 (11.9%) |
| 10 to 14 Year Olds | 50 (100.0%) | 0 (0.0%) |
| 15 to 17 Year Olds | 38 (80.8%) | 9 (19.2%) |
| 18 to 19 Year Olds | 13 (86.7%) | 2 (13.3%) |
| 20 to 24 Year Olds | 10 (100.0%) | 0 (0.0%) |
| 25 to 34 Year Olds | 8 (100.0%) | 0 (0.0%) |
| 35 Years and over | 0 (0.0%) | 7 (100.0%) |
| Total | 182 (87.5%) | 26 (12.5%) |
Educational Attainment by Field of Study in Seville
Visual & performing arts (3 | 33.3%), education (2 | 22.2%), arts & humanities (2 | 22.2%), bio, nature & agricultural (1 | 11.1%), and liberal arts & history (1 | 11.1%) are the most common fields of study among 9 individuals in Seville who have obtained a bachelor's degree or higher.
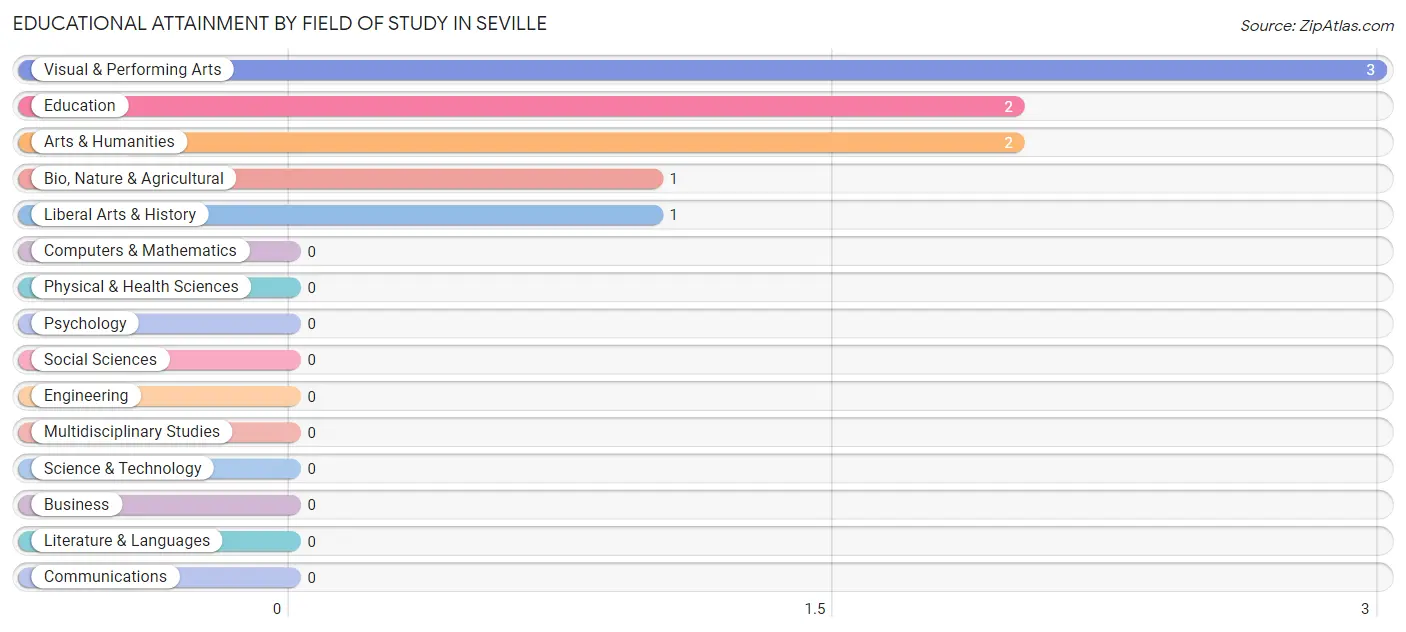
| Field of Study | # Graduates | % Graduates |
| Computers & Mathematics | 0 | 0.0% |
| Bio, Nature & Agricultural | 1 | 11.1% |
| Physical & Health Sciences | 0 | 0.0% |
| Psychology | 0 | 0.0% |
| Social Sciences | 0 | 0.0% |
| Engineering | 0 | 0.0% |
| Multidisciplinary Studies | 0 | 0.0% |
| Science & Technology | 0 | 0.0% |
| Business | 0 | 0.0% |
| Education | 2 | 22.2% |
| Literature & Languages | 0 | 0.0% |
| Liberal Arts & History | 1 | 11.1% |
| Visual & Performing Arts | 3 | 33.3% |
| Communications | 0 | 0.0% |
| Arts & Humanities | 2 | 22.2% |
| Total | 9 | 100.0% |
Transportation & Commute in Seville
Vehicle Availability by Sex in Seville
The most prevalent vehicle ownership categories in Seville are males with 3 vehicles (27, accounting for 38.6%) and females with 3 vehicles (29, making up 50.0%).
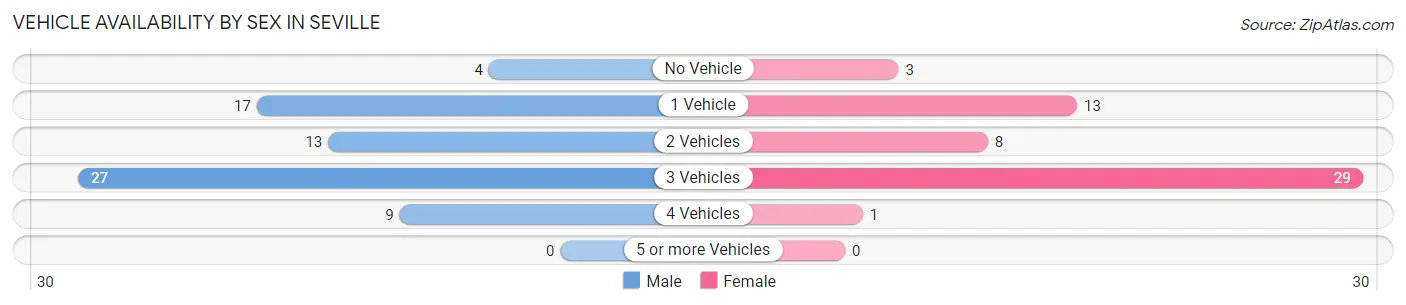
| Vehicles Available | Male | Female |
| No Vehicle | 4 (5.7%) | 3 (5.6%) |
| 1 Vehicle | 17 (24.3%) | 13 (24.1%) |
| 2 Vehicles | 13 (18.6%) | 8 (14.8%) |
| 3 Vehicles | 27 (38.6%) | 29 (53.7%) |
| 4 Vehicles | 9 (12.9%) | 1 (1.8%) |
| 5 or more Vehicles | 0 (0.0%) | 0 (0.0%) |
| Total | 70 (100.0%) | 54 (100.0%) |
Commute Time in Seville
The most frequently occuring commute durations in Seville are 30 to 34 minutes (29 commuters, 24.2%), 20 to 24 minutes (19 commuters, 15.8%), and 35 to 39 minutes (18 commuters, 15.0%).
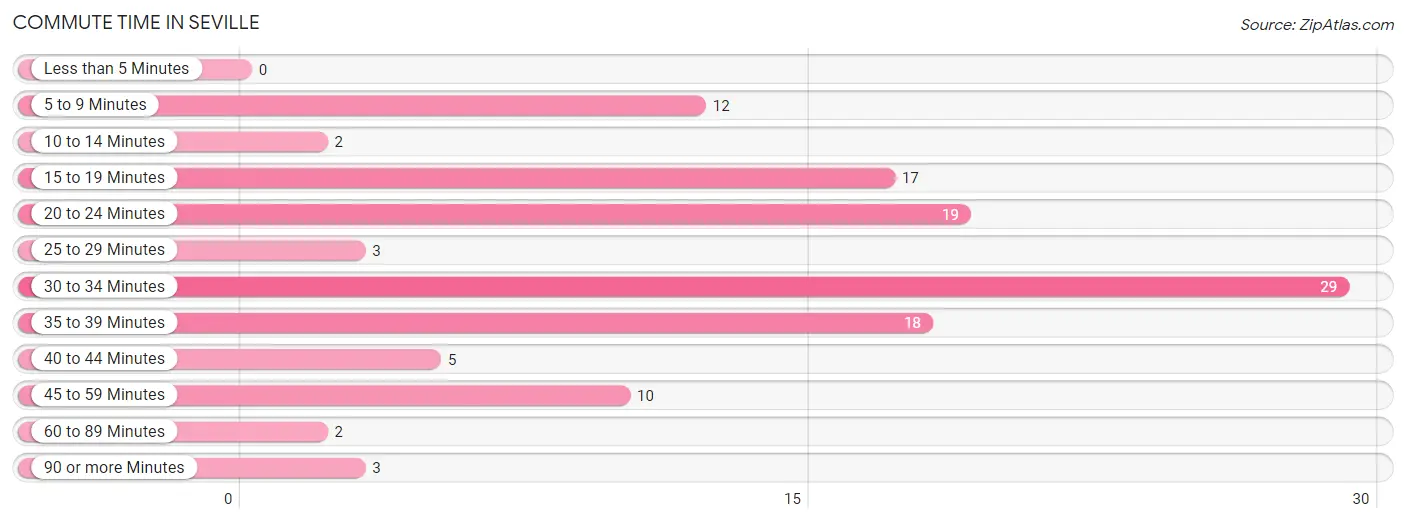
| Commute Time | # Commuters | % Commuters |
| Less than 5 Minutes | 0 | 0.0% |
| 5 to 9 Minutes | 12 | 10.0% |
| 10 to 14 Minutes | 2 | 1.7% |
| 15 to 19 Minutes | 17 | 14.2% |
| 20 to 24 Minutes | 19 | 15.8% |
| 25 to 29 Minutes | 3 | 2.5% |
| 30 to 34 Minutes | 29 | 24.2% |
| 35 to 39 Minutes | 18 | 15.0% |
| 40 to 44 Minutes | 5 | 4.2% |
| 45 to 59 Minutes | 10 | 8.3% |
| 60 to 89 Minutes | 2 | 1.7% |
| 90 or more Minutes | 3 | 2.5% |
Commute Time by Sex in Seville
The most common commute times in Seville are 30 to 34 minutes (22 commuters, 31.4%) for males and 35 to 39 minutes (9 commuters, 18.0%) for females.
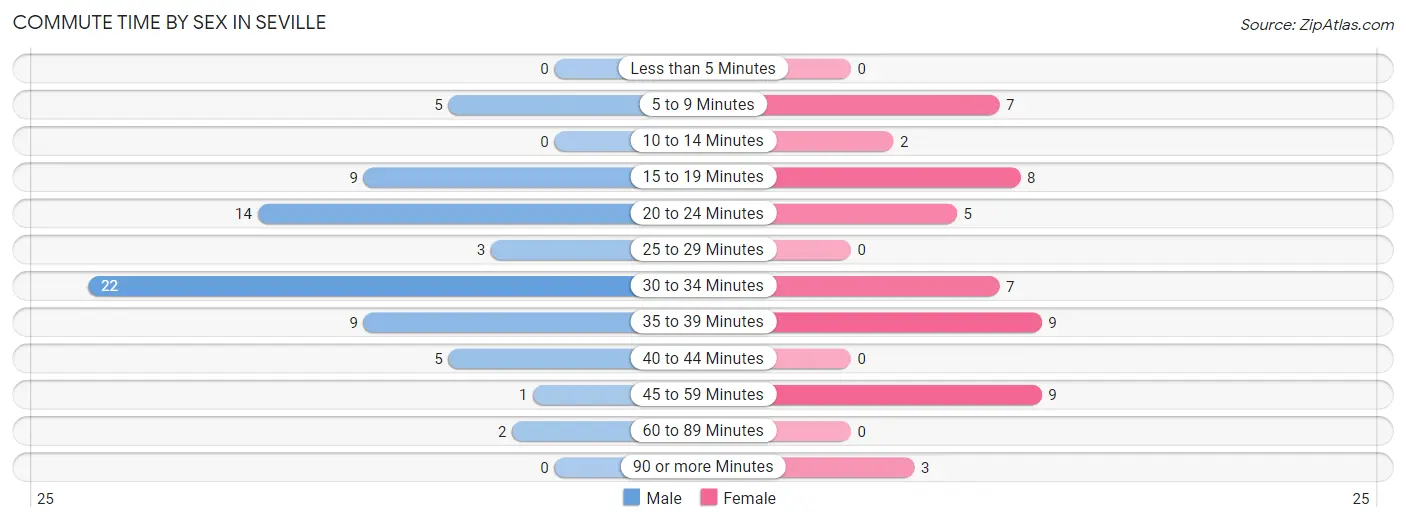
| Commute Time | Male | Female |
| Less than 5 Minutes | 0 (0.0%) | 0 (0.0%) |
| 5 to 9 Minutes | 5 (7.1%) | 7 (14.0%) |
| 10 to 14 Minutes | 0 (0.0%) | 2 (4.0%) |
| 15 to 19 Minutes | 9 (12.9%) | 8 (16.0%) |
| 20 to 24 Minutes | 14 (20.0%) | 5 (10.0%) |
| 25 to 29 Minutes | 3 (4.3%) | 0 (0.0%) |
| 30 to 34 Minutes | 22 (31.4%) | 7 (14.0%) |
| 35 to 39 Minutes | 9 (12.9%) | 9 (18.0%) |
| 40 to 44 Minutes | 5 (7.1%) | 0 (0.0%) |
| 45 to 59 Minutes | 1 (1.4%) | 9 (18.0%) |
| 60 to 89 Minutes | 2 (2.9%) | 0 (0.0%) |
| 90 or more Minutes | 0 (0.0%) | 3 (6.0%) |
Time of Departure to Work by Sex in Seville
The most frequent times of departure to work in Seville are 12:00 AM to 4:59 AM (21, 30.0%) for males and 12:00 AM to 4:59 AM (11, 22.0%) for females.
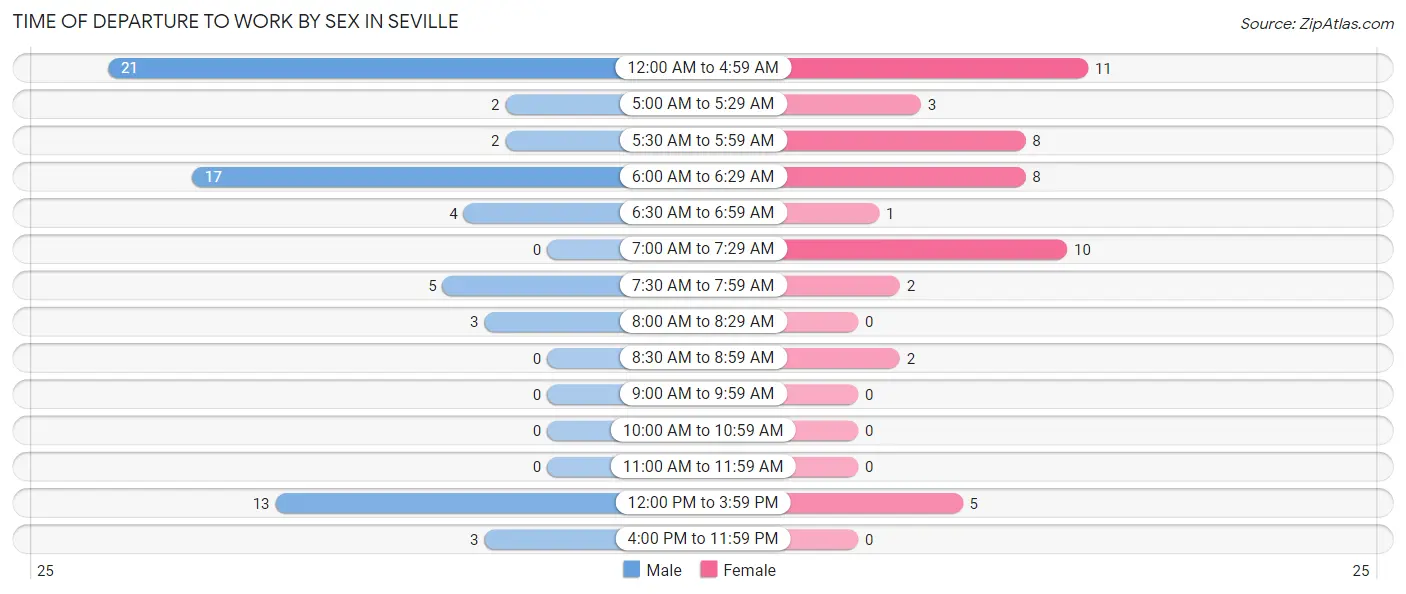
| Time of Departure | Male | Female |
| 12:00 AM to 4:59 AM | 21 (30.0%) | 11 (22.0%) |
| 5:00 AM to 5:29 AM | 2 (2.9%) | 3 (6.0%) |
| 5:30 AM to 5:59 AM | 2 (2.9%) | 8 (16.0%) |
| 6:00 AM to 6:29 AM | 17 (24.3%) | 8 (16.0%) |
| 6:30 AM to 6:59 AM | 4 (5.7%) | 1 (2.0%) |
| 7:00 AM to 7:29 AM | 0 (0.0%) | 10 (20.0%) |
| 7:30 AM to 7:59 AM | 5 (7.1%) | 2 (4.0%) |
| 8:00 AM to 8:29 AM | 3 (4.3%) | 0 (0.0%) |
| 8:30 AM to 8:59 AM | 0 (0.0%) | 2 (4.0%) |
| 9:00 AM to 9:59 AM | 0 (0.0%) | 0 (0.0%) |
| 10:00 AM to 10:59 AM | 0 (0.0%) | 0 (0.0%) |
| 11:00 AM to 11:59 AM | 0 (0.0%) | 0 (0.0%) |
| 12:00 PM to 3:59 PM | 13 (18.6%) | 5 (10.0%) |
| 4:00 PM to 11:59 PM | 3 (4.3%) | 0 (0.0%) |
| Total | 70 (100.0%) | 50 (100.0%) |
Housing Occupancy in Seville
Occupancy by Ownership in Seville
Of the total 90 dwellings in Seville, owner-occupied units account for 50 (55.6%), while renter-occupied units make up 40 (44.4%).
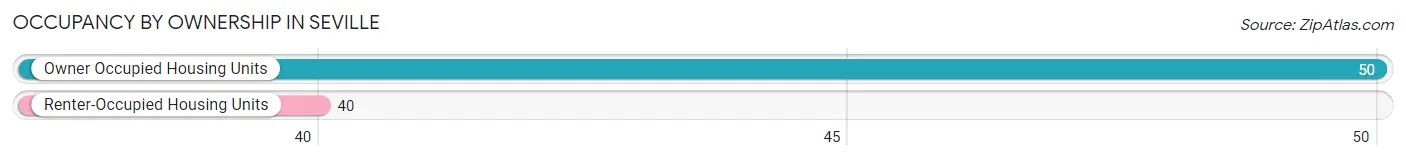
| Occupancy | # Housing Units | % Housing Units |
| Owner Occupied Housing Units | 50 | 55.6% |
| Renter-Occupied Housing Units | 40 | 44.4% |
| Total Occupied Housing Units | 90 | 100.0% |
Occupancy by Household Size in Seville
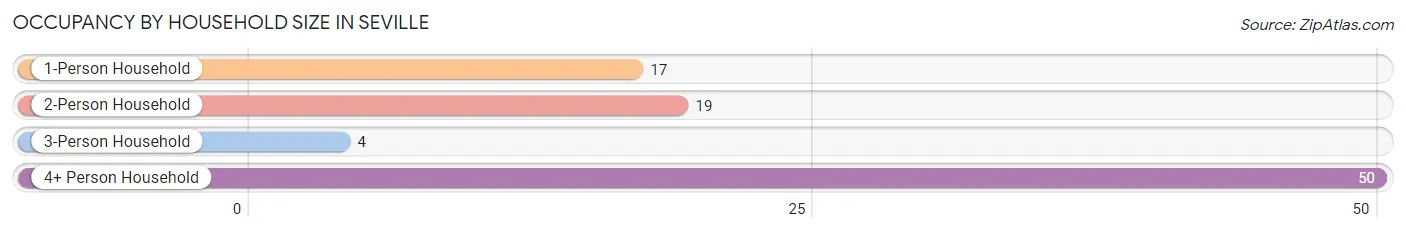
| Household Size | # Housing Units | % Housing Units |
| 1-Person Household | 17 | 18.9% |
| 2-Person Household | 19 | 21.1% |
| 3-Person Household | 4 | 4.4% |
| 4+ Person Household | 50 | 55.6% |
| Total Housing Units | 90 | 100.0% |
Occupancy by Ownership by Household Size in Seville
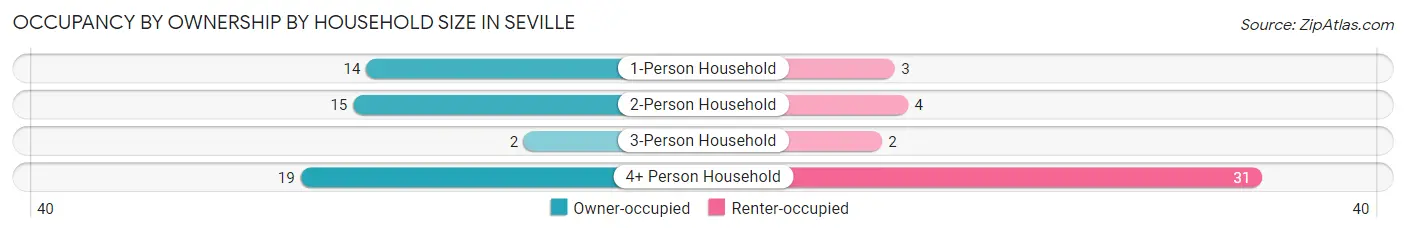
| Household Size | Owner-occupied | Renter-occupied |
| 1-Person Household | 14 (82.4%) | 3 (17.6%) |
| 2-Person Household | 15 (78.9%) | 4 (21.0%) |
| 3-Person Household | 2 (50.0%) | 2 (50.0%) |
| 4+ Person Household | 19 (38.0%) | 31 (62.0%) |
| Total Housing Units | 50 (55.6%) | 40 (44.4%) |
Occupancy by Educational Attainment in Seville
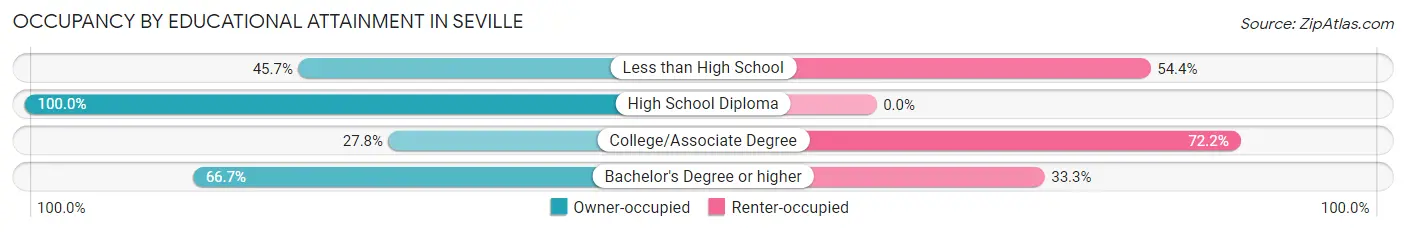
| Household Size | Owner-occupied | Renter-occupied |
| Less than High School | 21 (45.7%) | 25 (54.3%) |
| High School Diploma | 20 (100.0%) | 0 (0.0%) |
| College/Associate Degree | 5 (27.8%) | 13 (72.2%) |
| Bachelor's Degree or higher | 4 (66.7%) | 2 (33.3%) |
Occupancy by Age of Householder in Seville
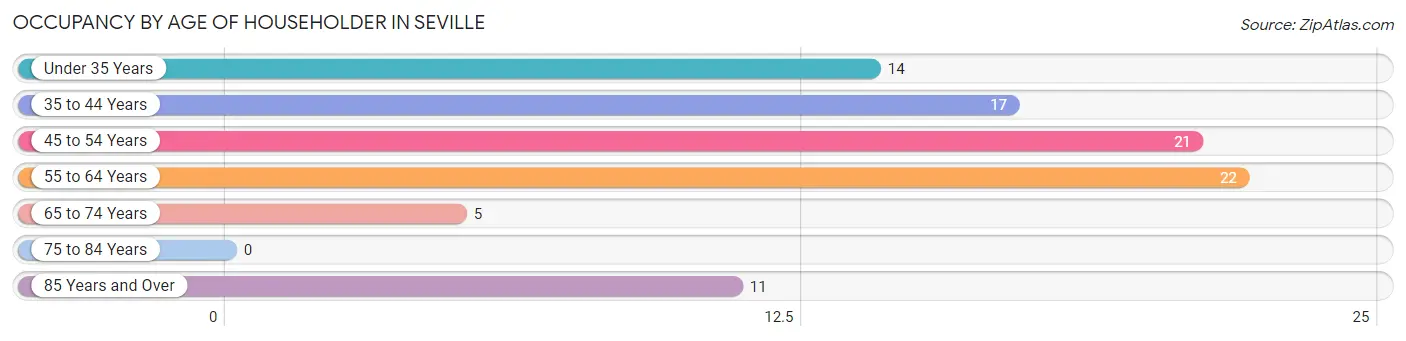
| Age Bracket | # Households | % Households |
| Under 35 Years | 14 | 15.6% |
| 35 to 44 Years | 17 | 18.9% |
| 45 to 54 Years | 21 | 23.3% |
| 55 to 64 Years | 22 | 24.4% |
| 65 to 74 Years | 5 | 5.6% |
| 75 to 84 Years | 0 | 0.0% |
| 85 Years and Over | 11 | 12.2% |
| Total | 90 | 100.0% |
Housing Finances in Seville
Median Income by Occupancy in Seville
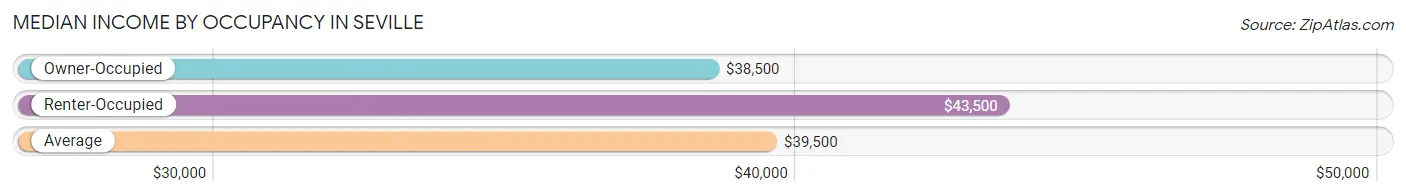
| Occupancy Type | # Households | Median Income |
| Owner-Occupied | 50 (55.6%) | $38,500 |
| Renter-Occupied | 40 (44.4%) | $43,500 |
| Average | 90 (100.0%) | $39,500 |
Occupancy by Householder Income Bracket in Seville
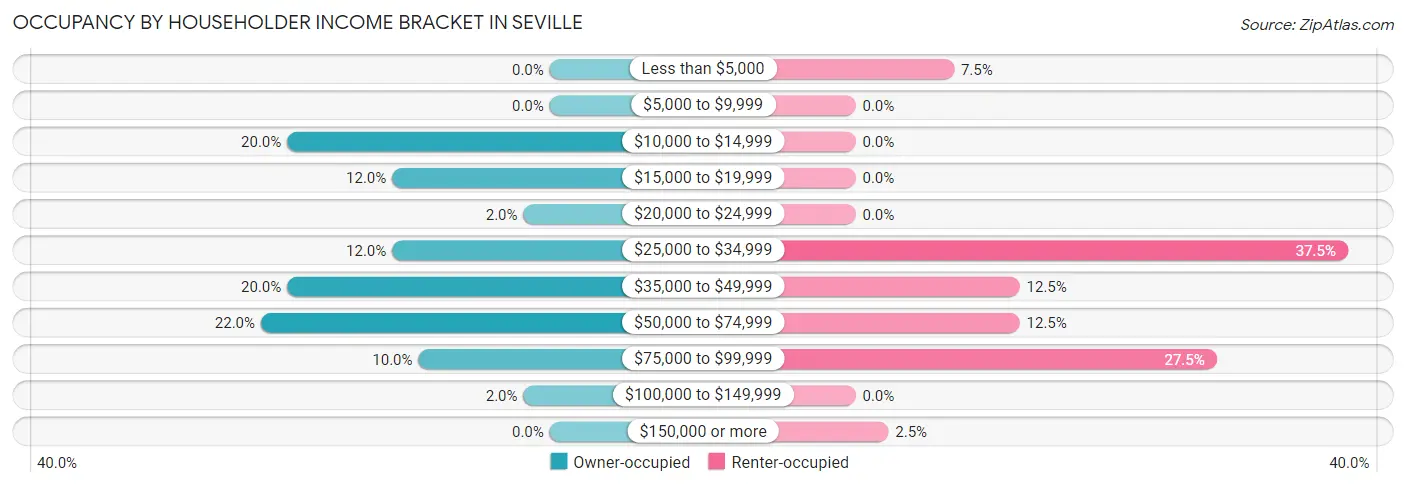
| Income Bracket | Owner-occupied | Renter-occupied |
| Less than $5,000 | 0 (0.0%) | 3 (7.5%) |
| $5,000 to $9,999 | 0 (0.0%) | 0 (0.0%) |
| $10,000 to $14,999 | 10 (20.0%) | 0 (0.0%) |
| $15,000 to $19,999 | 6 (12.0%) | 0 (0.0%) |
| $20,000 to $24,999 | 1 (2.0%) | 0 (0.0%) |
| $25,000 to $34,999 | 6 (12.0%) | 15 (37.5%) |
| $35,000 to $49,999 | 10 (20.0%) | 5 (12.5%) |
| $50,000 to $74,999 | 11 (22.0%) | 5 (12.5%) |
| $75,000 to $99,999 | 5 (10.0%) | 11 (27.5%) |
| $100,000 to $149,999 | 1 (2.0%) | 0 (0.0%) |
| $150,000 or more | 0 (0.0%) | 1 (2.5%) |
| Total | 50 (100.0%) | 40 (100.0%) |
Monthly Housing Cost Tiers in Seville
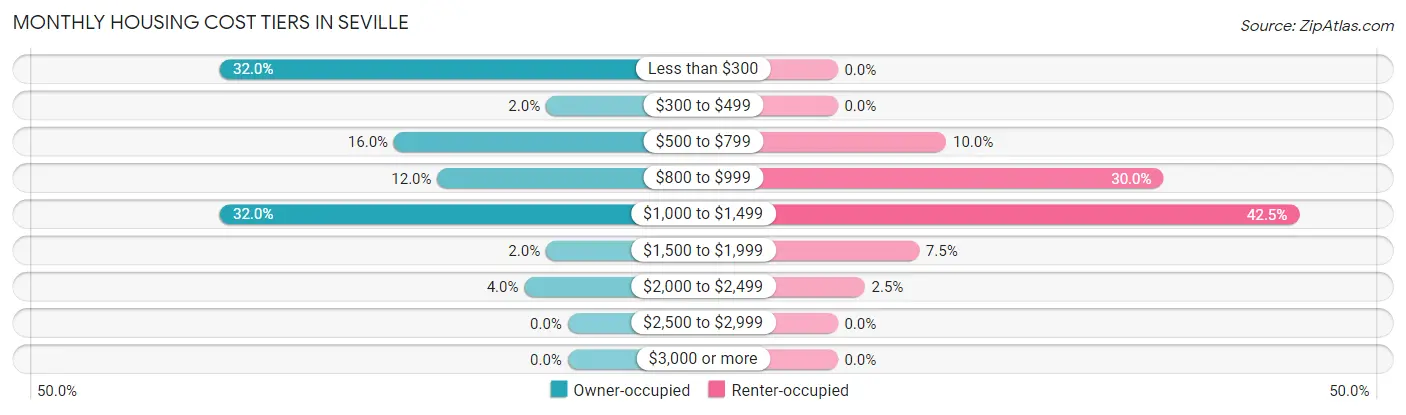
| Monthly Cost | Owner-occupied | Renter-occupied |
| Less than $300 | 16 (32.0%) | 0 (0.0%) |
| $300 to $499 | 1 (2.0%) | 0 (0.0%) |
| $500 to $799 | 8 (16.0%) | 4 (10.0%) |
| $800 to $999 | 6 (12.0%) | 12 (30.0%) |
| $1,000 to $1,499 | 16 (32.0%) | 17 (42.5%) |
| $1,500 to $1,999 | 1 (2.0%) | 3 (7.5%) |
| $2,000 to $2,499 | 2 (4.0%) | 1 (2.5%) |
| $2,500 to $2,999 | 0 (0.0%) | 0 (0.0%) |
| $3,000 or more | 0 (0.0%) | 0 (0.0%) |
| Total | 50 (100.0%) | 40 (100.0%) |
Physical Housing Characteristics in Seville
Housing Structures in Seville
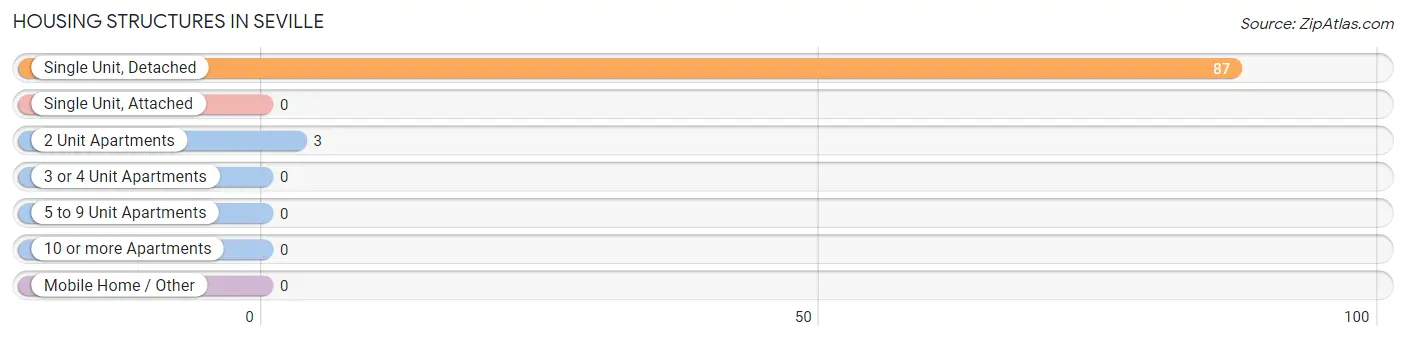
| Structure Type | # Housing Units | % Housing Units |
| Single Unit, Detached | 87 | 96.7% |
| Single Unit, Attached | 0 | 0.0% |
| 2 Unit Apartments | 3 | 3.3% |
| 3 or 4 Unit Apartments | 0 | 0.0% |
| 5 to 9 Unit Apartments | 0 | 0.0% |
| 10 or more Apartments | 0 | 0.0% |
| Mobile Home / Other | 0 | 0.0% |
| Total | 90 | 100.0% |
Housing Structures by Occupancy in Seville
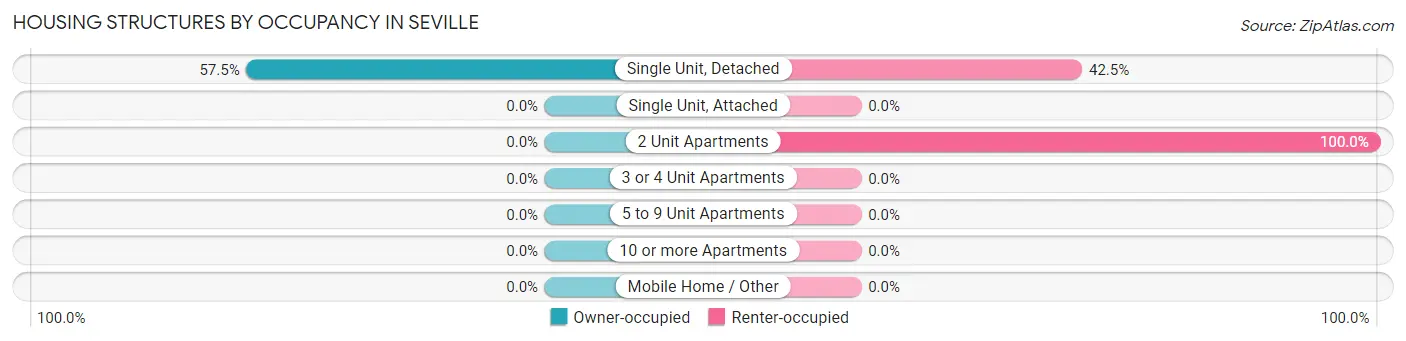
| Structure Type | Owner-occupied | Renter-occupied |
| Single Unit, Detached | 50 (57.5%) | 37 (42.5%) |
| Single Unit, Attached | 0 (0.0%) | 0 (0.0%) |
| 2 Unit Apartments | 0 (0.0%) | 3 (100.0%) |
| 3 or 4 Unit Apartments | 0 (0.0%) | 0 (0.0%) |
| 5 to 9 Unit Apartments | 0 (0.0%) | 0 (0.0%) |
| 10 or more Apartments | 0 (0.0%) | 0 (0.0%) |
| Mobile Home / Other | 0 (0.0%) | 0 (0.0%) |
| Total | 50 (55.6%) | 40 (44.4%) |
Housing Structures by Number of Rooms in Seville
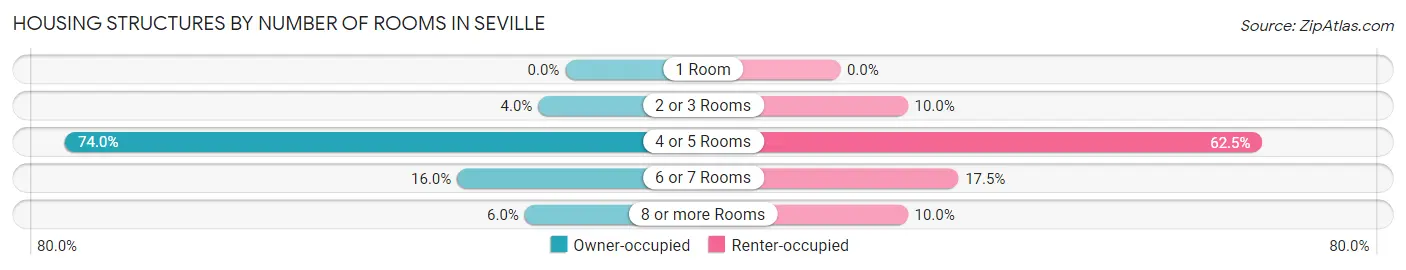
| Number of Rooms | Owner-occupied | Renter-occupied |
| 1 Room | 0 (0.0%) | 0 (0.0%) |
| 2 or 3 Rooms | 2 (4.0%) | 4 (10.0%) |
| 4 or 5 Rooms | 37 (74.0%) | 25 (62.5%) |
| 6 or 7 Rooms | 8 (16.0%) | 7 (17.5%) |
| 8 or more Rooms | 3 (6.0%) | 4 (10.0%) |
| Total | 50 (100.0%) | 40 (100.0%) |
Housing Structure by Heating Type in Seville
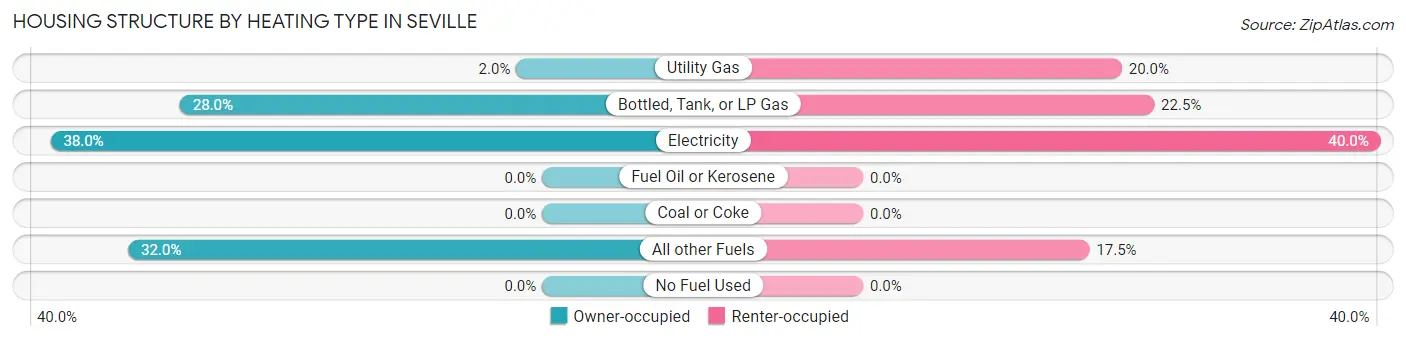
| Heating Type | Owner-occupied | Renter-occupied |
| Utility Gas | 1 (2.0%) | 8 (20.0%) |
| Bottled, Tank, or LP Gas | 14 (28.0%) | 9 (22.5%) |
| Electricity | 19 (38.0%) | 16 (40.0%) |
| Fuel Oil or Kerosene | 0 (0.0%) | 0 (0.0%) |
| Coal or Coke | 0 (0.0%) | 0 (0.0%) |
| All other Fuels | 16 (32.0%) | 7 (17.5%) |
| No Fuel Used | 0 (0.0%) | 0 (0.0%) |
| Total | 50 (100.0%) | 40 (100.0%) |
Household Vehicle Usage in Seville
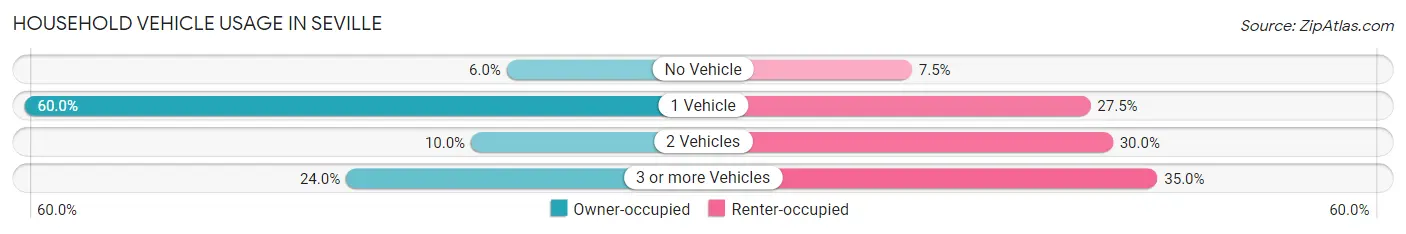
| Vehicles per Household | Owner-occupied | Renter-occupied |
| No Vehicle | 3 (6.0%) | 3 (7.5%) |
| 1 Vehicle | 30 (60.0%) | 11 (27.5%) |
| 2 Vehicles | 5 (10.0%) | 12 (30.0%) |
| 3 or more Vehicles | 12 (24.0%) | 14 (35.0%) |
| Total | 50 (100.0%) | 40 (100.0%) |
Real Estate & Mortgages in Seville
Real Estate and Mortgage Overview in Seville
| Characteristic | Without Mortgage | With Mortgage |
| Housing Units | 25 | 25 |
| Median Property Value | - | - |
| Median Household Income | $33,750 | $0 |
| Monthly Housing Costs | $265 | $0 |
| Real Estate Taxes | $764 | $0 |
Property Value by Mortgage Status in Seville
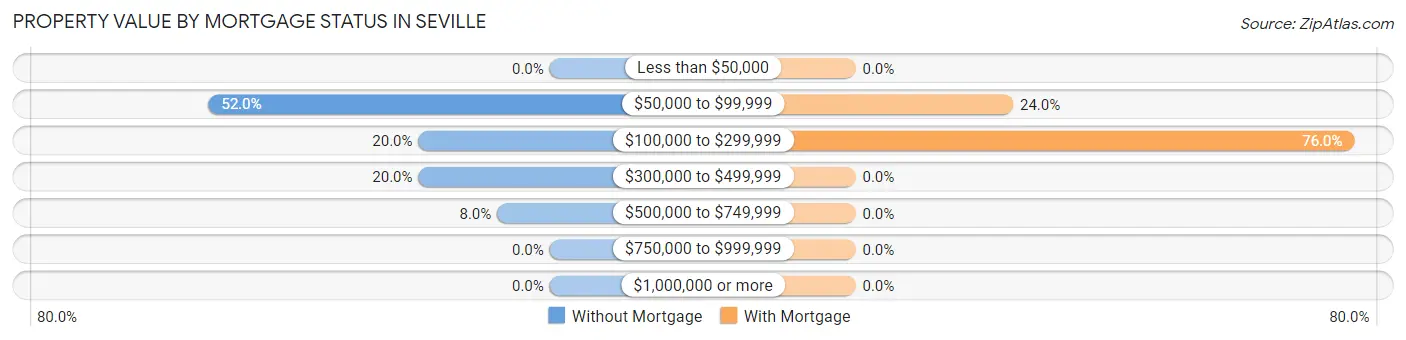
| Property Value | Without Mortgage | With Mortgage |
| Less than $50,000 | 0 (0.0%) | 0 (0.0%) |
| $50,000 to $99,999 | 13 (52.0%) | 6 (24.0%) |
| $100,000 to $299,999 | 5 (20.0%) | 19 (76.0%) |
| $300,000 to $499,999 | 5 (20.0%) | 0 (0.0%) |
| $500,000 to $749,999 | 2 (8.0%) | 0 (0.0%) |
| $750,000 to $999,999 | 0 (0.0%) | 0 (0.0%) |
| $1,000,000 or more | 0 (0.0%) | 0 (0.0%) |
| Total | 25 (100.0%) | 25 (100.0%) |
Household Income by Mortgage Status in Seville
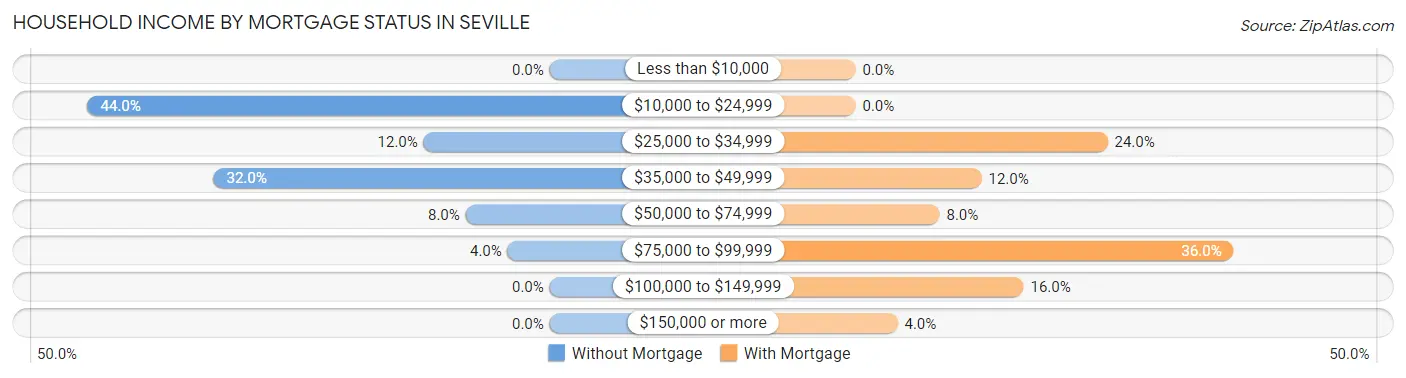
| Household Income | Without Mortgage | With Mortgage |
| Less than $10,000 | 0 (0.0%) | 0 (0.0%) |
| $10,000 to $24,999 | 11 (44.0%) | 0 (0.0%) |
| $25,000 to $34,999 | 3 (12.0%) | 6 (24.0%) |
| $35,000 to $49,999 | 8 (32.0%) | 3 (12.0%) |
| $50,000 to $74,999 | 2 (8.0%) | 2 (8.0%) |
| $75,000 to $99,999 | 1 (4.0%) | 9 (36.0%) |
| $100,000 to $149,999 | 0 (0.0%) | 4 (16.0%) |
| $150,000 or more | 0 (0.0%) | 1 (4.0%) |
| Total | 25 (100.0%) | 25 (100.0%) |
Property Value to Household Income Ratio in Seville
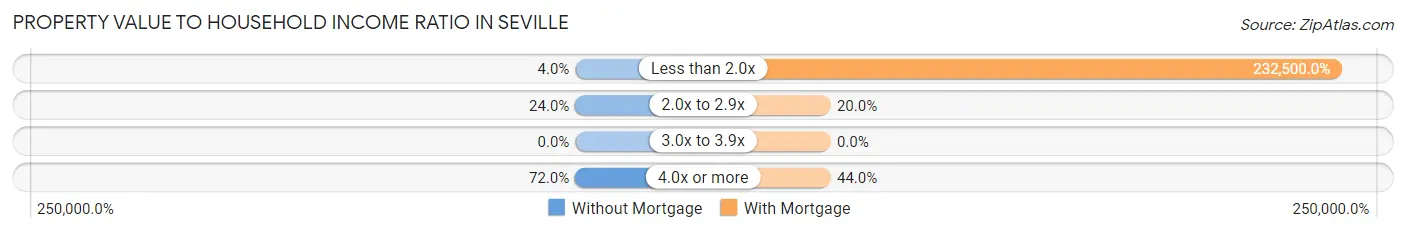
| Value-to-Income Ratio | Without Mortgage | With Mortgage |
| Less than 2.0x | 1 (4.0%) | 58,125 (232,500.0%) |
| 2.0x to 2.9x | 6 (24.0%) | 5 (20.0%) |
| 3.0x to 3.9x | 0 (0.0%) | 0 (0.0%) |
| 4.0x or more | 18 (72.0%) | 11 (44.0%) |
| Total | 25 (100.0%) | 25 (100.0%) |
Real Estate Taxes by Mortgage Status in Seville
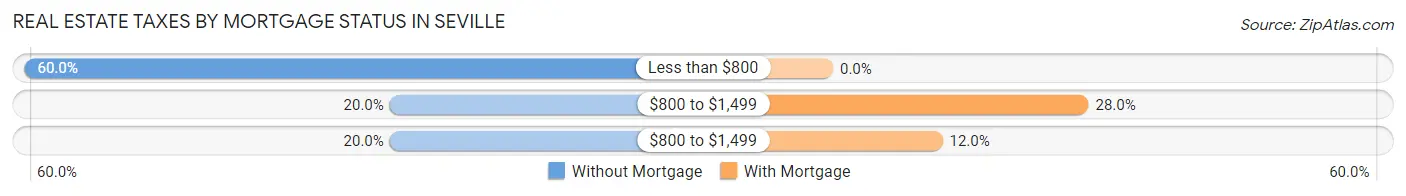
| Property Taxes | Without Mortgage | With Mortgage |
| Less than $800 | 15 (60.0%) | 0 (0.0%) |
| $800 to $1,499 | 5 (20.0%) | 7 (28.0%) |
| $800 to $1,499 | 5 (20.0%) | 3 (12.0%) |
| Total | 25 (100.0%) | 25 (100.0%) |
Health & Disability in Seville
Health Insurance Coverage by Age in Seville
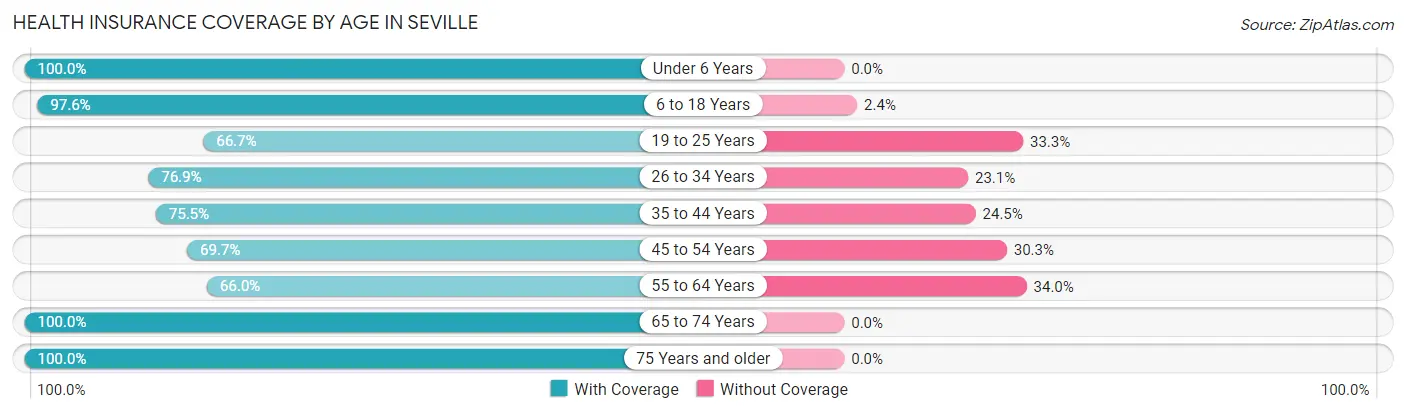
| Age Bracket | With Coverage | Without Coverage |
| Under 6 Years | 33 (100.0%) | 0 (0.0%) |
| 6 to 18 Years | 163 (97.6%) | 4 (2.4%) |
| 19 to 25 Years | 14 (66.7%) | 7 (33.3%) |
| 26 to 34 Years | 30 (76.9%) | 9 (23.1%) |
| 35 to 44 Years | 37 (75.5%) | 12 (24.5%) |
| 45 to 54 Years | 23 (69.7%) | 10 (30.3%) |
| 55 to 64 Years | 33 (66.0%) | 17 (34.0%) |
| 65 to 74 Years | 5 (100.0%) | 0 (0.0%) |
| 75 Years and older | 14 (100.0%) | 0 (0.0%) |
| Total | 352 (85.6%) | 59 (14.4%) |
Health Insurance Coverage by Citizenship Status in Seville
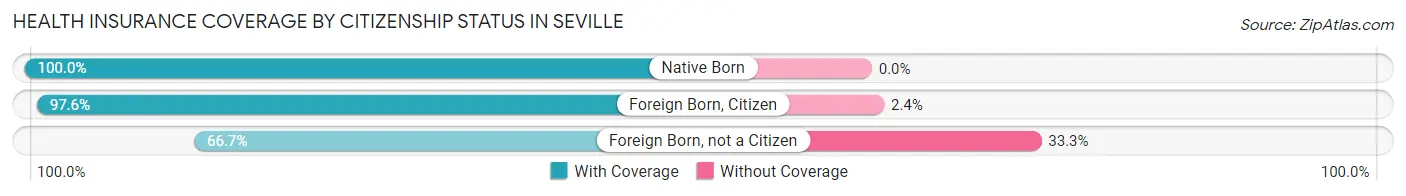
| Citizenship Status | With Coverage | Without Coverage |
| Native Born | 33 (100.0%) | 0 (0.0%) |
| Foreign Born, Citizen | 163 (97.6%) | 4 (2.4%) |
| Foreign Born, not a Citizen | 14 (66.7%) | 7 (33.3%) |
Health Insurance Coverage by Household Income in Seville
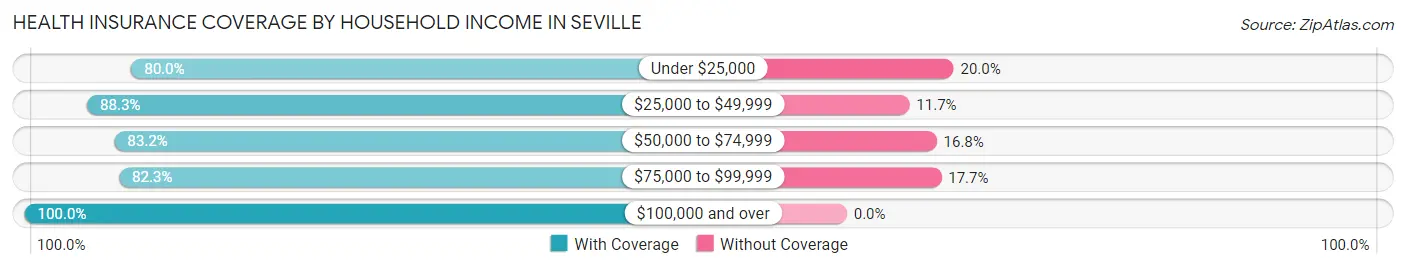
| Household Income | With Coverage | Without Coverage |
| Under $25,000 | 24 (80.0%) | 6 (20.0%) |
| $25,000 to $49,999 | 143 (88.3%) | 19 (11.7%) |
| $50,000 to $74,999 | 84 (83.2%) | 17 (16.8%) |
| $75,000 to $99,999 | 79 (82.3%) | 17 (17.7%) |
| $100,000 and over | 22 (100.0%) | 0 (0.0%) |
Public vs Private Health Insurance Coverage by Age in Seville
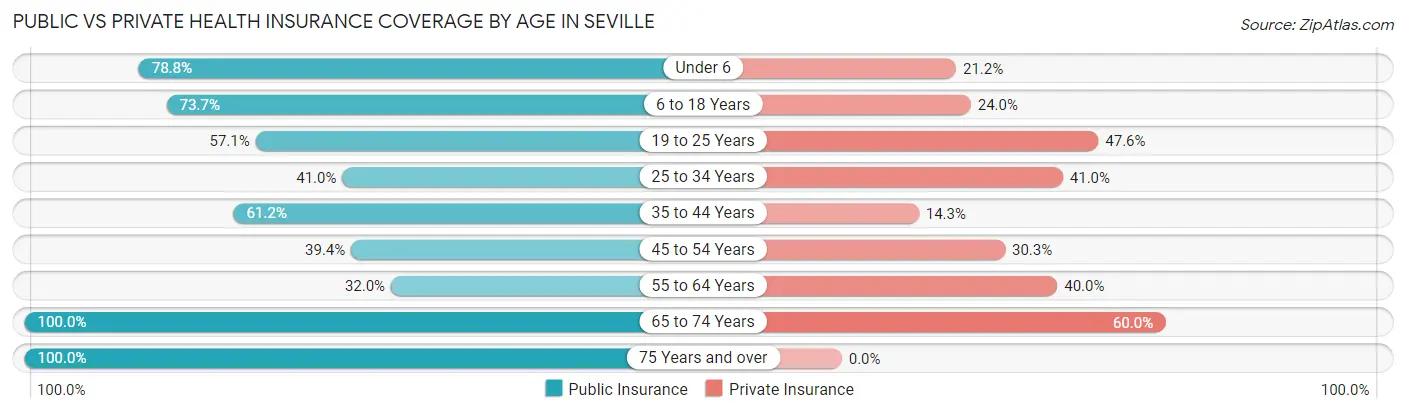
| Age Bracket | Public Insurance | Private Insurance |
| Under 6 | 26 (78.8%) | 7 (21.2%) |
| 6 to 18 Years | 123 (73.7%) | 40 (23.9%) |
| 19 to 25 Years | 12 (57.1%) | 10 (47.6%) |
| 25 to 34 Years | 16 (41.0%) | 16 (41.0%) |
| 35 to 44 Years | 30 (61.2%) | 7 (14.3%) |
| 45 to 54 Years | 13 (39.4%) | 10 (30.3%) |
| 55 to 64 Years | 16 (32.0%) | 20 (40.0%) |
| 65 to 74 Years | 5 (100.0%) | 3 (60.0%) |
| 75 Years and over | 14 (100.0%) | 0 (0.0%) |
| Total | 255 (62.0%) | 113 (27.5%) |
Disability Status by Sex by Age in Seville
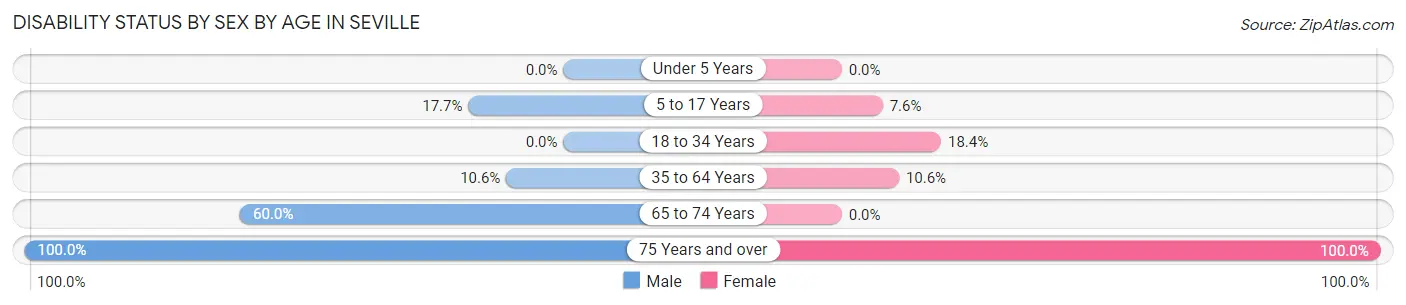
| Age Bracket | Male | Female |
| Under 5 Years | 0 (0.0%) | 0 (0.0%) |
| 5 to 17 Years | 15 (17.6%) | 6 (7.6%) |
| 18 to 34 Years | 0 (0.0%) | 7 (18.4%) |
| 35 to 64 Years | 7 (10.6%) | 7 (10.6%) |
| 65 to 74 Years | 3 (60.0%) | 0 (0.0%) |
| 75 Years and over | 6 (100.0%) | 8 (100.0%) |
Disability Class by Sex by Age in Seville
Disability Class: Hearing Difficulty
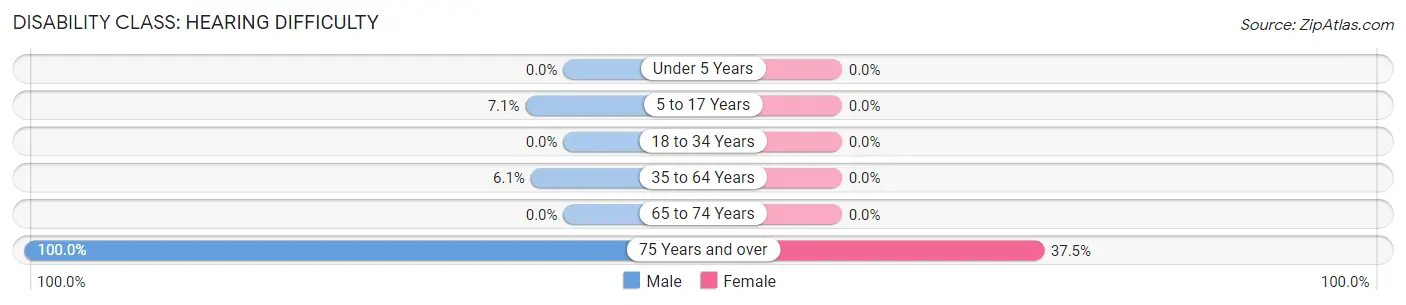
| Age Bracket | Male | Female |
| Under 5 Years | 0 (0.0%) | 0 (0.0%) |
| 5 to 17 Years | 6 (7.1%) | 0 (0.0%) |
| 18 to 34 Years | 0 (0.0%) | 0 (0.0%) |
| 35 to 64 Years | 4 (6.1%) | 0 (0.0%) |
| 65 to 74 Years | 0 (0.0%) | 0 (0.0%) |
| 75 Years and over | 6 (100.0%) | 3 (37.5%) |
Disability Class: Vision Difficulty
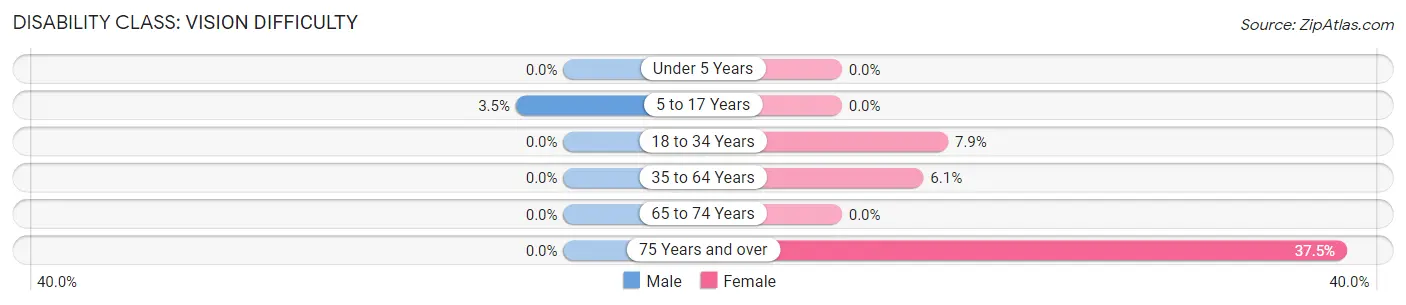
| Age Bracket | Male | Female |
| Under 5 Years | 0 (0.0%) | 0 (0.0%) |
| 5 to 17 Years | 3 (3.5%) | 0 (0.0%) |
| 18 to 34 Years | 0 (0.0%) | 3 (7.9%) |
| 35 to 64 Years | 0 (0.0%) | 4 (6.1%) |
| 65 to 74 Years | 0 (0.0%) | 0 (0.0%) |
| 75 Years and over | 0 (0.0%) | 3 (37.5%) |
Disability Class: Cognitive Difficulty
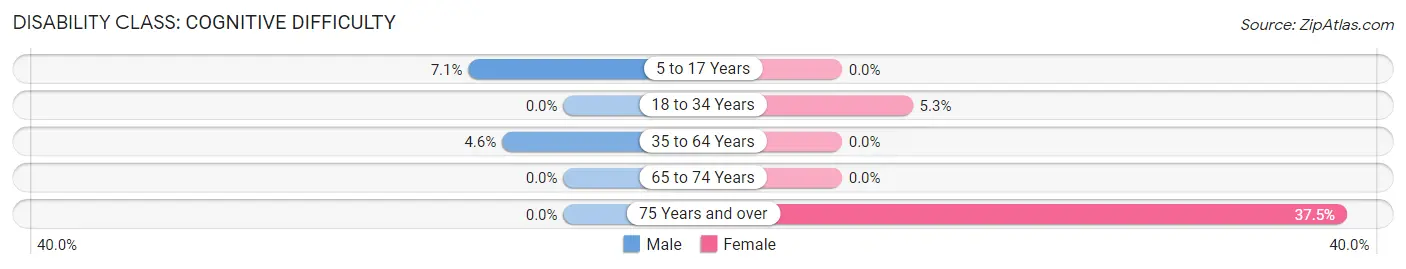
| Age Bracket | Male | Female |
| 5 to 17 Years | 6 (7.1%) | 0 (0.0%) |
| 18 to 34 Years | 0 (0.0%) | 2 (5.3%) |
| 35 to 64 Years | 3 (4.5%) | 0 (0.0%) |
| 65 to 74 Years | 0 (0.0%) | 0 (0.0%) |
| 75 Years and over | 0 (0.0%) | 3 (37.5%) |
Disability Class: Ambulatory Difficulty
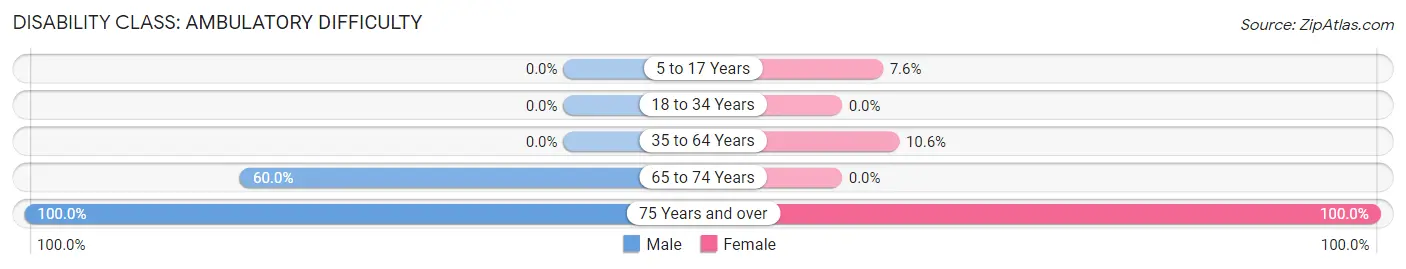
| Age Bracket | Male | Female |
| 5 to 17 Years | 0 (0.0%) | 6 (7.6%) |
| 18 to 34 Years | 0 (0.0%) | 0 (0.0%) |
| 35 to 64 Years | 0 (0.0%) | 7 (10.6%) |
| 65 to 74 Years | 3 (60.0%) | 0 (0.0%) |
| 75 Years and over | 6 (100.0%) | 8 (100.0%) |
Disability Class: Self-Care Difficulty
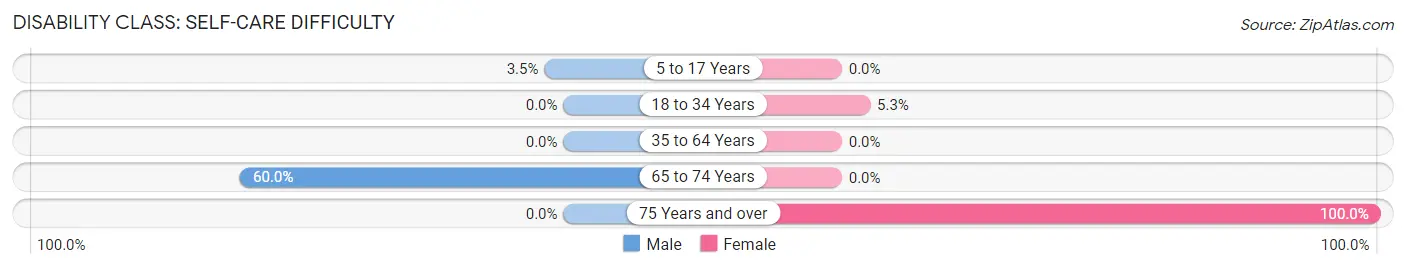
| Age Bracket | Male | Female |
| 5 to 17 Years | 3 (3.5%) | 0 (0.0%) |
| 18 to 34 Years | 0 (0.0%) | 2 (5.3%) |
| 35 to 64 Years | 0 (0.0%) | 0 (0.0%) |
| 65 to 74 Years | 3 (60.0%) | 0 (0.0%) |
| 75 Years and over | 0 (0.0%) | 8 (100.0%) |
Technology Access in Seville
Computing Device Access in Seville
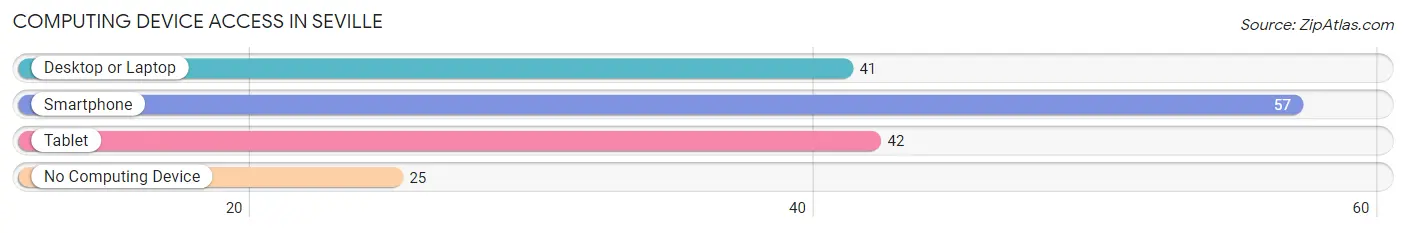
| Device Type | # Households | % Households |
| Desktop or Laptop | 41 | 45.6% |
| Smartphone | 57 | 63.3% |
| Tablet | 42 | 46.7% |
| No Computing Device | 25 | 27.8% |
| Total | 90 | 100.0% |
Internet Access in Seville
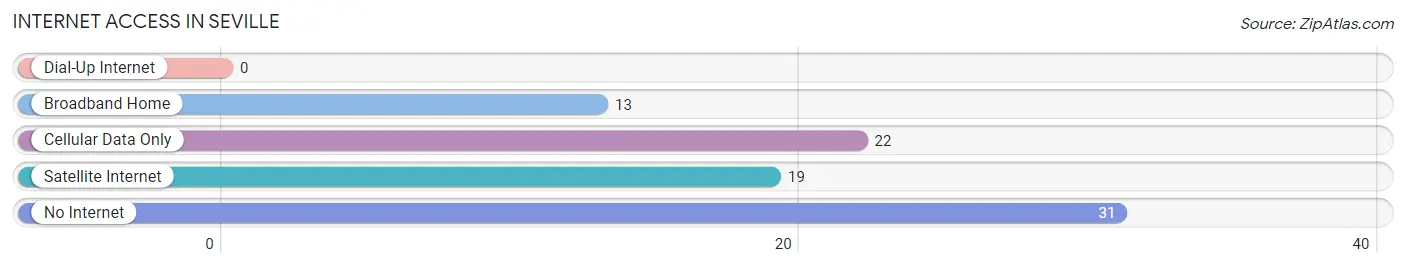
| Internet Type | # Households | % Households |
| Dial-Up Internet | 0 | 0.0% |
| Broadband Home | 13 | 14.4% |
| Cellular Data Only | 22 | 24.4% |
| Satellite Internet | 19 | 21.1% |
| No Internet | 31 | 34.4% |
| Total | 90 | 100.0% |
Seville Summary
Seville is a small city located in San Diego County, California. It is situated in the foothills of the Palomar Mountains, about 25 miles northeast of San Diego. The city has a population of approximately 3,000 people and covers an area of about 2.5 square miles.
History
Seville was founded in 1887 by a group of settlers from the Midwest. The settlers were attracted to the area by its mild climate and abundant natural resources. The city was named after the Spanish city of Seville, which was the birthplace of one of the settlers.
The city grew slowly over the years, and by the early 1900s, it had become a popular tourist destination. The city was known for its hot springs, which were believed to have healing properties. In the 1920s, the city was home to a number of resorts, including the Seville Hotel and the Seville Inn.
In the 1950s, the city began to experience a period of growth and development. The city was incorporated in 1957, and the population grew to over 3,000 by the 1970s.
Geography
Seville is located in the foothills of the Palomar Mountains, about 25 miles northeast of San Diego. The city is situated at an elevation of about 1,000 feet above sea level. The city is surrounded by rolling hills and is home to a number of parks and open spaces.
The climate in Seville is mild and temperate, with warm summers and cool winters. The average annual temperature is around 70 degrees Fahrenheit. The city receives an average of about 15 inches of rain per year.
Economy
Seville’s economy is largely based on tourism and agriculture. The city is home to a number of resorts and hotels, as well as a number of wineries and vineyards. The city is also home to a number of small businesses, including restaurants, retail stores, and professional services.
The city is also home to a number of manufacturing companies, including a number of aerospace and defense contractors. The city is also home to a number of technology companies, including a number of software and internet companies.
Demographics
As of the 2010 census, the population of Seville was 3,072. The population is largely white (83.3%), with a small Hispanic population (7.2%). The median household income is $63,917, and the median age is 44.
Seville is a small city with a rich history and a vibrant economy. The city is home to a number of resorts and businesses, as well as a number of technology companies. The city is also home to a diverse population, with a mix of white, Hispanic, and other ethnicities.
Common Questions
What is Per Capita Income in Seville?
Per Capita income in Seville is $11,728.
What is the Median Family Income in Seville?
Median Family Income in Seville is $44,844.
What is the Median Household income in Seville?
Median Household Income in Seville is $39,500.
What is Income or Wage Gap in Seville?
Income or Wage Gap in Seville is 16.1%.
Women in Seville earn 83.9 cents for every dollar earned by a man.
What is Inequality or Gini Index in Seville?
Inequality or Gini Index in Seville is 0.36.
What is the Total Population of Seville?
Total Population of Seville is 411.
What is the Total Male Population of Seville?
Total Male Population of Seville is 204.
What is the Total Female Population of Seville?
Total Female Population of Seville is 207.
What is the Ratio of Males per 100 Females in Seville?
There are 98.55 Males per 100 Females in Seville.
What is the Ratio of Females per 100 Males in Seville?
There are 101.47 Females per 100 Males in Seville.
What is the Median Population Age in Seville?
Median Population Age in Seville is 21.1 Years.
What is the Average Family Size in Seville
Average Family Size in Seville is 5.2 People.
What is the Average Household Size in Seville
Average Household Size in Seville is 4.6 People.
How Large is the Labor Force in Seville?
There are 144 People in the Labor Forcein in Seville.
What is the Percentage of People in the Labor Force in Seville?
57.6% of People are in the Labor Force in Seville.
What is the Unemployment Rate in Seville?
Unemployment Rate in Seville is 13.9%.