Smartsville, CA Map & Demographics
Smartsville Map
Smartsville Overview
$24,647
PER CAPITA INCOME
$76,581
AVG FAMILY INCOME
$76,213
AVG HOUSEHOLD INCOME
0.20
INEQUALITY / GINI INDEX
379
TOTAL POPULATION
219
MALE POPULATION
160
FEMALE POPULATION
136.88
MALES / 100 FEMALES
73.06
FEMALES / 100 MALES
30.5
MEDIAN AGE
4.8
AVG FAMILY SIZE
3.5
AVG HOUSEHOLD SIZE
71
LABOR FORCE [ PEOPLE ]
22.7%
PERCENT IN LABOR FORCE
Smartsville Zip Codes
Smartsville Area Codes
Income in Smartsville
Income Overview in Smartsville
Per Capita Income in Smartsville is $24,647, while median incomes of families and households are $76,581 and $76,213 respectively.
| Characteristic | Number | Measure |
| Per Capita Income | 379 | $24,647 |
| Median Family Income | 71 | $76,581 |
| Mean Family Income | 71 | $93,701 |
| Median Household Income | 109 | $76,213 |
| Mean Household Income | 109 | $83,658 |
| Income Deficit | 71 | $0 |
| Wage / Income Gap (%) | 379 | 0.00% |
| Wage / Income Gap ($) | 379 | 100.00¢ per $1 |
| Gini / Inequality Index | 379 | 0.20 |
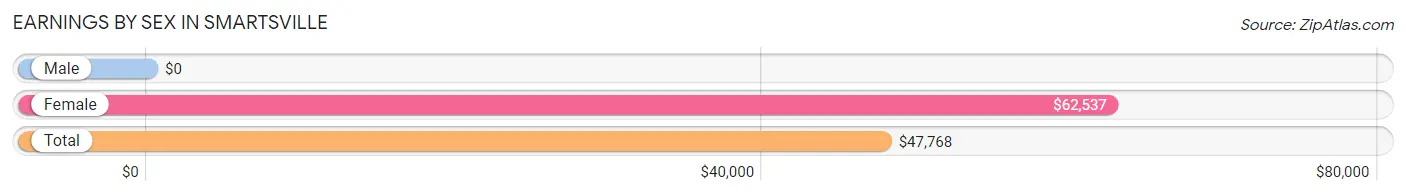
Earnings by Sex in Smartsville
| Sex | Number | Average Earnings |
| Male | 54 (44.6%) | $0 |
| Female | 67 (55.4%) | $62,537 |
| Total | 121 (100.0%) | $47,768 |
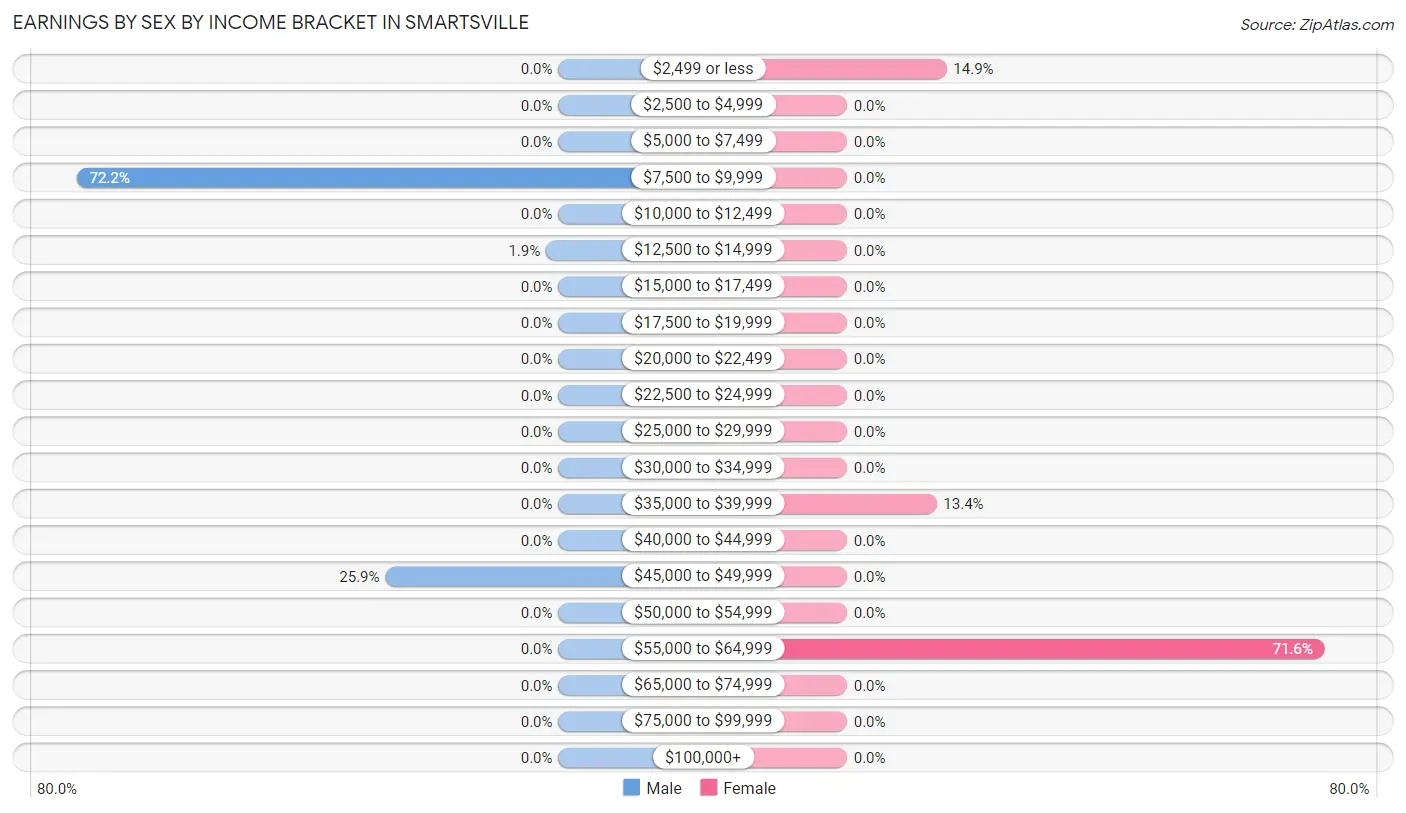
Earnings by Sex by Income Bracket in Smartsville
The most common earnings brackets in Smartsville are $7,500 to $9,999 for men (39 | 72.2%) and $55,000 to $64,999 for women (48 | 71.6%).
| Income | Male | Female |
| $2,499 or less | 0 (0.0%) | 10 (14.9%) |
| $2,500 to $4,999 | 0 (0.0%) | 0 (0.0%) |
| $5,000 to $7,499 | 0 (0.0%) | 0 (0.0%) |
| $7,500 to $9,999 | 39 (72.2%) | 0 (0.0%) |
| $10,000 to $12,499 | 0 (0.0%) | 0 (0.0%) |
| $12,500 to $14,999 | 1 (1.8%) | 0 (0.0%) |
| $15,000 to $17,499 | 0 (0.0%) | 0 (0.0%) |
| $17,500 to $19,999 | 0 (0.0%) | 0 (0.0%) |
| $20,000 to $22,499 | 0 (0.0%) | 0 (0.0%) |
| $22,500 to $24,999 | 0 (0.0%) | 0 (0.0%) |
| $25,000 to $29,999 | 0 (0.0%) | 0 (0.0%) |
| $30,000 to $34,999 | 0 (0.0%) | 0 (0.0%) |
| $35,000 to $39,999 | 0 (0.0%) | 9 (13.4%) |
| $40,000 to $44,999 | 0 (0.0%) | 0 (0.0%) |
| $45,000 to $49,999 | 14 (25.9%) | 0 (0.0%) |
| $50,000 to $54,999 | 0 (0.0%) | 0 (0.0%) |
| $55,000 to $64,999 | 0 (0.0%) | 48 (71.6%) |
| $65,000 to $74,999 | 0 (0.0%) | 0 (0.0%) |
| $75,000 to $99,999 | 0 (0.0%) | 0 (0.0%) |
| $100,000+ | 0 (0.0%) | 0 (0.0%) |
| Total | 54 (100.0%) | 67 (100.0%) |
Earnings by Sex by Educational Attainment in Smartsville
| Educational Attainment | Male Income | Female Income |
| Less than High School | - | - |
| High School Diploma | - | - |
| College or Associate's Degree | - | - |
| Bachelor's Degree | - | - |
| Graduate Degree | - | - |
| Total | - | - |
Family Income in Smartsville
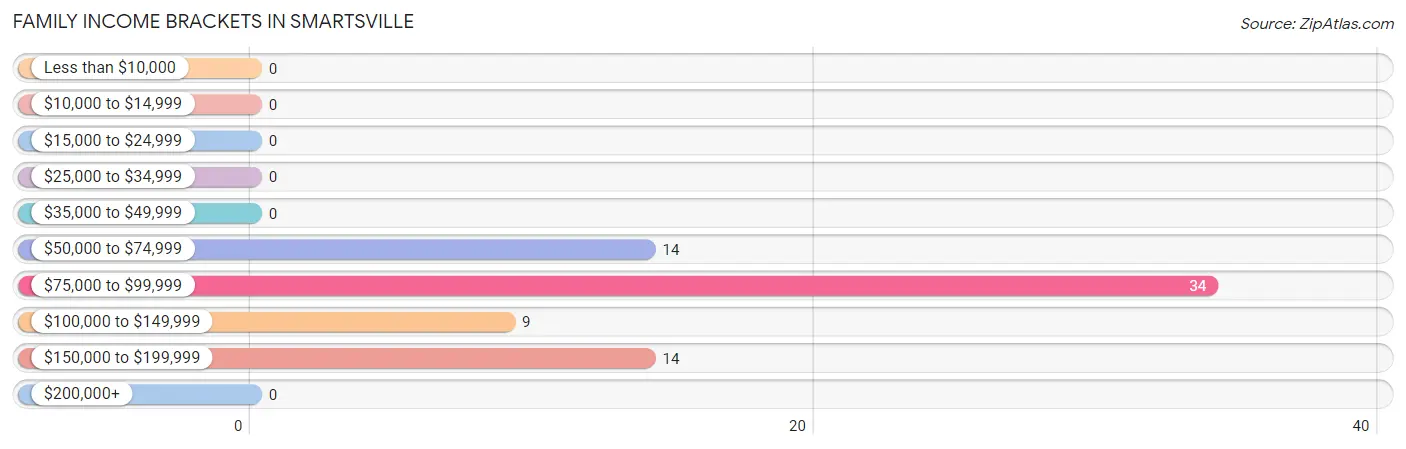
Family Income Brackets in Smartsville
According to the Smartsville family income data, there are 34 families falling into the $75,000 to $99,999 income range, which is the most common income bracket and makes up 47.9% of all families.
| Income Bracket | # Families | % Families |
| Less than $10,000 | 0 | 0.0% |
| $10,000 to $14,999 | 0 | 0.0% |
| $15,000 to $24,999 | 0 | 0.0% |
| $25,000 to $34,999 | 0 | 0.0% |
| $35,000 to $49,999 | 0 | 0.0% |
| $50,000 to $74,999 | 14 | 19.7% |
| $75,000 to $99,999 | 34 | 47.9% |
| $100,000 to $149,999 | 9 | 12.7% |
| $150,000 to $199,999 | 14 | 19.7% |
| $200,000+ | 0 | 0.0% |
Family Income by Famaliy Size in Smartsville
| Income Bracket | # Families | Median Income |
| 2-Person Families | 14 (19.7%) | $0 |
| 3-Person Families | 34 (47.9%) | $0 |
| 4-Person Families | 0 (0.0%) | $0 |
| 5-Person Families | 9 (12.7%) | $0 |
| 6-Person Families | 0 (0.0%) | $0 |
| 7+ Person Families | 14 (19.7%) | $0 |
| Total | 71 (100.0%) | $76,581 |
Family Income by Number of Earners in Smartsville
| Number of Earners | # Families | Median Income |
| No Earners | 14 (19.7%) | $0 |
| 1 Earner | 23 (32.4%) | $0 |
| 2 Earners | 34 (47.9%) | $0 |
| 3+ Earners | 0 (0.0%) | $0 |
| Total | 71 (100.0%) | $76,581 |
Household Income in Smartsville
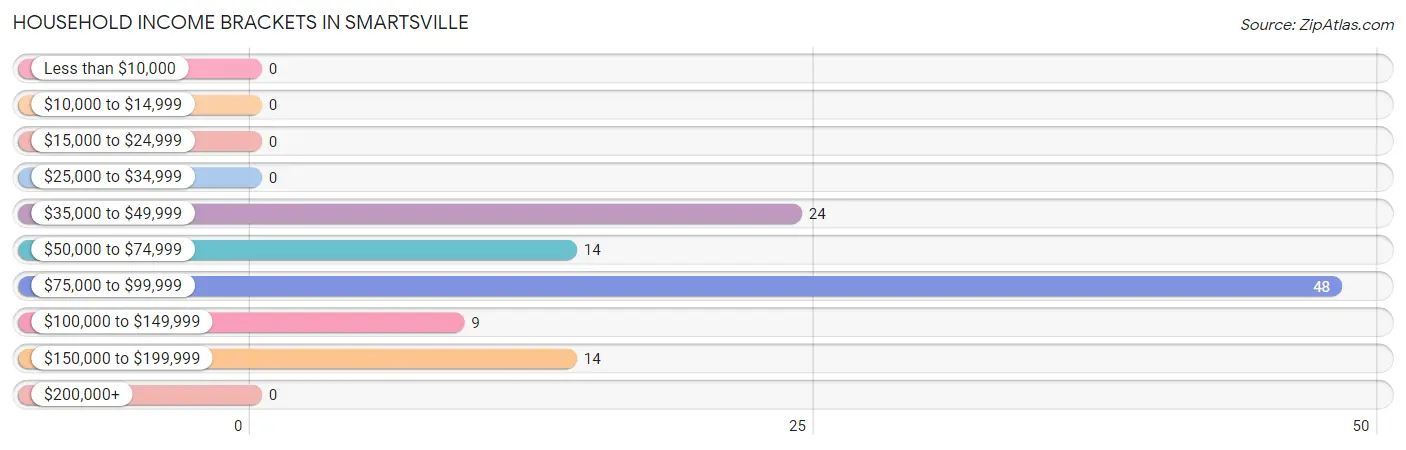
Household Income Brackets in Smartsville
With 48 households falling in the category, the $75,000 to $99,999 income range is the most frequent in Smartsville, accounting for 44.0% of all households.
| Income Bracket | # Households | % Households |
| Less than $10,000 | 0 | 0.0% |
| $10,000 to $14,999 | 0 | 0.0% |
| $15,000 to $24,999 | 0 | 0.0% |
| $25,000 to $34,999 | 0 | 0.0% |
| $35,000 to $49,999 | 24 | 22.0% |
| $50,000 to $74,999 | 14 | 12.8% |
| $75,000 to $99,999 | 48 | 44.0% |
| $100,000 to $149,999 | 9 | 8.3% |
| $150,000 to $199,999 | 14 | 12.8% |
| $200,000+ | 0 | 0.0% |
Household Income by Householder Age in Smartsville
The median household income in Smartsville is $76,213, with the highest median household income of $96,161 found in the 65+ years age bracket for the primary householder. A total of 33 households (30.3%) fall into this category.
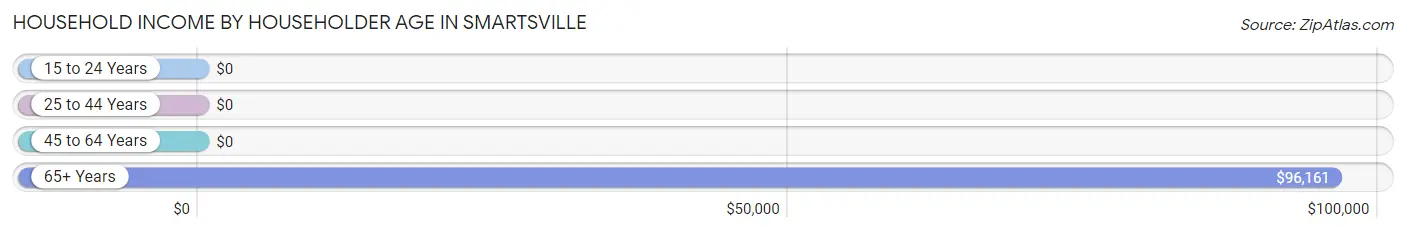
| Income Bracket | # Households | Median Income |
| 15 to 24 Years | 0 (0.0%) | $0 |
| 25 to 44 Years | 48 (44.0%) | $0 |
| 45 to 64 Years | 28 (25.7%) | $0 |
| 65+ Years | 33 (30.3%) | $96,161 |
| Total | 109 (100.0%) | $76,213 |
Poverty in Smartsville
Income Below Poverty by Sex and Age in Smartsville
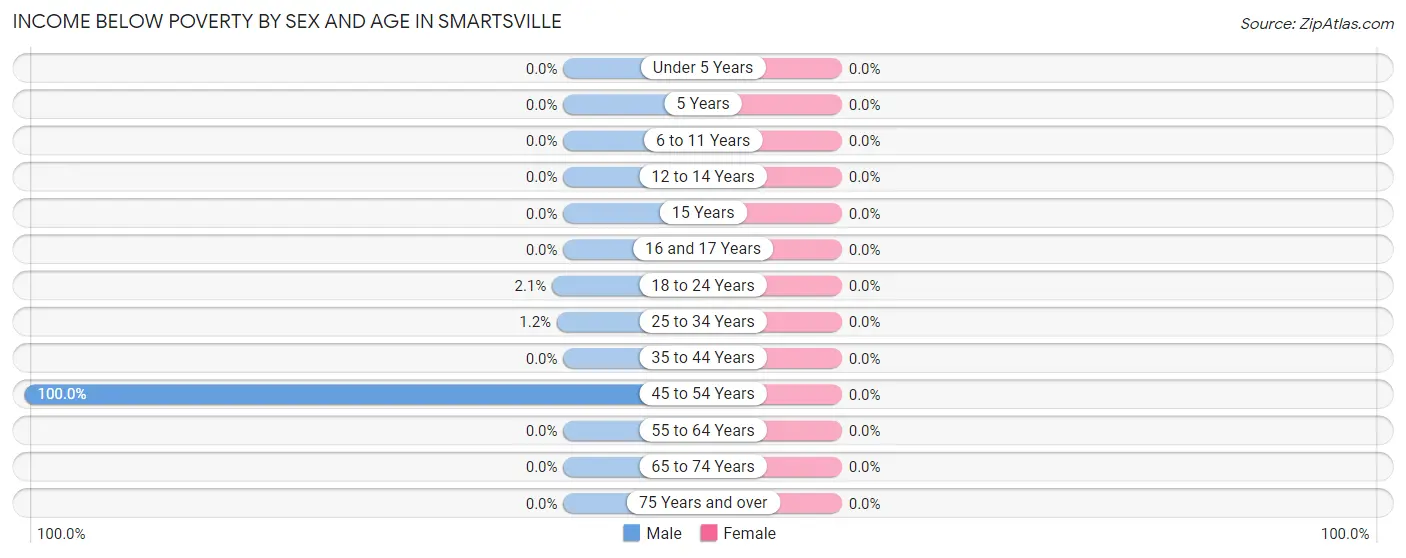
| Age Bracket | Male | Female |
| Under 5 Years | 0 (0.0%) | 0 (0.0%) |
| 5 Years | 0 (0.0%) | 0 (0.0%) |
| 6 to 11 Years | 0 (0.0%) | 0 (0.0%) |
| 12 to 14 Years | 0 (0.0%) | 0 (0.0%) |
| 15 Years | 0 (0.0%) | 0 (0.0%) |
| 16 and 17 Years | 0 (0.0%) | 0 (0.0%) |
| 18 to 24 Years | 1 (2.1%) | 0 (0.0%) |
| 25 to 34 Years | 1 (1.2%) | 0 (0.0%) |
| 35 to 44 Years | 0 (0.0%) | 0 (0.0%) |
| 45 to 54 Years | 1 (100.0%) | 0 (0.0%) |
| 55 to 64 Years | 0 (0.0%) | 0 (0.0%) |
| 65 to 74 Years | 0 (0.0%) | 0 (0.0%) |
| 75 Years and over | 0 (0.0%) | 0 (0.0%) |
| Total | 3 (1.4%) | 0 (0.0%) |
Income Above Poverty by Sex and Age in Smartsville
According to the poverty statistics in Smartsville, males aged 6 to 11 years and females aged 6 to 11 years are the age groups that are most secure financially, with 100.0% of males and 100.0% of females in these age groups living above the poverty line.
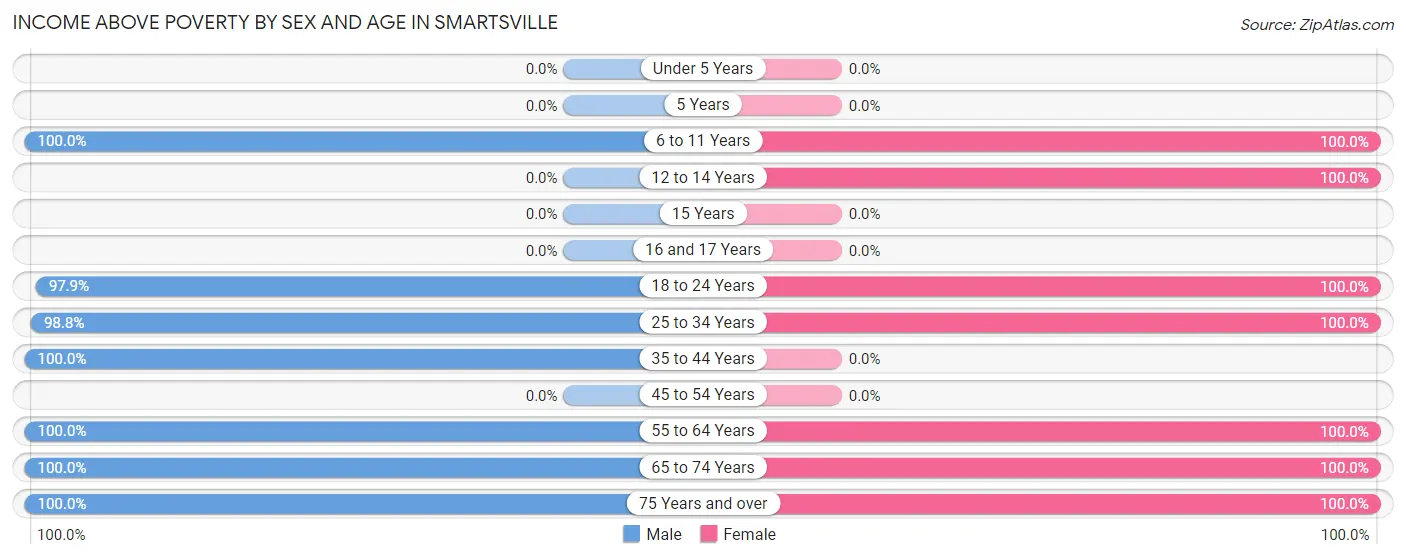
| Age Bracket | Male | Female |
| Under 5 Years | 0 (0.0%) | 0 (0.0%) |
| 5 Years | 0 (0.0%) | 0 (0.0%) |
| 6 to 11 Years | 39 (100.0%) | 11 (100.0%) |
| 12 to 14 Years | 0 (0.0%) | 16 (100.0%) |
| 15 Years | 0 (0.0%) | 0 (0.0%) |
| 16 and 17 Years | 0 (0.0%) | 0 (0.0%) |
| 18 to 24 Years | 47 (97.9%) | 12 (100.0%) |
| 25 to 34 Years | 83 (98.8%) | 43 (100.0%) |
| 35 to 44 Years | 14 (100.0%) | 0 (0.0%) |
| 45 to 54 Years | 0 (0.0%) | 0 (0.0%) |
| 55 to 64 Years | 7 (100.0%) | 37 (100.0%) |
| 65 to 74 Years | 9 (100.0%) | 10 (100.0%) |
| 75 Years and over | 17 (100.0%) | 31 (100.0%) |
| Total | 216 (98.6%) | 160 (100.0%) |
Income Below Poverty Among Married-Couple Families in Smartsville
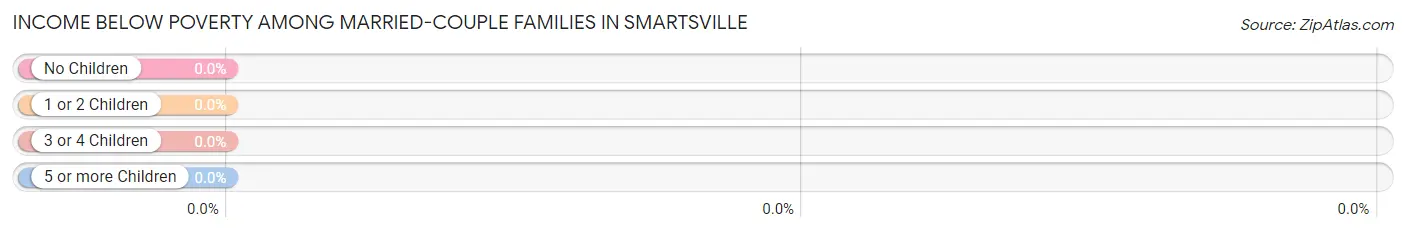
| Children | Above Poverty | Below Poverty |
| No Children | 0 (0.0%) | 0 (0.0%) |
| 1 or 2 Children | 57 (100.0%) | 0 (0.0%) |
| 3 or 4 Children | 0 (0.0%) | 0 (0.0%) |
| 5 or more Children | 0 (0.0%) | 0 (0.0%) |
| Total | 57 (100.0%) | 0 (0.0%) |
Income Below Poverty Among Single-Parent Households in Smartsville
| Children | Single Father | Single Mother |
| No Children | 0 (0.0%) | 0 (0.0%) |
| 1 or 2 Children | 0 (0.0%) | 0 (0.0%) |
| 3 or 4 Children | 0 (0.0%) | 0 (0.0%) |
| 5 or more Children | 0 (0.0%) | 0 (0.0%) |
| Total | 0 (0.0%) | 0 (0.0%) |
Income Below Poverty Among Married-Couple vs Single-Parent Households in Smartsville
| Children | Married-Couple Families | Single-Parent Households |
| No Children | 0 (0.0%) | 0 (0.0%) |
| 1 or 2 Children | 0 (0.0%) | 0 (0.0%) |
| 3 or 4 Children | 0 (0.0%) | 0 (0.0%) |
| 5 or more Children | 0 (0.0%) | 0 (0.0%) |
| Total | 0 (0.0%) | 0 (0.0%) |
Race in Smartsville
The most populous races in Smartsville are White / Caucasian (264 | 69.7%), Two or more Races (43 | 11.4%), and Hispanic or Latino (32 | 8.4%).
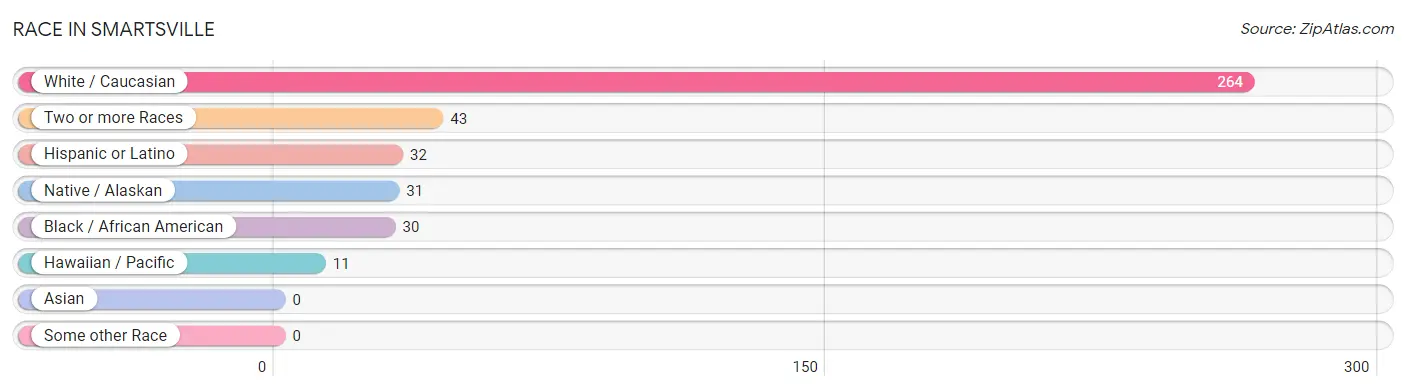
| Race | # Population | % Population |
| Asian | 0 | 0.0% |
| Black / African American | 30 | 7.9% |
| Hawaiian / Pacific | 11 | 2.9% |
| Hispanic or Latino | 32 | 8.4% |
| Native / Alaskan | 31 | 8.2% |
| White / Caucasian | 264 | 69.7% |
| Two or more Races | 43 | 11.4% |
| Some other Race | 0 | 0.0% |
| Total | 379 | 100.0% |
Ancestry in Smartsville
The most populous ancestries reported in Smartsville are European (69 | 18.2%), Portuguese (38 | 10.0%), German (35 | 9.2%), Mexican (32 | 8.4%), and Apache (31 | 8.2%), together accounting for 54.1% of all Smartsville residents.
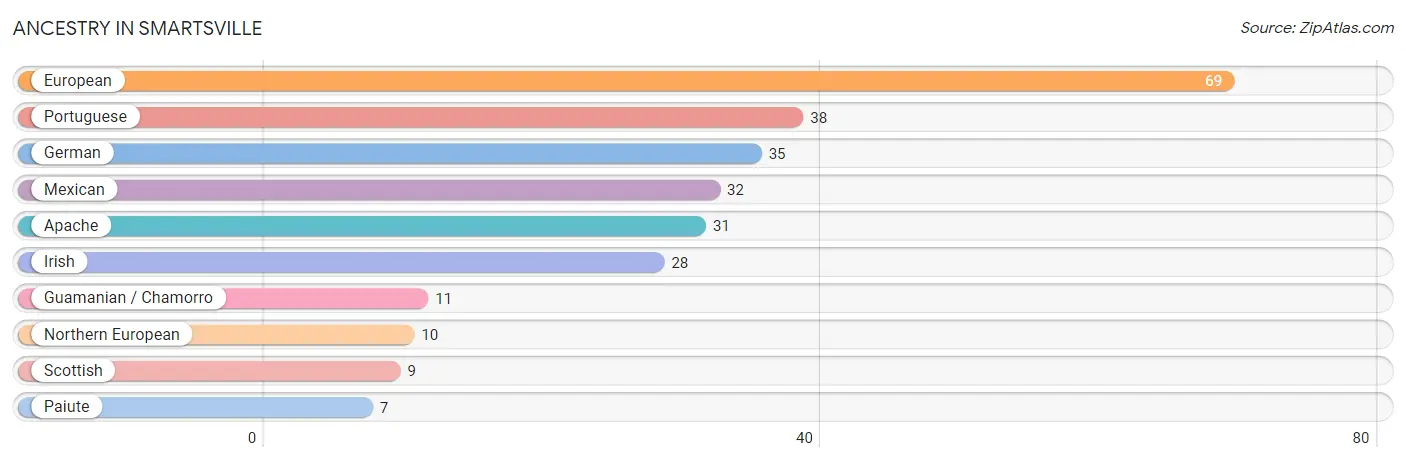
| Ancestry | # Population | % Population |
| Apache | 31 | 8.2% |
| European | 69 | 18.2% |
| German | 35 | 9.2% |
| Guamanian / Chamorro | 11 | 2.9% |
| Irish | 28 | 7.4% |
| Mexican | 32 | 8.4% |
| Northern European | 10 | 2.6% |
| Paiute | 7 | 1.8% |
| Portuguese | 38 | 10.0% |
| Scottish | 9 | 2.4% | View All 10 Rows |
Immigrants in Smartsville

| Immigration Origin | # Population | % Population | View All 0 Rows |
Sex and Age in Smartsville
Sex and Age in Smartsville
The most populous age groups in Smartsville are 20 to 24 Years (47 | 21.5%) for men and 30 to 34 Years (34 | 21.2%) for women.
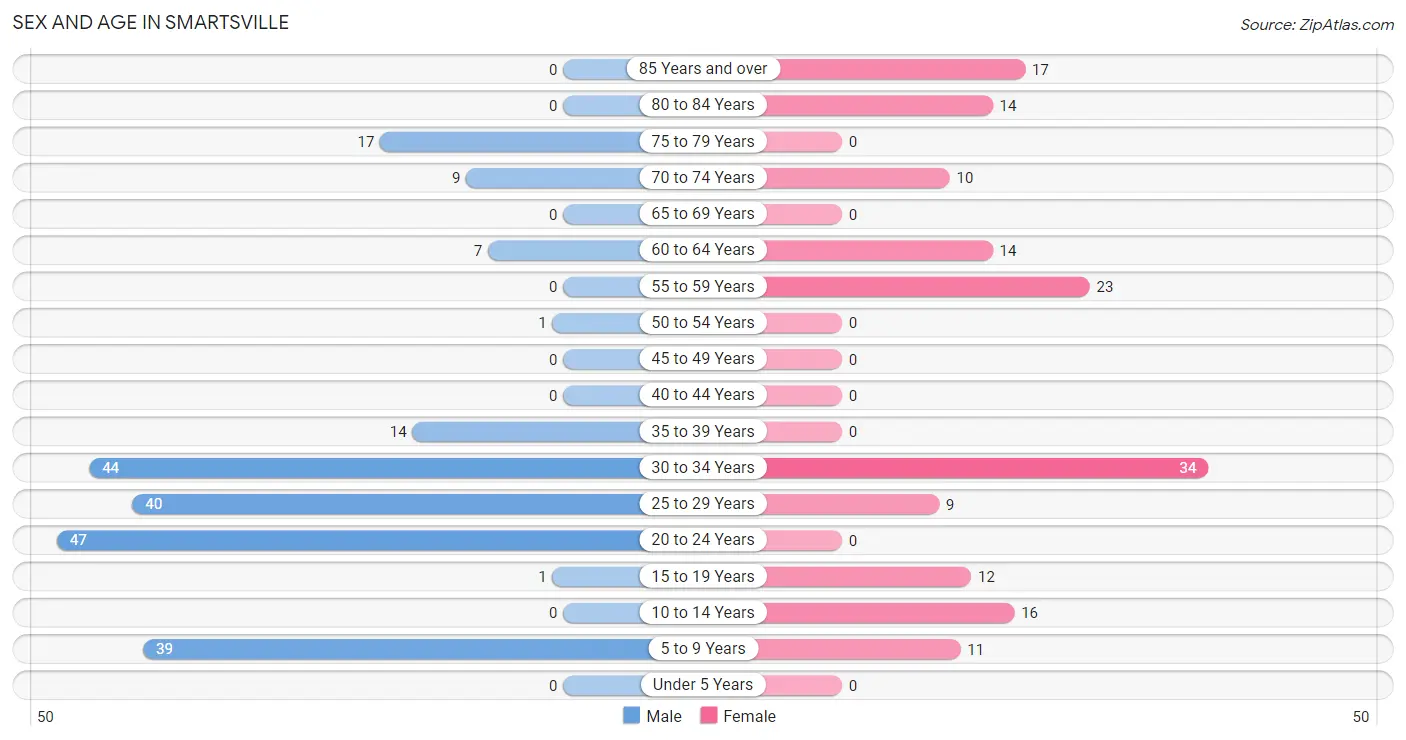
| Age Bracket | Male | Female |
| Under 5 Years | 0 (0.0%) | 0 (0.0%) |
| 5 to 9 Years | 39 (17.8%) | 11 (6.9%) |
| 10 to 14 Years | 0 (0.0%) | 16 (10.0%) |
| 15 to 19 Years | 1 (0.5%) | 12 (7.5%) |
| 20 to 24 Years | 47 (21.5%) | 0 (0.0%) |
| 25 to 29 Years | 40 (18.3%) | 9 (5.6%) |
| 30 to 34 Years | 44 (20.1%) | 34 (21.2%) |
| 35 to 39 Years | 14 (6.4%) | 0 (0.0%) |
| 40 to 44 Years | 0 (0.0%) | 0 (0.0%) |
| 45 to 49 Years | 0 (0.0%) | 0 (0.0%) |
| 50 to 54 Years | 1 (0.5%) | 0 (0.0%) |
| 55 to 59 Years | 0 (0.0%) | 23 (14.4%) |
| 60 to 64 Years | 7 (3.2%) | 14 (8.7%) |
| 65 to 69 Years | 0 (0.0%) | 0 (0.0%) |
| 70 to 74 Years | 9 (4.1%) | 10 (6.2%) |
| 75 to 79 Years | 17 (7.8%) | 0 (0.0%) |
| 80 to 84 Years | 0 (0.0%) | 14 (8.7%) |
| 85 Years and over | 0 (0.0%) | 17 (10.6%) |
| Total | 219 (100.0%) | 160 (100.0%) |
Families and Households in Smartsville
Median Family Size in Smartsville
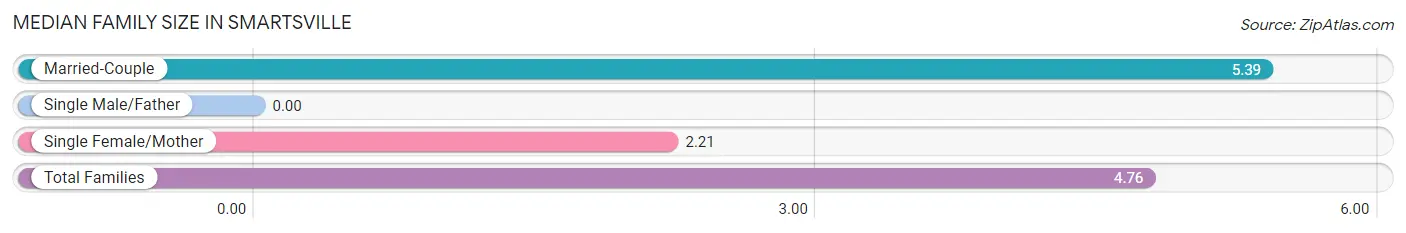
| Family Type | # Families | Family Size |
| Married-Couple | 57 (80.3%) | 5.39 |
| Single Male/Father | 0 (0.0%) | - |
| Single Female/Mother | 14 (19.7%) | 2.21 |
| Total Families | 71 (100.0%) | 4.76 |
Median Household Size in Smartsville
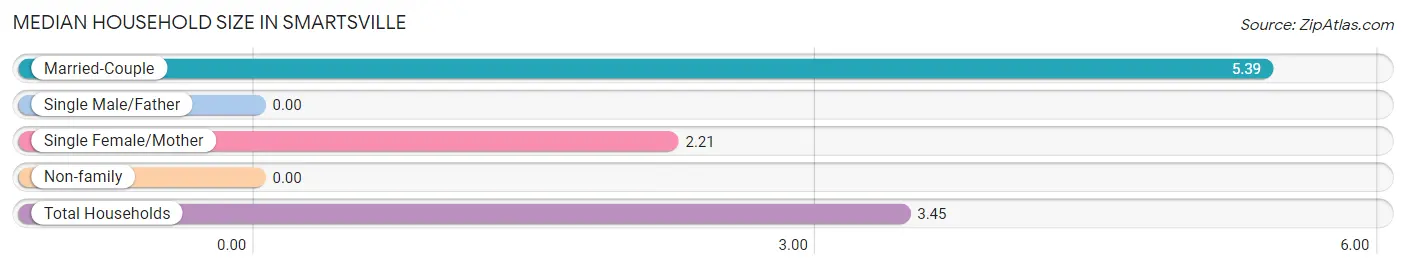
| Household Type | # Households | Household Size |
| Married-Couple | 57 (52.3%) | 5.39 |
| Single Male/Father | 0 (0.0%) | - |
| Single Female/Mother | 14 (12.8%) | 2.21 |
| Non-family | 38 (34.9%) | - |
| Total Households | 109 (100.0%) | 3.45 |
Household Size by Marriage Status in Smartsville
Out of a total of 109 households in Smartsville, 71 (65.1%) are family households, while 38 (34.9%) are nonfamily households. The most numerous type of family households are 3-person households, comprising 34, and the most common type of nonfamily households are 1-person households, comprising 38.
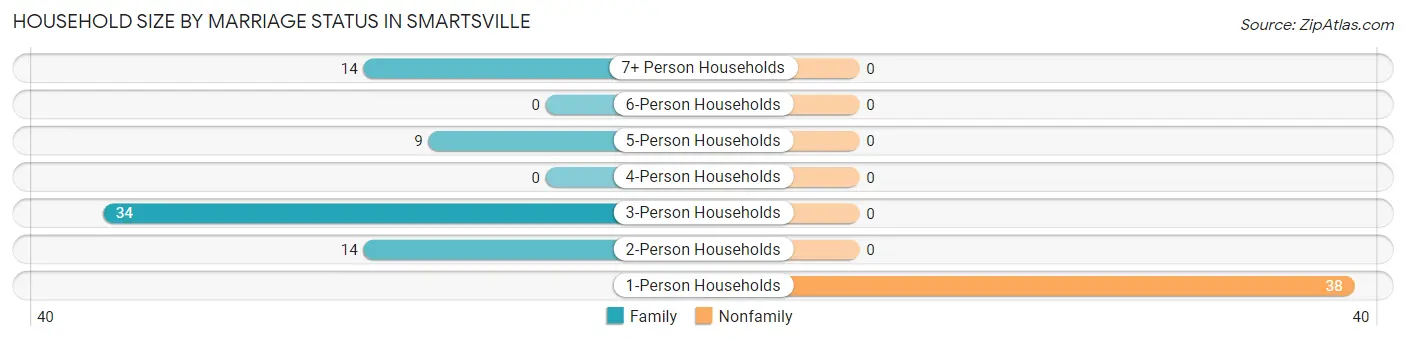
| Household Size | Family Households | Nonfamily Households |
| 1-Person Households | - | 38 (34.9%) |
| 2-Person Households | 14 (12.8%) | 0 (0.0%) |
| 3-Person Households | 34 (31.2%) | 0 (0.0%) |
| 4-Person Households | 0 (0.0%) | 0 (0.0%) |
| 5-Person Households | 9 (8.3%) | 0 (0.0%) |
| 6-Person Households | 0 (0.0%) | 0 (0.0%) |
| 7+ Person Households | 14 (12.8%) | 0 (0.0%) |
| Total | 71 (65.1%) | 38 (34.9%) |
Female Fertility in Smartsville
Fertility by Age in Smartsville
| Age Bracket | Women with Births | Births / 1,000 Women |
| 15 to 19 years | 0 (0.0%) | 0.0 |
| 20 to 34 years | 0 (0.0%) | 0.0 |
| 35 to 50 years | 0 (0.0%) | 0.0 |
| Total | 0 (0.0%) | 0.0 |
Fertility by Age by Marriage Status in Smartsville
| Age Bracket | Married | Unmarried |
| 15 to 19 years | 0 (0.0%) | 0 (0.0%) |
| 20 to 34 years | 0 (0.0%) | 0 (0.0%) |
| 35 to 50 years | 0 (0.0%) | 0 (0.0%) |
| Total | 0 (0.0%) | 0 (0.0%) |
Fertility by Education in Smartsville
| Educational Attainment | Women with Births | Births / 1,000 Women |
| Less than High School | 0 (0.0%) | 0.0 |
| High School Diploma | 0 (0.0%) | 0.0 |
| College or Associate's Degree | 0 (0.0%) | 0.0 |
| Bachelor's Degree | 0 (0.0%) | 0.0 |
| Graduate Degree | 0 (0.0%) | 0.0 |
| Total | 0 (0.0%) | 0.0 |
Fertility by Education by Marriage Status in Smartsville
| Educational Attainment | Married | Unmarried |
| Less than High School | 0 (0.0%) | 0 (0.0%) |
| High School Diploma | 0 (0.0%) | 0 (0.0%) |
| College or Associate's Degree | 0 (0.0%) | 0 (0.0%) |
| Bachelor's Degree | 0 (0.0%) | 0 (0.0%) |
| Graduate Degree | 0 (0.0%) | 0 (0.0%) |
| Total | 0 (0.0%) | 0 (0.0%) |
Employment Characteristics in Smartsville
Employment by Class of Employer in Smartsville
Among the 71 employed individuals in Smartsville, self-employed (not incorporated) (37 | 52.1%), and federal government employees (34 | 47.9%) make up the most common classes of employment.
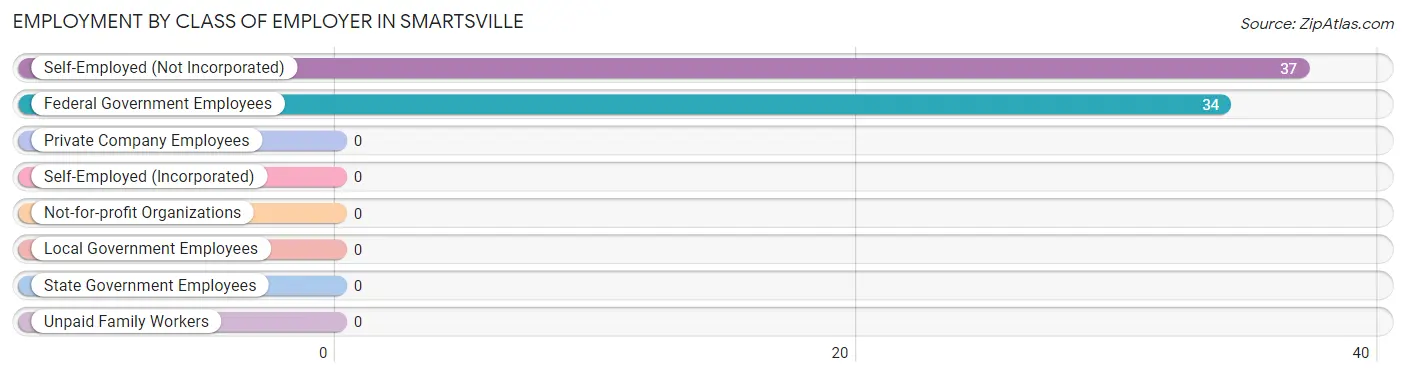
| Employer Class | # Employees | % Employees |
| Private Company Employees | 0 | 0.0% |
| Self-Employed (Incorporated) | 0 | 0.0% |
| Self-Employed (Not Incorporated) | 37 | 52.1% |
| Not-for-profit Organizations | 0 | 0.0% |
| Local Government Employees | 0 | 0.0% |
| State Government Employees | 0 | 0.0% |
| Federal Government Employees | 34 | 47.9% |
| Unpaid Family Workers | 0 | 0.0% |
| Total | 71 | 100.0% |
Employment Status by Age in Smartsville
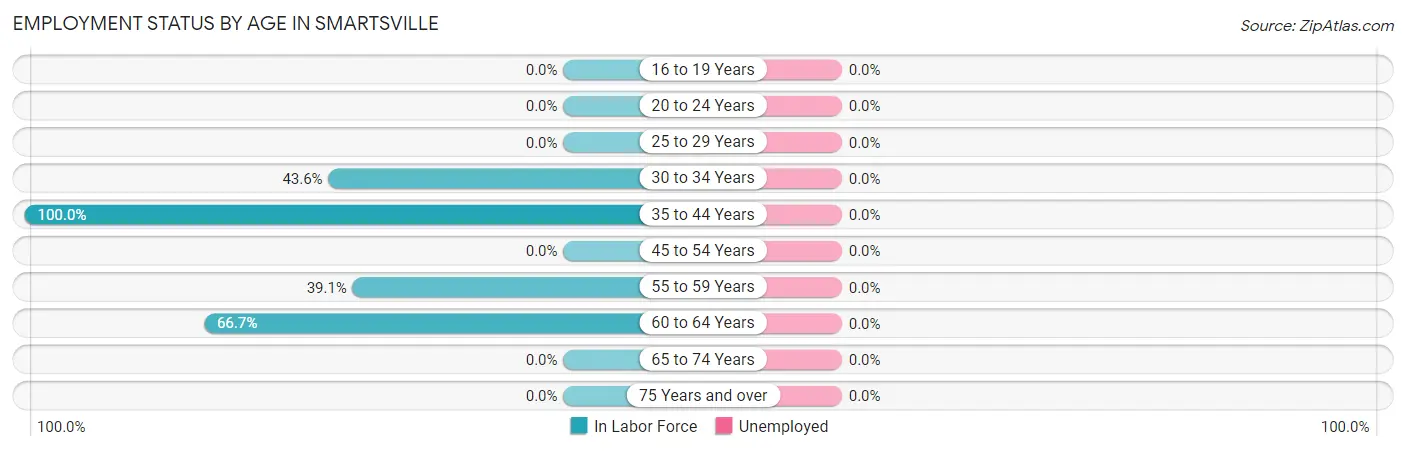
| Age Bracket | In Labor Force | Unemployed |
| 16 to 19 Years | 0 (0.0%) | 0 (0.0%) |
| 20 to 24 Years | 0 (0.0%) | 0 (0.0%) |
| 25 to 29 Years | 0 (0.0%) | 0 (0.0%) |
| 30 to 34 Years | 34 (43.6%) | 0 (0.0%) |
| 35 to 44 Years | 14 (100.0%) | 0 (0.0%) |
| 45 to 54 Years | 0 (0.0%) | 0 (0.0%) |
| 55 to 59 Years | 9 (39.1%) | 0 (0.0%) |
| 60 to 64 Years | 14 (66.7%) | 0 (0.0%) |
| 65 to 74 Years | 0 (0.0%) | 0 (0.0%) |
| 75 Years and over | 0 (0.0%) | 0 (0.0%) |
| Total | 71 (22.7%) | 0 (0.0%) |
Employment Status by Educational Attainment in Smartsville
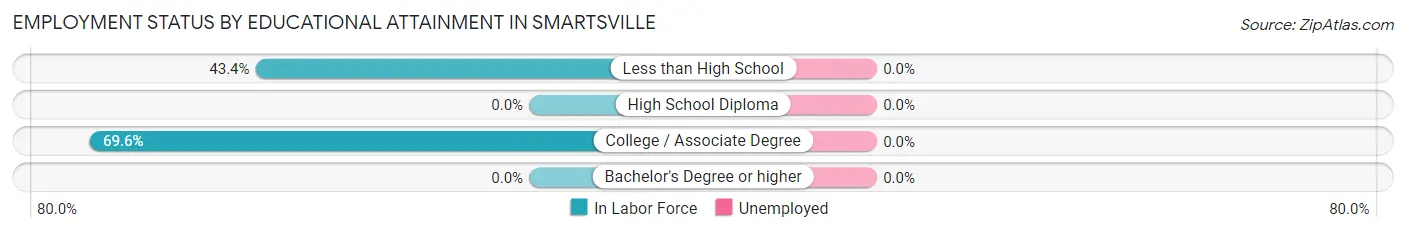
| Educational Attainment | In Labor Force | Unemployed |
| Less than High School | 23 (43.4%) | 0 (0.0%) |
| High School Diploma | 0 (0.0%) | 0 (0.0%) |
| College / Associate Degree | 48 (69.6%) | 0 (0.0%) |
| Bachelor's Degree or higher | 0 (0.0%) | 0 (0.0%) |
| Total | 71 (38.2%) | 0 (0.0%) |
Employment Occupations by Sex in Smartsville
Management, Business, Science and Arts Occupations
The most common Management, Business, Science and Arts occupations in Smartsville are , and Management (9 | 24.3%).
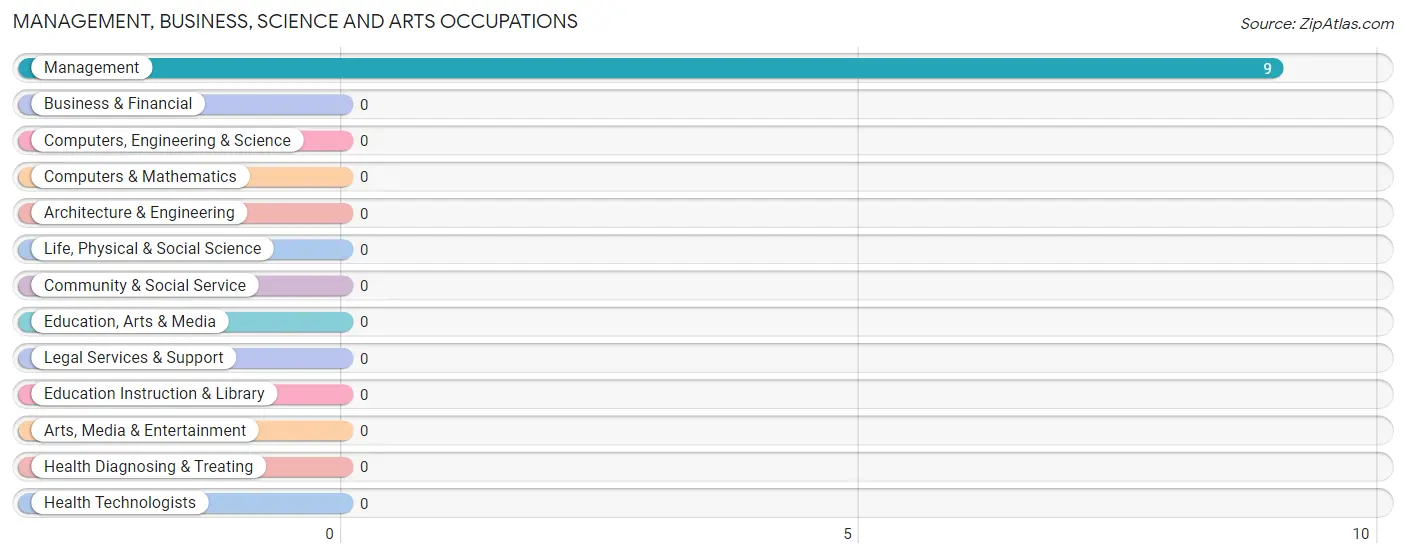
Management, Business, Science and Arts Occupations by Sex
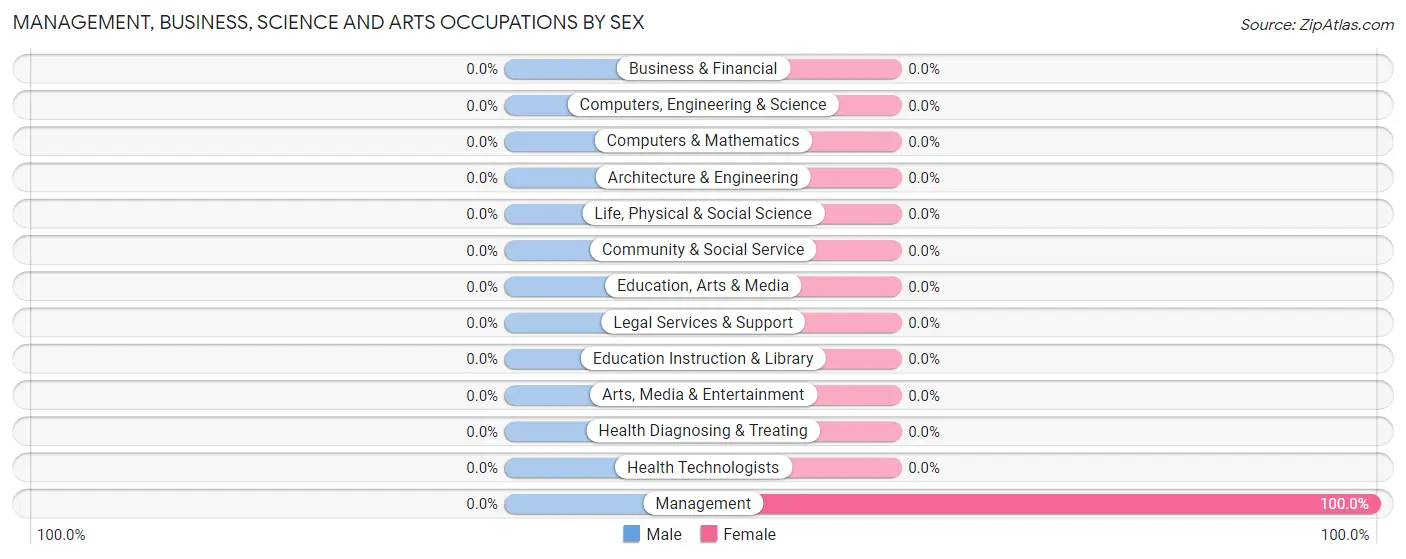
| Occupation | Male | Female |
| Management | 0 (0.0%) | 9 (100.0%) |
| Business & Financial | 0 (0.0%) | 0 (0.0%) |
| Computers, Engineering & Science | 0 (0.0%) | 0 (0.0%) |
| Computers & Mathematics | 0 (0.0%) | 0 (0.0%) |
| Architecture & Engineering | 0 (0.0%) | 0 (0.0%) |
| Life, Physical & Social Science | 0 (0.0%) | 0 (0.0%) |
| Community & Social Service | 0 (0.0%) | 0 (0.0%) |
| Education, Arts & Media | 0 (0.0%) | 0 (0.0%) |
| Legal Services & Support | 0 (0.0%) | 0 (0.0%) |
| Education Instruction & Library | 0 (0.0%) | 0 (0.0%) |
| Arts, Media & Entertainment | 0 (0.0%) | 0 (0.0%) |
| Health Diagnosing & Treating | 0 (0.0%) | 0 (0.0%) |
| Health Technologists | 0 (0.0%) | 0 (0.0%) |
| Total (Category) | 0 (0.0%) | 9 (100.0%) |
| Total (Overall) | 14 (37.8%) | 23 (62.2%) |
Services Occupations
The most common Services occupations in Smartsville are , and Cleaning & Maintenance (14 | 37.8%).
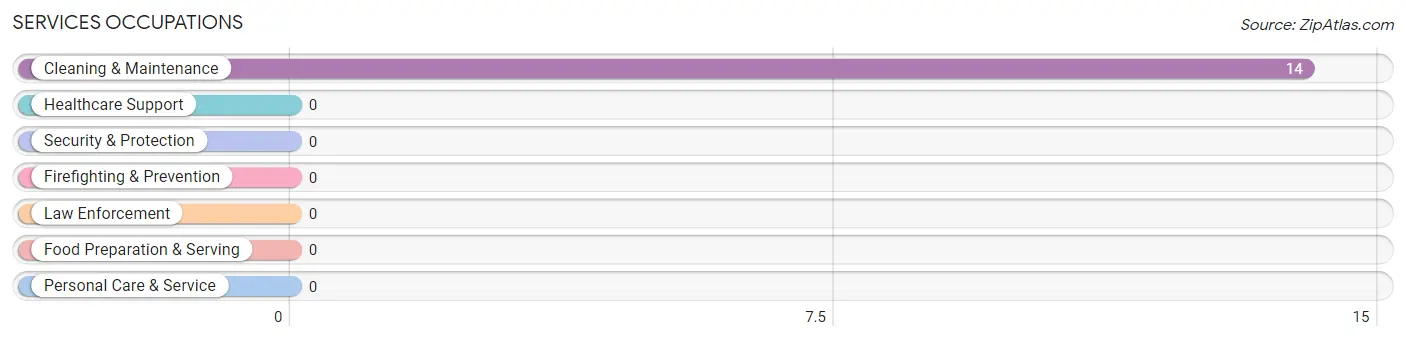
Services Occupations by Sex
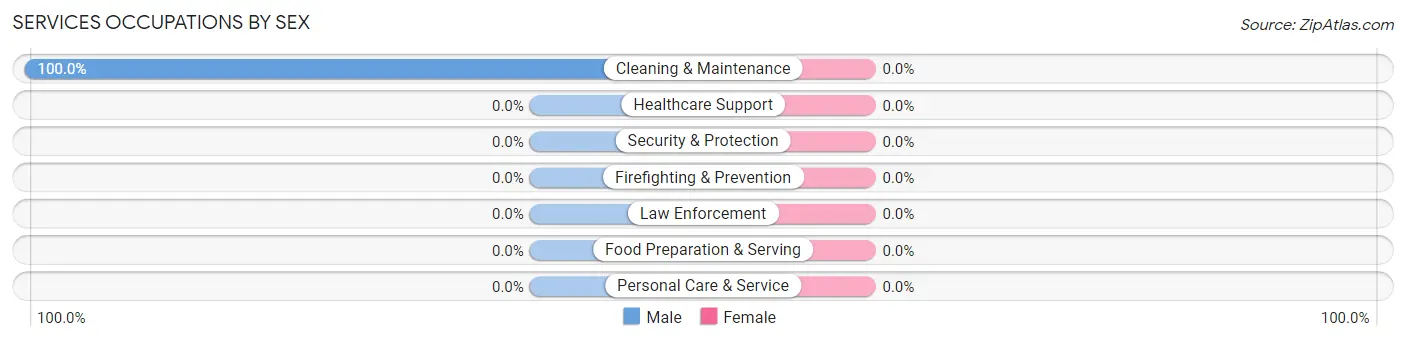
| Occupation | Male | Female |
| Healthcare Support | 0 (0.0%) | 0 (0.0%) |
| Security & Protection | 0 (0.0%) | 0 (0.0%) |
| Firefighting & Prevention | 0 (0.0%) | 0 (0.0%) |
| Law Enforcement | 0 (0.0%) | 0 (0.0%) |
| Food Preparation & Serving | 0 (0.0%) | 0 (0.0%) |
| Cleaning & Maintenance | 14 (100.0%) | 0 (0.0%) |
| Personal Care & Service | 0 (0.0%) | 0 (0.0%) |
| Total (Category) | 14 (100.0%) | 0 (0.0%) |
| Total (Overall) | 14 (37.8%) | 23 (62.2%) |
Sales and Office Occupations
The most common Sales and Office occupations in Smartsville are , and Office & Administration (14 | 37.8%).
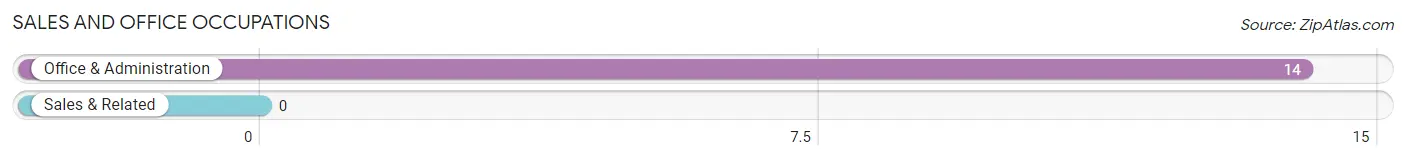
Sales and Office Occupations by Sex
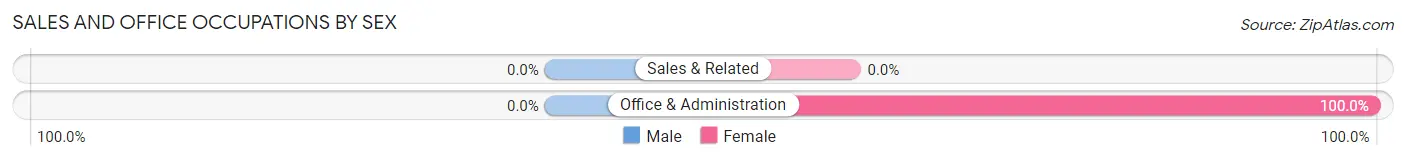
| Occupation | Male | Female |
| Sales & Related | 0 (0.0%) | 0 (0.0%) |
| Office & Administration | 0 (0.0%) | 14 (100.0%) |
| Total (Category) | 0 (0.0%) | 14 (100.0%) |
| Total (Overall) | 14 (37.8%) | 23 (62.2%) |
Natural Resources, Construction and Maintenance Occupations
Natural Resources, Construction and Maintenance Occupations by Sex
| Occupation | Male | Female |
| Farming, Fishing & Forestry | 0 (0.0%) | 0 (0.0%) |
| Construction & Extraction | 0 (0.0%) | 0 (0.0%) |
| Installation, Maintenance & Repair | 0 (0.0%) | 0 (0.0%) |
| Total (Category) | 0 (0.0%) | 0 (0.0%) |
| Total (Overall) | 14 (37.8%) | 23 (62.2%) |
Production, Transportation and Moving Occupations
Production, Transportation and Moving Occupations by Sex
| Occupation | Male | Female |
| Production | 0 (0.0%) | 0 (0.0%) |
| Transportation | 0 (0.0%) | 0 (0.0%) |
| Material Moving | 0 (0.0%) | 0 (0.0%) |
| Total (Category) | 0 (0.0%) | 0 (0.0%) |
| Total (Overall) | 14 (37.8%) | 23 (62.2%) |
Employment Industries by Sex in Smartsville
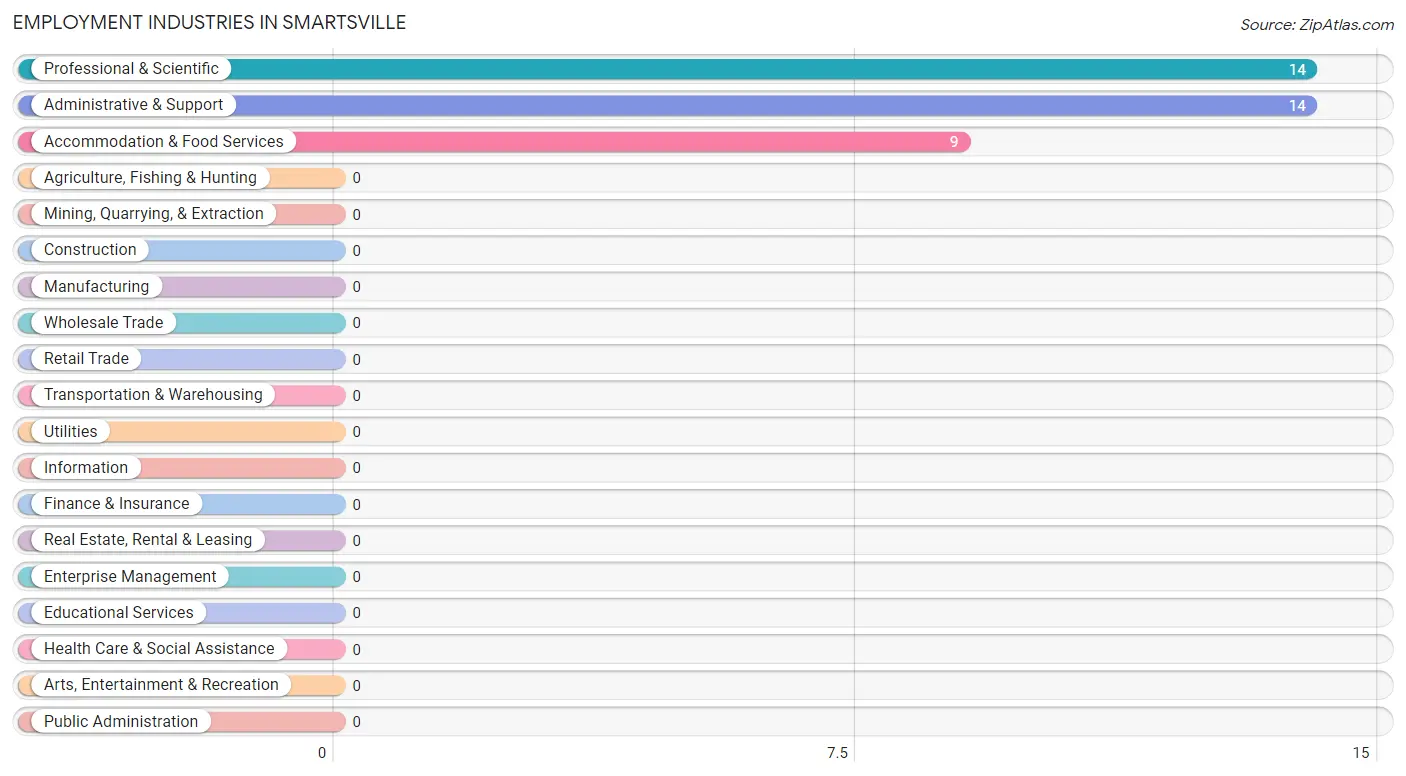
Employment Industries in Smartsville
The major employment industries in Smartsville include Professional & Scientific (14 | 37.8%), Administrative & Support (14 | 37.8%), and Accommodation & Food Services (9 | 24.3%).
Employment Industries by Sex in Smartsville
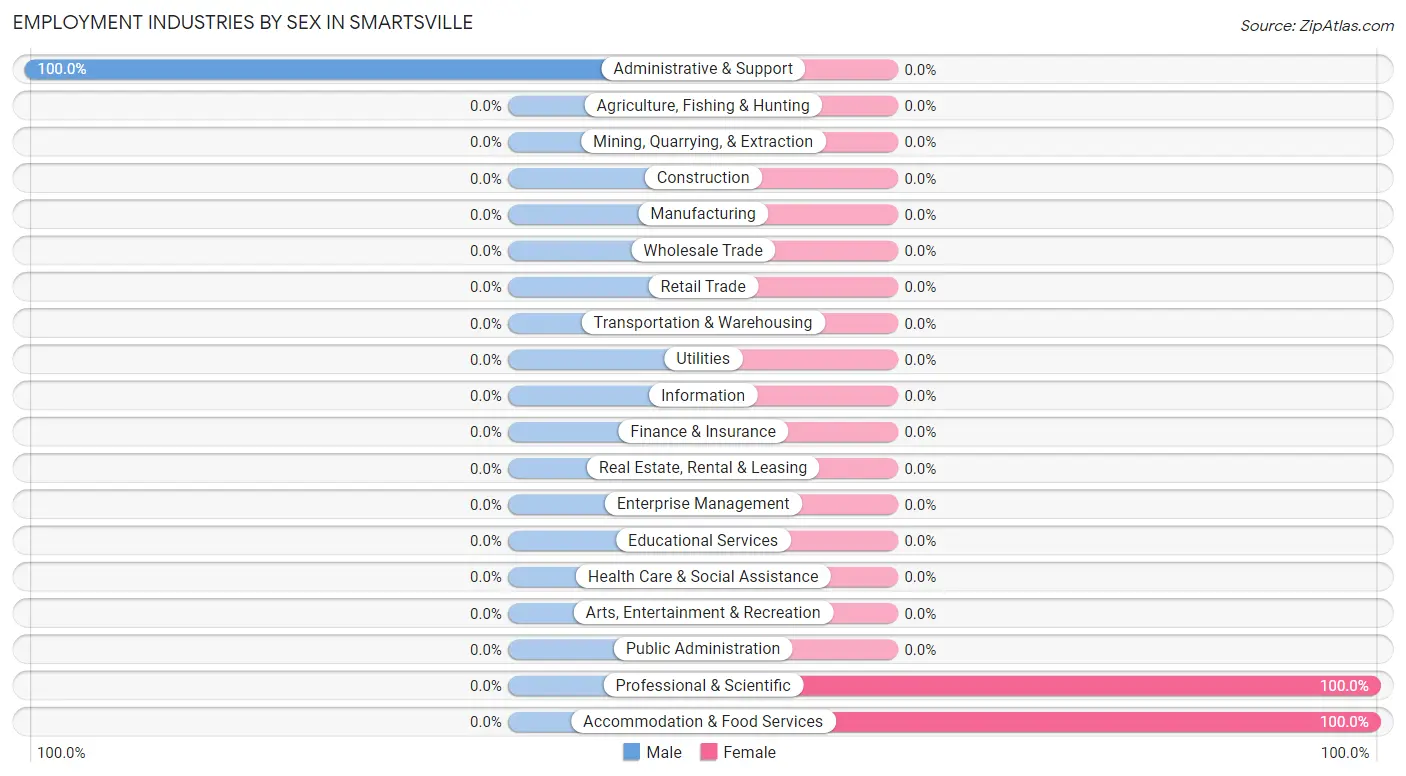
| Industry | Male | Female |
| Agriculture, Fishing & Hunting | 0 (0.0%) | 0 (0.0%) |
| Mining, Quarrying, & Extraction | 0 (0.0%) | 0 (0.0%) |
| Construction | 0 (0.0%) | 0 (0.0%) |
| Manufacturing | 0 (0.0%) | 0 (0.0%) |
| Wholesale Trade | 0 (0.0%) | 0 (0.0%) |
| Retail Trade | 0 (0.0%) | 0 (0.0%) |
| Transportation & Warehousing | 0 (0.0%) | 0 (0.0%) |
| Utilities | 0 (0.0%) | 0 (0.0%) |
| Information | 0 (0.0%) | 0 (0.0%) |
| Finance & Insurance | 0 (0.0%) | 0 (0.0%) |
| Real Estate, Rental & Leasing | 0 (0.0%) | 0 (0.0%) |
| Professional & Scientific | 0 (0.0%) | 14 (100.0%) |
| Enterprise Management | 0 (0.0%) | 0 (0.0%) |
| Administrative & Support | 14 (100.0%) | 0 (0.0%) |
| Educational Services | 0 (0.0%) | 0 (0.0%) |
| Health Care & Social Assistance | 0 (0.0%) | 0 (0.0%) |
| Arts, Entertainment & Recreation | 0 (0.0%) | 0 (0.0%) |
| Accommodation & Food Services | 0 (0.0%) | 9 (100.0%) |
| Public Administration | 0 (0.0%) | 0 (0.0%) |
| Total | 14 (37.8%) | 23 (62.2%) |
Education in Smartsville
School Enrollment in Smartsville
The most common levels of schooling among the 81 students in Smartsville are kindergarten (39 | 48.1%), high school (17 | 21.0%), and college / undergraduate (14 | 17.3%).
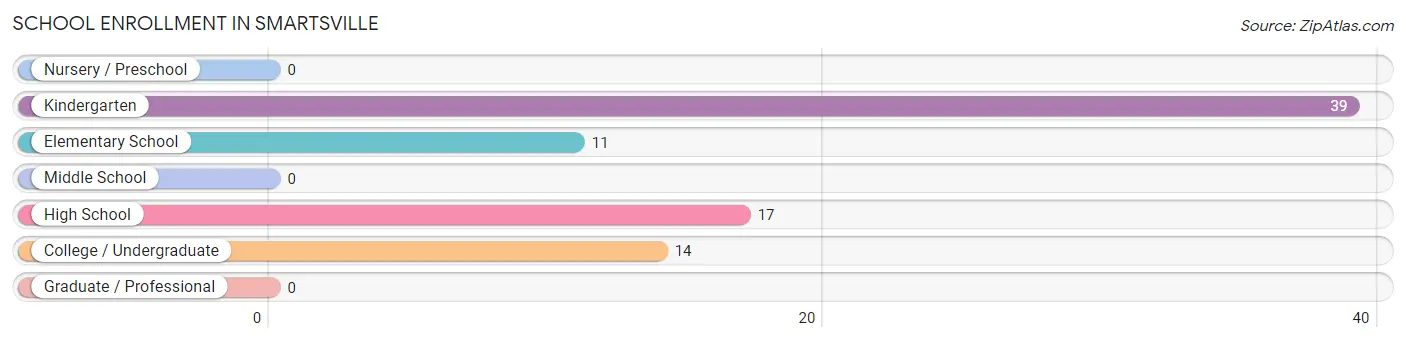
| School Level | # Students | % Students |
| Nursery / Preschool | 0 | 0.0% |
| Kindergarten | 39 | 48.1% |
| Elementary School | 11 | 13.6% |
| Middle School | 0 | 0.0% |
| High School | 17 | 21.0% |
| College / Undergraduate | 14 | 17.3% |
| Graduate / Professional | 0 | 0.0% |
| Total | 81 | 100.0% |
School Enrollment by Age by Funding Source in Smartsville
Out of a total of 81 students who are enrolled in schools in Smartsville, 30 (37.0%) attend a private institution, while the remaining 51 (63.0%) are enrolled in public schools. The age group of 10 to 14 year olds has the highest likelihood of being enrolled in private schools, with 16 (100.0% in the age bracket) enrolled. Conversely, the age group of 5 to 9 year old has the lowest likelihood of being enrolled in a private school, with 50 (100.0% in the age bracket) attending a public institution.
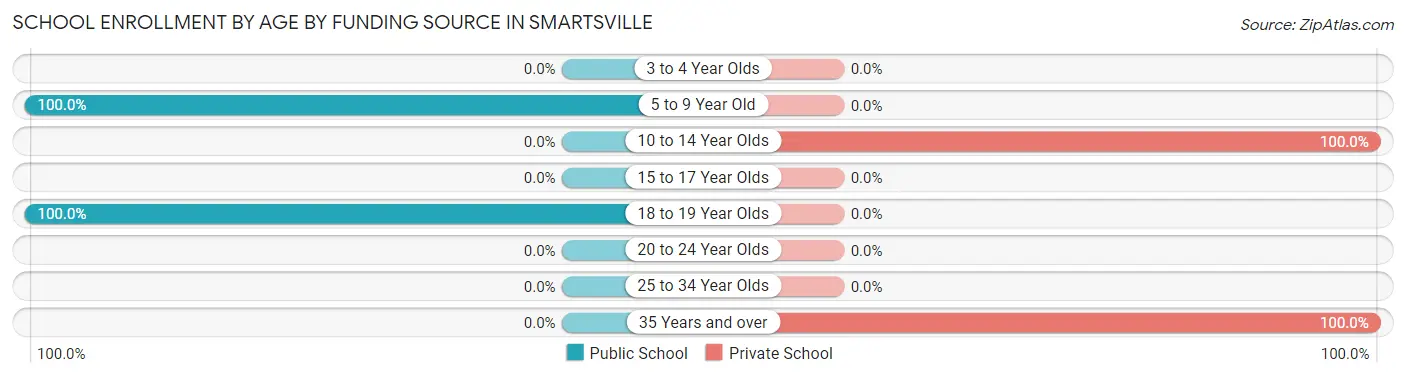
| Age Bracket | Public School | Private School |
| 3 to 4 Year Olds | 0 (0.0%) | 0 (0.0%) |
| 5 to 9 Year Old | 50 (100.0%) | 0 (0.0%) |
| 10 to 14 Year Olds | 0 (0.0%) | 16 (100.0%) |
| 15 to 17 Year Olds | 0 (0.0%) | 0 (0.0%) |
| 18 to 19 Year Olds | 1 (100.0%) | 0 (0.0%) |
| 20 to 24 Year Olds | 0 (0.0%) | 0 (0.0%) |
| 25 to 34 Year Olds | 0 (0.0%) | 0 (0.0%) |
| 35 Years and over | 0 (0.0%) | 14 (100.0%) |
| Total | 51 (63.0%) | 30 (37.0%) |
Educational Attainment by Field of Study in Smartsville
Visual & performing arts (10 | 90.9%), and bio, nature & agricultural (1 | 9.1%) are the most common fields of study among 11 individuals in Smartsville who have obtained a bachelor's degree or higher.
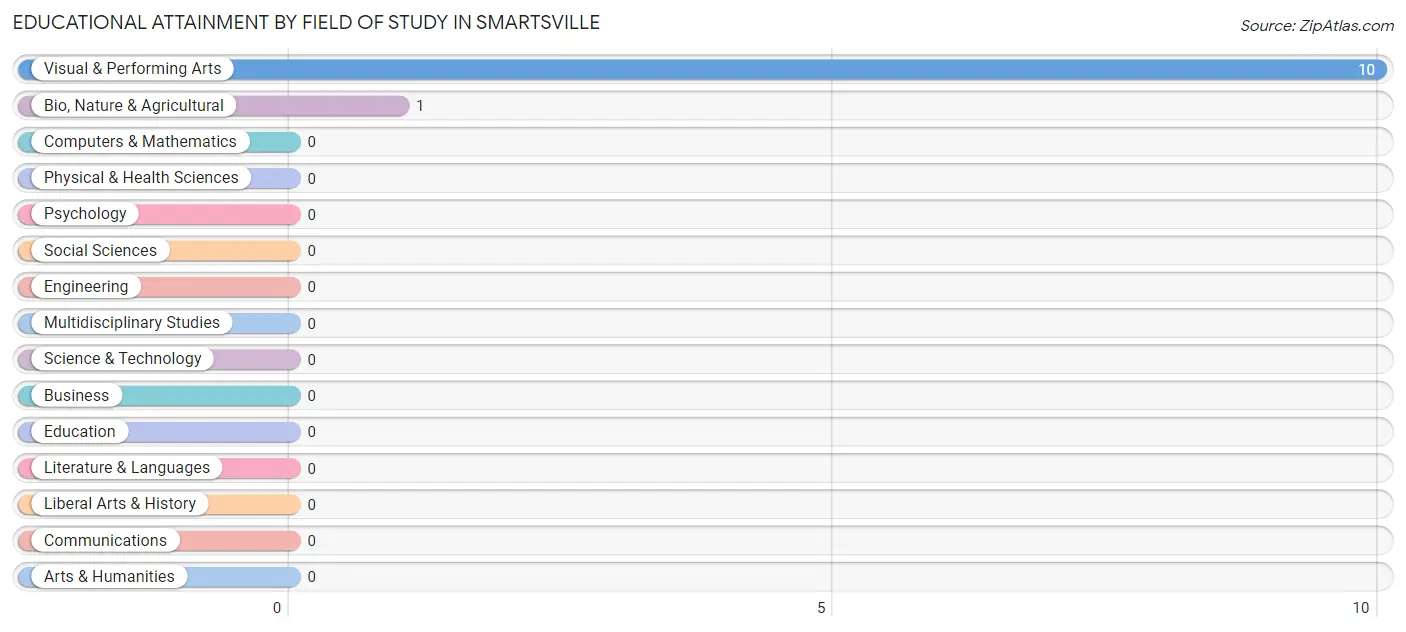
| Field of Study | # Graduates | % Graduates |
| Computers & Mathematics | 0 | 0.0% |
| Bio, Nature & Agricultural | 1 | 9.1% |
| Physical & Health Sciences | 0 | 0.0% |
| Psychology | 0 | 0.0% |
| Social Sciences | 0 | 0.0% |
| Engineering | 0 | 0.0% |
| Multidisciplinary Studies | 0 | 0.0% |
| Science & Technology | 0 | 0.0% |
| Business | 0 | 0.0% |
| Education | 0 | 0.0% |
| Literature & Languages | 0 | 0.0% |
| Liberal Arts & History | 0 | 0.0% |
| Visual & Performing Arts | 10 | 90.9% |
| Communications | 0 | 0.0% |
| Arts & Humanities | 0 | 0.0% |
| Total | 11 | 100.0% |
Transportation & Commute in Smartsville
Vehicle Availability by Sex in Smartsville
The most prevalent vehicle ownership categories in Smartsville are males with 2 vehicles (14, accounting for 100.0%) and females with 2 vehicles (0, making up 24.6%).
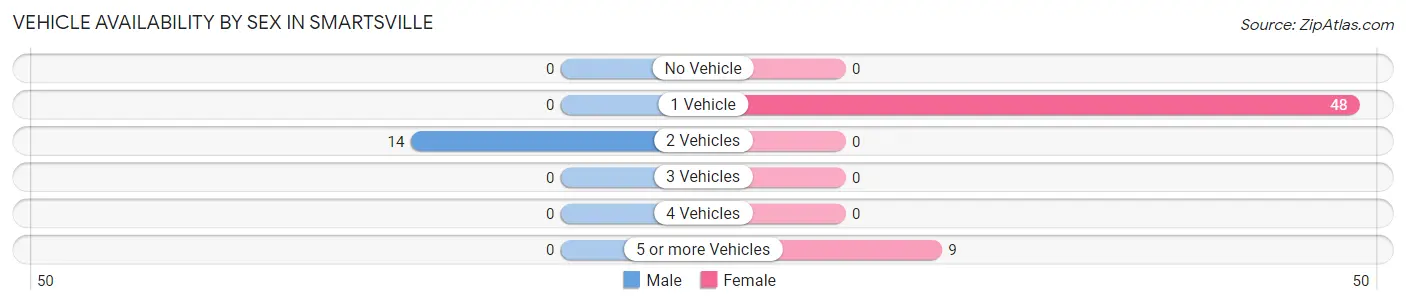
| Vehicles Available | Male | Female |
| No Vehicle | 0 (0.0%) | 0 (0.0%) |
| 1 Vehicle | 0 (0.0%) | 48 (84.2%) |
| 2 Vehicles | 14 (100.0%) | 0 (0.0%) |
| 3 Vehicles | 0 (0.0%) | 0 (0.0%) |
| 4 Vehicles | 0 (0.0%) | 0 (0.0%) |
| 5 or more Vehicles | 0 (0.0%) | 9 (15.8%) |
| Total | 14 (100.0%) | 57 (100.0%) |
Commute Time in Smartsville
The most frequently occuring commute durations in Smartsville are 15 to 19 minutes (34 commuters, 47.9%), 30 to 34 minutes (23 commuters, 32.4%), and 45 to 59 minutes (14 commuters, 19.7%).
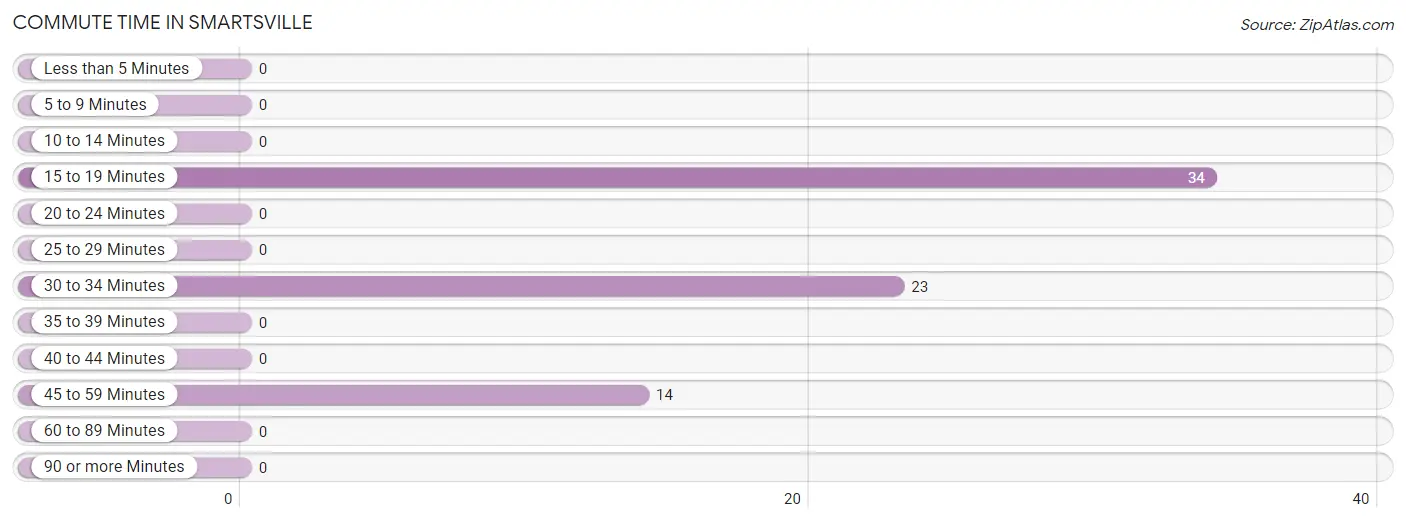
| Commute Time | # Commuters | % Commuters |
| Less than 5 Minutes | 0 | 0.0% |
| 5 to 9 Minutes | 0 | 0.0% |
| 10 to 14 Minutes | 0 | 0.0% |
| 15 to 19 Minutes | 34 | 47.9% |
| 20 to 24 Minutes | 0 | 0.0% |
| 25 to 29 Minutes | 0 | 0.0% |
| 30 to 34 Minutes | 23 | 32.4% |
| 35 to 39 Minutes | 0 | 0.0% |
| 40 to 44 Minutes | 0 | 0.0% |
| 45 to 59 Minutes | 14 | 19.7% |
| 60 to 89 Minutes | 0 | 0.0% |
| 90 or more Minutes | 0 | 0.0% |
Commute Time by Sex in Smartsville
The most common commute times in Smartsville are 45 to 59 minutes (14 commuters, 100.0%) for males and 15 to 19 minutes (34 commuters, 59.7%) for females.
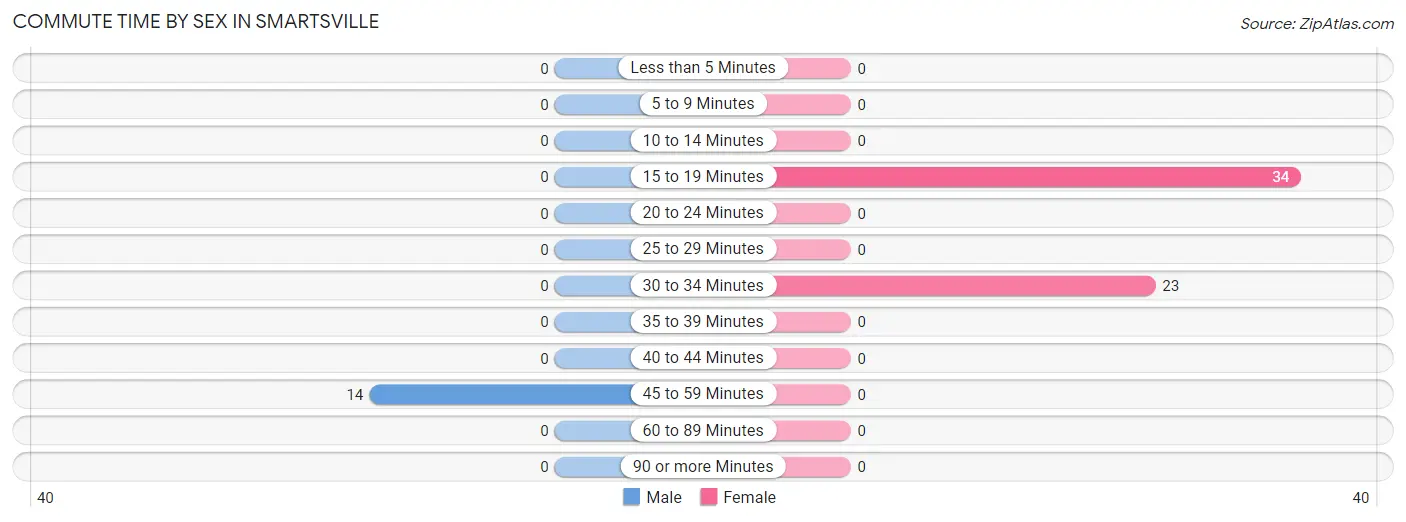
| Commute Time | Male | Female |
| Less than 5 Minutes | 0 (0.0%) | 0 (0.0%) |
| 5 to 9 Minutes | 0 (0.0%) | 0 (0.0%) |
| 10 to 14 Minutes | 0 (0.0%) | 0 (0.0%) |
| 15 to 19 Minutes | 0 (0.0%) | 34 (59.7%) |
| 20 to 24 Minutes | 0 (0.0%) | 0 (0.0%) |
| 25 to 29 Minutes | 0 (0.0%) | 0 (0.0%) |
| 30 to 34 Minutes | 0 (0.0%) | 23 (40.4%) |
| 35 to 39 Minutes | 0 (0.0%) | 0 (0.0%) |
| 40 to 44 Minutes | 0 (0.0%) | 0 (0.0%) |
| 45 to 59 Minutes | 14 (100.0%) | 0 (0.0%) |
| 60 to 89 Minutes | 0 (0.0%) | 0 (0.0%) |
| 90 or more Minutes | 0 (0.0%) | 0 (0.0%) |
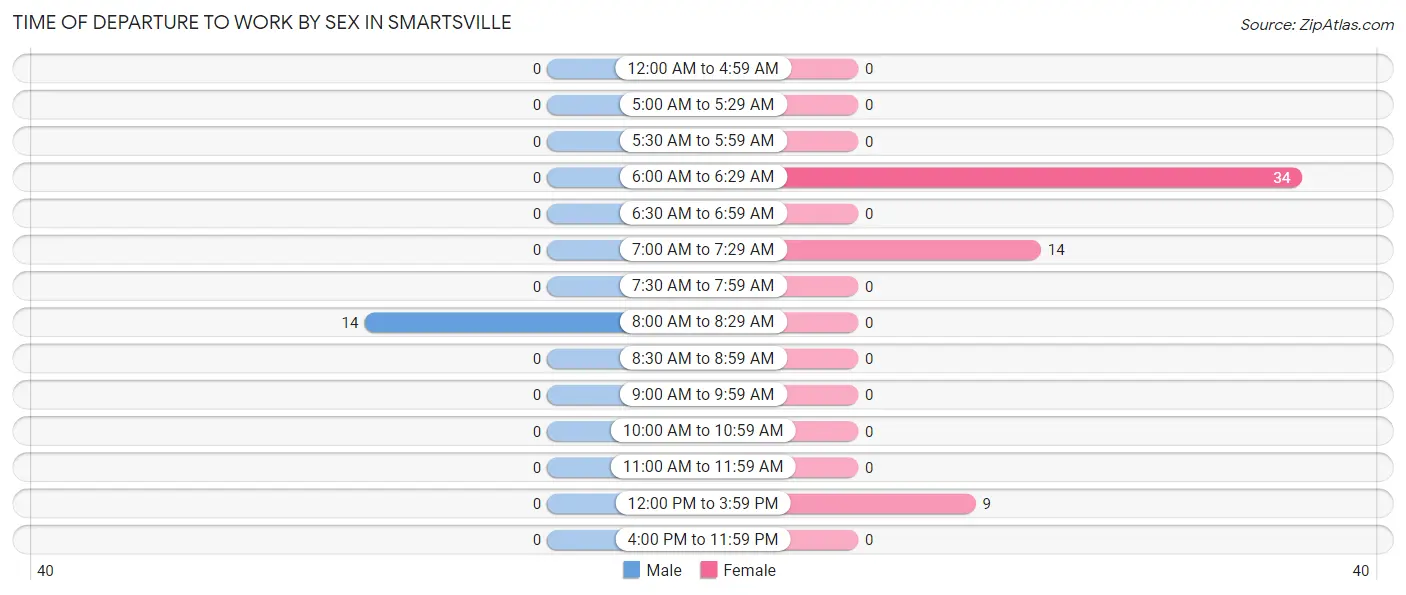
Time of Departure to Work by Sex in Smartsville
The most frequent times of departure to work in Smartsville are 8:00 AM to 8:29 AM (14, 100.0%) for males and 6:00 AM to 6:29 AM (34, 59.7%) for females.
| Time of Departure | Male | Female |
| 12:00 AM to 4:59 AM | 0 (0.0%) | 0 (0.0%) |
| 5:00 AM to 5:29 AM | 0 (0.0%) | 0 (0.0%) |
| 5:30 AM to 5:59 AM | 0 (0.0%) | 0 (0.0%) |
| 6:00 AM to 6:29 AM | 0 (0.0%) | 34 (59.7%) |
| 6:30 AM to 6:59 AM | 0 (0.0%) | 0 (0.0%) |
| 7:00 AM to 7:29 AM | 0 (0.0%) | 14 (24.6%) |
| 7:30 AM to 7:59 AM | 0 (0.0%) | 0 (0.0%) |
| 8:00 AM to 8:29 AM | 14 (100.0%) | 0 (0.0%) |
| 8:30 AM to 8:59 AM | 0 (0.0%) | 0 (0.0%) |
| 9:00 AM to 9:59 AM | 0 (0.0%) | 0 (0.0%) |
| 10:00 AM to 10:59 AM | 0 (0.0%) | 0 (0.0%) |
| 11:00 AM to 11:59 AM | 0 (0.0%) | 0 (0.0%) |
| 12:00 PM to 3:59 PM | 0 (0.0%) | 9 (15.8%) |
| 4:00 PM to 11:59 PM | 0 (0.0%) | 0 (0.0%) |
| Total | 14 (100.0%) | 57 (100.0%) |
Housing Occupancy in Smartsville
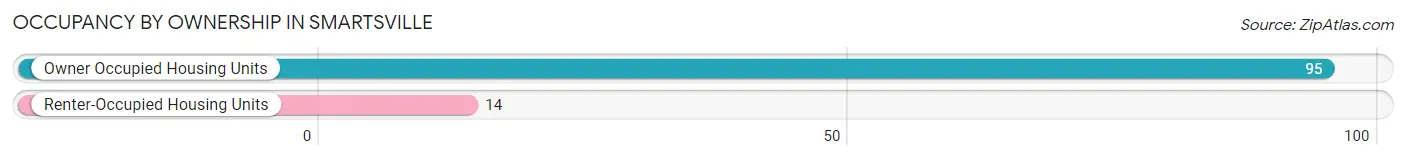
Occupancy by Ownership in Smartsville
Of the total 109 dwellings in Smartsville, owner-occupied units account for 95 (87.2%), while renter-occupied units make up 14 (12.8%).
| Occupancy | # Housing Units | % Housing Units |
| Owner Occupied Housing Units | 95 | 87.2% |
| Renter-Occupied Housing Units | 14 | 12.8% |
| Total Occupied Housing Units | 109 | 100.0% |
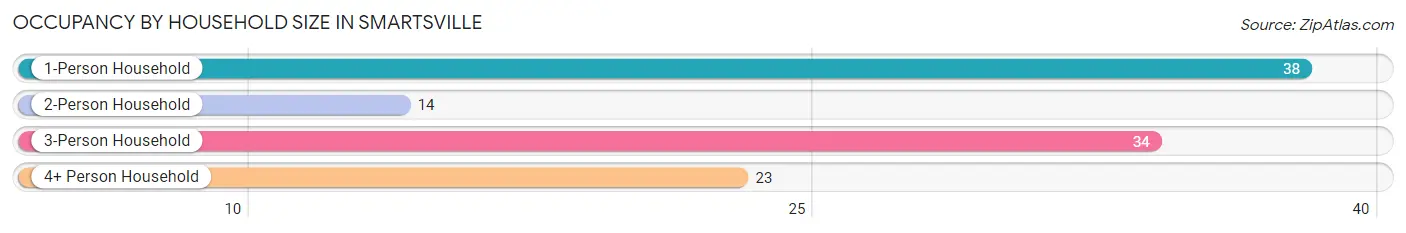
Occupancy by Household Size in Smartsville
| Household Size | # Housing Units | % Housing Units |
| 1-Person Household | 38 | 34.9% |
| 2-Person Household | 14 | 12.8% |
| 3-Person Household | 34 | 31.2% |
| 4+ Person Household | 23 | 21.1% |
| Total Housing Units | 109 | 100.0% |
Occupancy by Ownership by Household Size in Smartsville
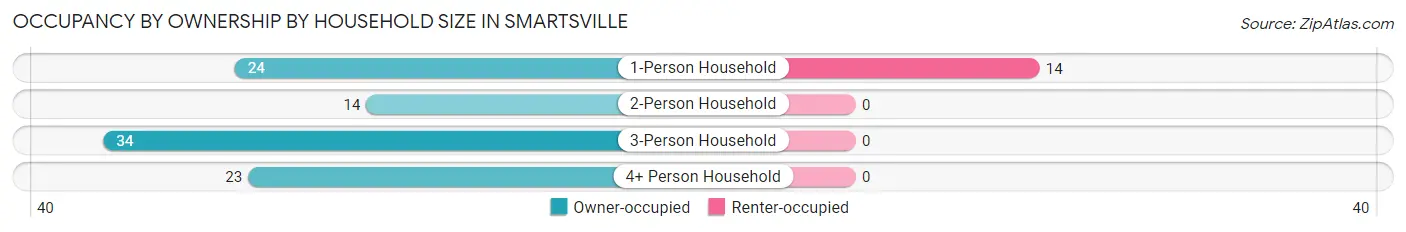
| Household Size | Owner-occupied | Renter-occupied |
| 1-Person Household | 24 (63.2%) | 14 (36.8%) |
| 2-Person Household | 14 (100.0%) | 0 (0.0%) |
| 3-Person Household | 34 (100.0%) | 0 (0.0%) |
| 4+ Person Household | 23 (100.0%) | 0 (0.0%) |
| Total Housing Units | 95 (87.2%) | 14 (12.8%) |
Occupancy by Educational Attainment in Smartsville
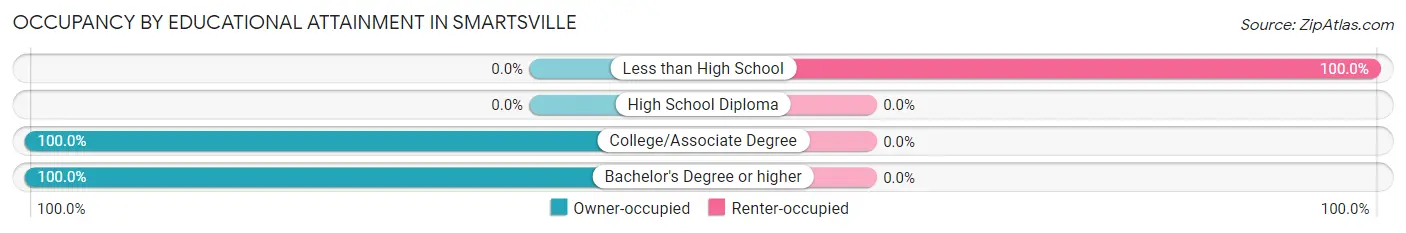
| Household Size | Owner-occupied | Renter-occupied |
| Less than High School | 0 (0.0%) | 14 (100.0%) |
| High School Diploma | 0 (0.0%) | 0 (0.0%) |
| College/Associate Degree | 85 (100.0%) | 0 (0.0%) |
| Bachelor's Degree or higher | 10 (100.0%) | 0 (0.0%) |
Occupancy by Age of Householder in Smartsville
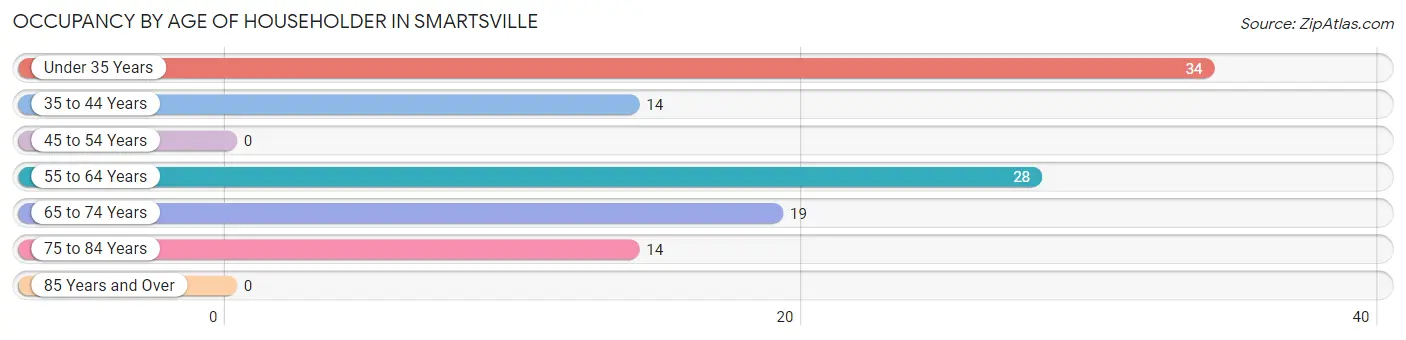
| Age Bracket | # Households | % Households |
| Under 35 Years | 34 | 31.2% |
| 35 to 44 Years | 14 | 12.8% |
| 45 to 54 Years | 0 | 0.0% |
| 55 to 64 Years | 28 | 25.7% |
| 65 to 74 Years | 19 | 17.4% |
| 75 to 84 Years | 14 | 12.8% |
| 85 Years and Over | 0 | 0.0% |
| Total | 109 | 100.0% |
Housing Finances in Smartsville
Median Income by Occupancy in Smartsville
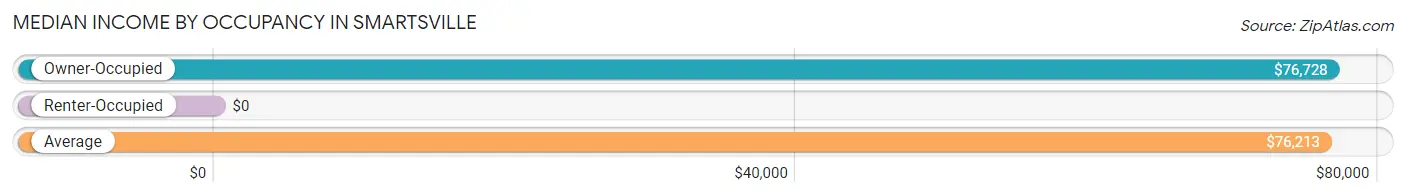
| Occupancy Type | # Households | Median Income |
| Owner-Occupied | 95 (87.2%) | $76,728 |
| Renter-Occupied | 14 (12.8%) | $0 |
| Average | 109 (100.0%) | $76,213 |
Occupancy by Householder Income Bracket in Smartsville
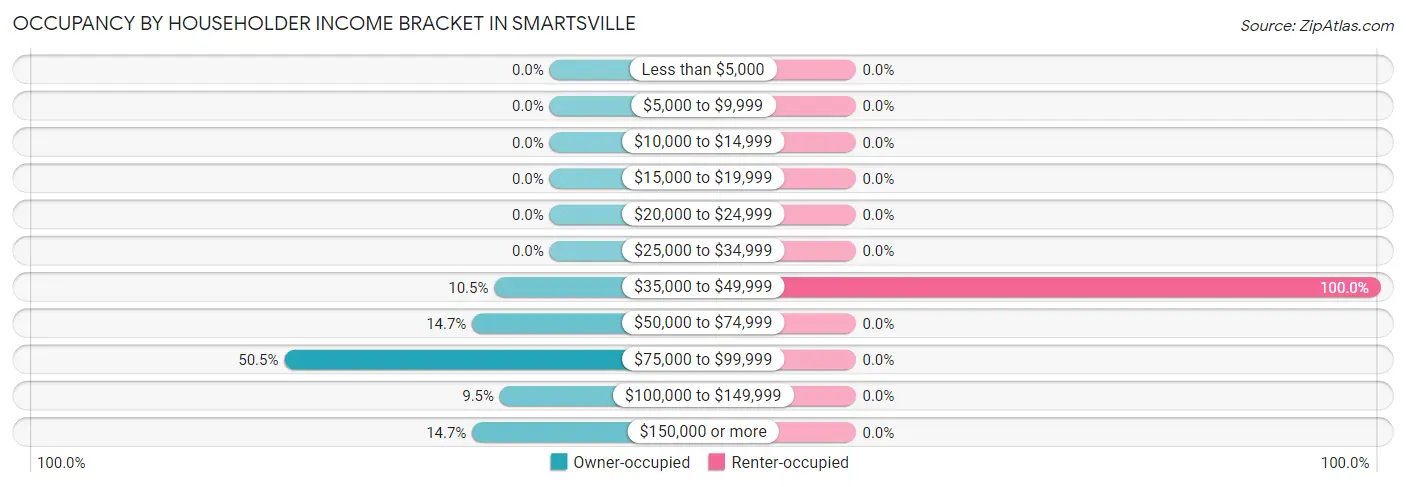
| Income Bracket | Owner-occupied | Renter-occupied |
| Less than $5,000 | 0 (0.0%) | 0 (0.0%) |
| $5,000 to $9,999 | 0 (0.0%) | 0 (0.0%) |
| $10,000 to $14,999 | 0 (0.0%) | 0 (0.0%) |
| $15,000 to $19,999 | 0 (0.0%) | 0 (0.0%) |
| $20,000 to $24,999 | 0 (0.0%) | 0 (0.0%) |
| $25,000 to $34,999 | 0 (0.0%) | 0 (0.0%) |
| $35,000 to $49,999 | 10 (10.5%) | 14 (100.0%) |
| $50,000 to $74,999 | 14 (14.7%) | 0 (0.0%) |
| $75,000 to $99,999 | 48 (50.5%) | 0 (0.0%) |
| $100,000 to $149,999 | 9 (9.5%) | 0 (0.0%) |
| $150,000 or more | 14 (14.7%) | 0 (0.0%) |
| Total | 95 (100.0%) | 14 (100.0%) |
Monthly Housing Cost Tiers in Smartsville
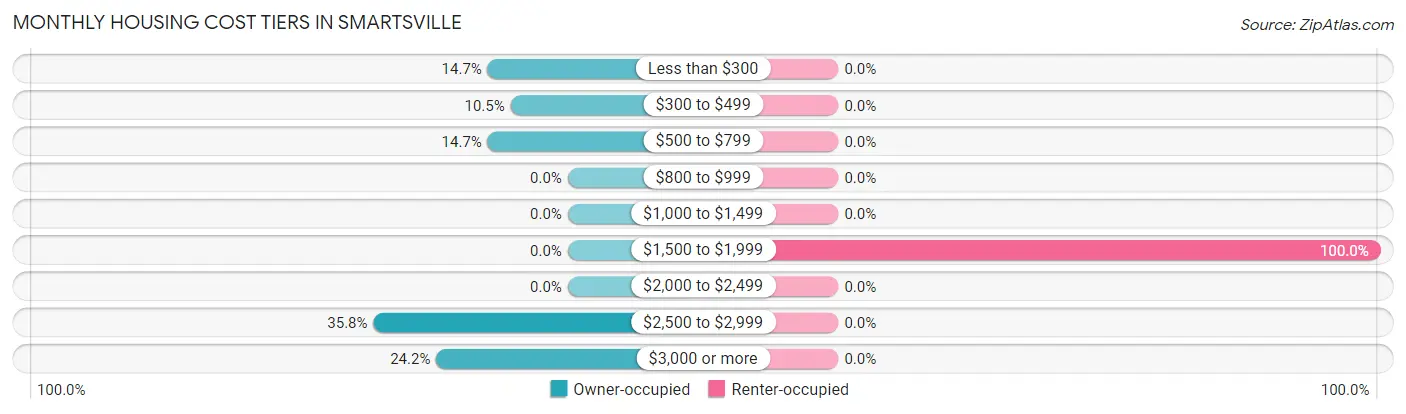
| Monthly Cost | Owner-occupied | Renter-occupied |
| Less than $300 | 14 (14.7%) | 0 (0.0%) |
| $300 to $499 | 10 (10.5%) | 0 (0.0%) |
| $500 to $799 | 14 (14.7%) | 0 (0.0%) |
| $800 to $999 | 0 (0.0%) | 0 (0.0%) |
| $1,000 to $1,499 | 0 (0.0%) | 0 (0.0%) |
| $1,500 to $1,999 | 0 (0.0%) | 14 (100.0%) |
| $2,000 to $2,499 | 0 (0.0%) | 0 (0.0%) |
| $2,500 to $2,999 | 34 (35.8%) | 0 (0.0%) |
| $3,000 or more | 23 (24.2%) | 0 (0.0%) |
| Total | 95 (100.0%) | 14 (100.0%) |
Physical Housing Characteristics in Smartsville
Housing Structures in Smartsville
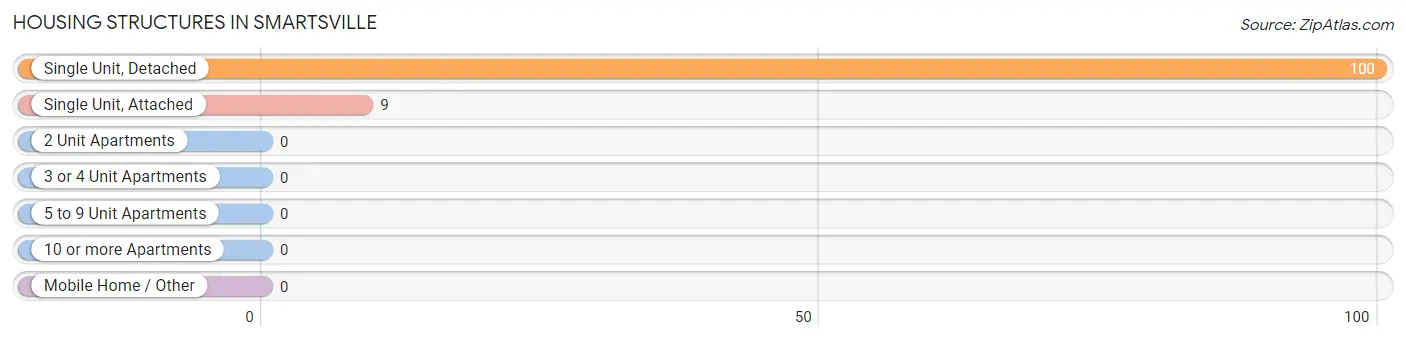
| Structure Type | # Housing Units | % Housing Units |
| Single Unit, Detached | 100 | 91.7% |
| Single Unit, Attached | 9 | 8.3% |
| 2 Unit Apartments | 0 | 0.0% |
| 3 or 4 Unit Apartments | 0 | 0.0% |
| 5 to 9 Unit Apartments | 0 | 0.0% |
| 10 or more Apartments | 0 | 0.0% |
| Mobile Home / Other | 0 | 0.0% |
| Total | 109 | 100.0% |
Housing Structures by Occupancy in Smartsville
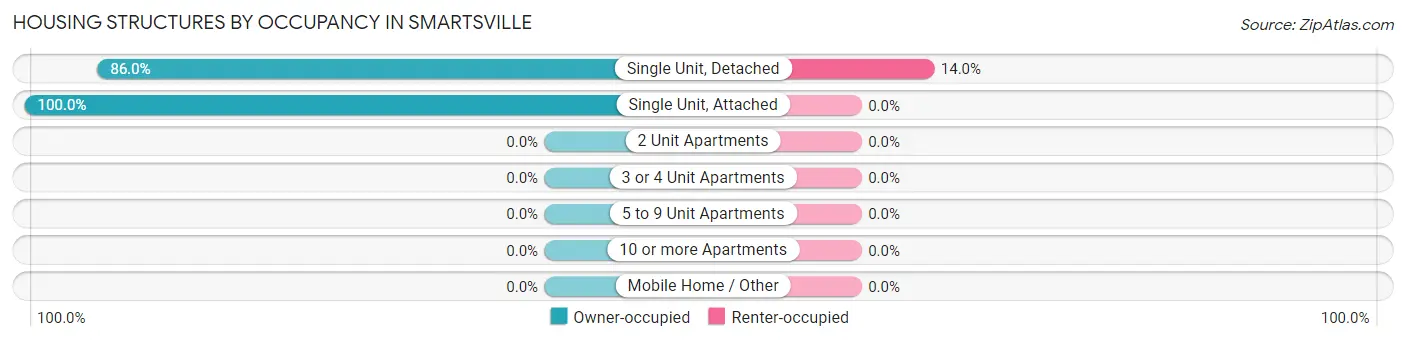
| Structure Type | Owner-occupied | Renter-occupied |
| Single Unit, Detached | 86 (86.0%) | 14 (14.0%) |
| Single Unit, Attached | 9 (100.0%) | 0 (0.0%) |
| 2 Unit Apartments | 0 (0.0%) | 0 (0.0%) |
| 3 or 4 Unit Apartments | 0 (0.0%) | 0 (0.0%) |
| 5 to 9 Unit Apartments | 0 (0.0%) | 0 (0.0%) |
| 10 or more Apartments | 0 (0.0%) | 0 (0.0%) |
| Mobile Home / Other | 0 (0.0%) | 0 (0.0%) |
| Total | 95 (87.2%) | 14 (12.8%) |
Housing Structures by Number of Rooms in Smartsville
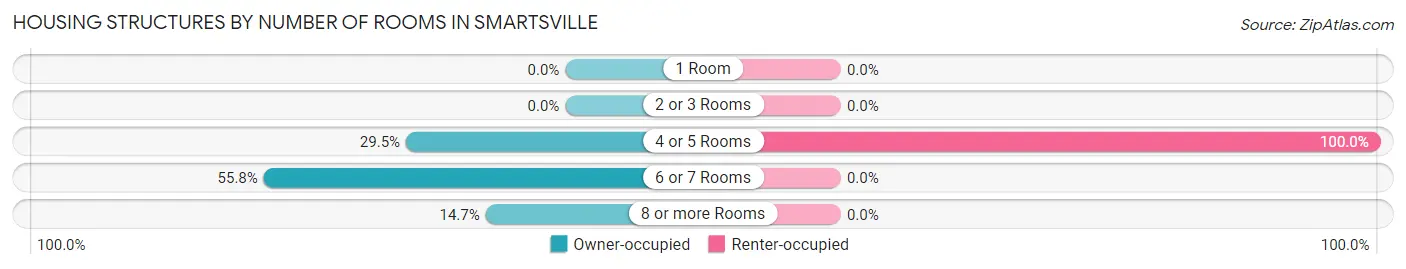
| Number of Rooms | Owner-occupied | Renter-occupied |
| 1 Room | 0 (0.0%) | 0 (0.0%) |
| 2 or 3 Rooms | 0 (0.0%) | 0 (0.0%) |
| 4 or 5 Rooms | 28 (29.5%) | 14 (100.0%) |
| 6 or 7 Rooms | 53 (55.8%) | 0 (0.0%) |
| 8 or more Rooms | 14 (14.7%) | 0 (0.0%) |
| Total | 95 (100.0%) | 14 (100.0%) |
Housing Structure by Heating Type in Smartsville
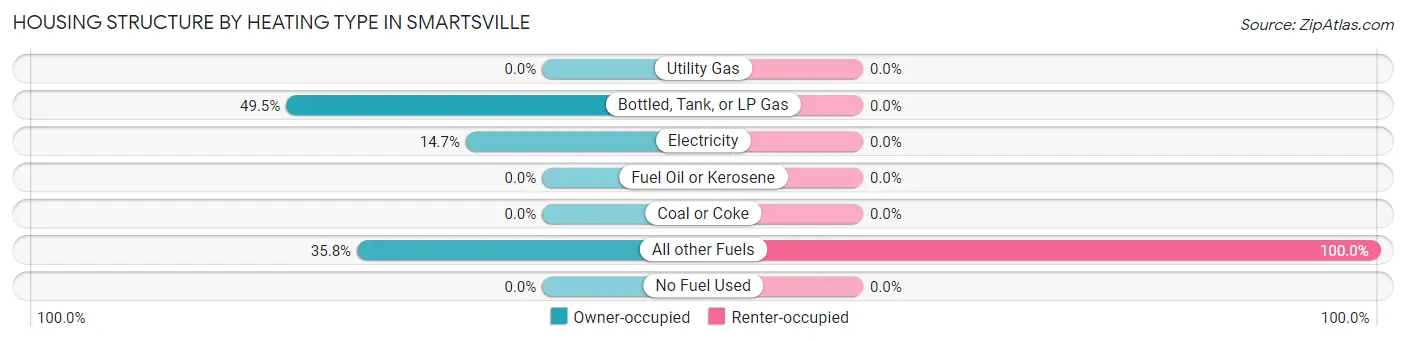
| Heating Type | Owner-occupied | Renter-occupied |
| Utility Gas | 0 (0.0%) | 0 (0.0%) |
| Bottled, Tank, or LP Gas | 47 (49.5%) | 0 (0.0%) |
| Electricity | 14 (14.7%) | 0 (0.0%) |
| Fuel Oil or Kerosene | 0 (0.0%) | 0 (0.0%) |
| Coal or Coke | 0 (0.0%) | 0 (0.0%) |
| All other Fuels | 34 (35.8%) | 14 (100.0%) |
| No Fuel Used | 0 (0.0%) | 0 (0.0%) |
| Total | 95 (100.0%) | 14 (100.0%) |
Household Vehicle Usage in Smartsville
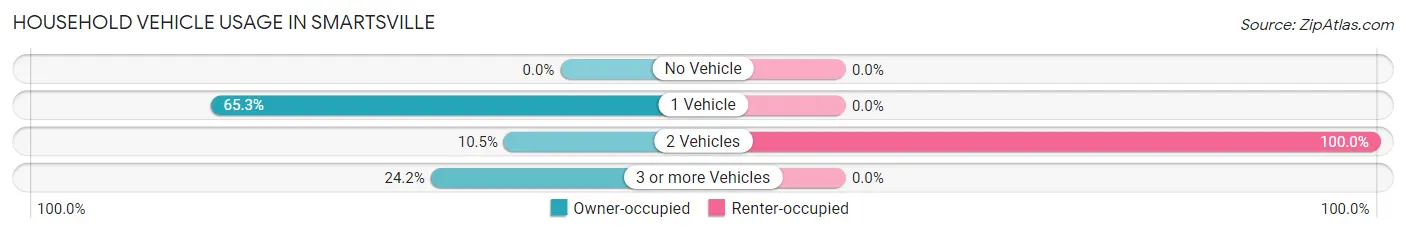
| Vehicles per Household | Owner-occupied | Renter-occupied |
| No Vehicle | 0 (0.0%) | 0 (0.0%) |
| 1 Vehicle | 62 (65.3%) | 0 (0.0%) |
| 2 Vehicles | 10 (10.5%) | 14 (100.0%) |
| 3 or more Vehicles | 23 (24.2%) | 0 (0.0%) |
| Total | 95 (100.0%) | 14 (100.0%) |
Real Estate & Mortgages in Smartsville
Real Estate and Mortgage Overview in Smartsville
| Characteristic | Without Mortgage | With Mortgage |
| Housing Units | 38 | 57 |
| Median Property Value | $217,900 | $0 |
| Median Household Income | $69,107 | $14 |
| Monthly Housing Costs | - | - |
| Real Estate Taxes | $1,179 | $0 |
Property Value by Mortgage Status in Smartsville
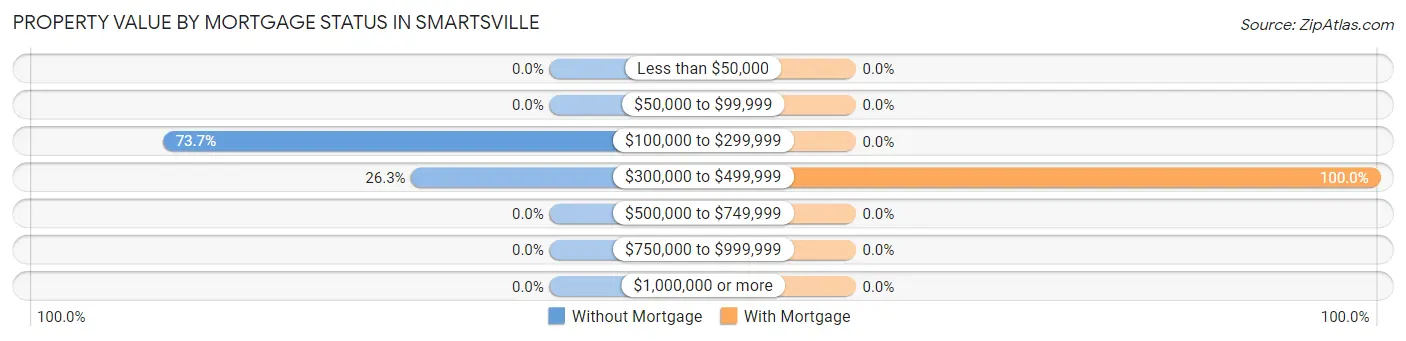
| Property Value | Without Mortgage | With Mortgage |
| Less than $50,000 | 0 (0.0%) | 0 (0.0%) |
| $50,000 to $99,999 | 0 (0.0%) | 0 (0.0%) |
| $100,000 to $299,999 | 28 (73.7%) | 0 (0.0%) |
| $300,000 to $499,999 | 10 (26.3%) | 57 (100.0%) |
| $500,000 to $749,999 | 0 (0.0%) | 0 (0.0%) |
| $750,000 to $999,999 | 0 (0.0%) | 0 (0.0%) |
| $1,000,000 or more | 0 (0.0%) | 0 (0.0%) |
| Total | 38 (100.0%) | 57 (100.0%) |
Household Income by Mortgage Status in Smartsville
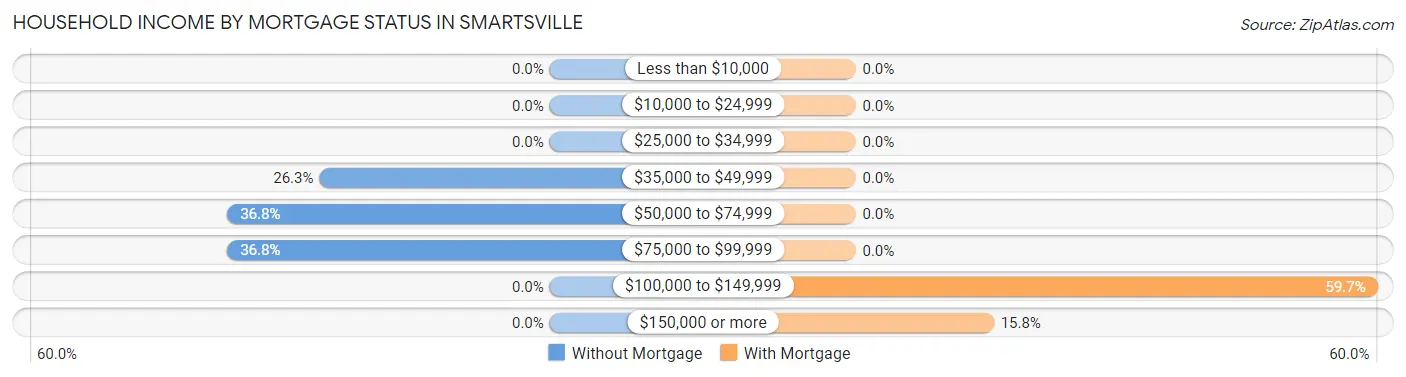
| Household Income | Without Mortgage | With Mortgage |
| Less than $10,000 | 0 (0.0%) | 0 (0.0%) |
| $10,000 to $24,999 | 0 (0.0%) | 0 (0.0%) |
| $25,000 to $34,999 | 0 (0.0%) | 0 (0.0%) |
| $35,000 to $49,999 | 10 (26.3%) | 0 (0.0%) |
| $50,000 to $74,999 | 14 (36.8%) | 0 (0.0%) |
| $75,000 to $99,999 | 14 (36.8%) | 0 (0.0%) |
| $100,000 to $149,999 | 0 (0.0%) | 34 (59.7%) |
| $150,000 or more | 0 (0.0%) | 9 (15.8%) |
| Total | 38 (100.0%) | 57 (100.0%) |
Property Value to Household Income Ratio in Smartsville
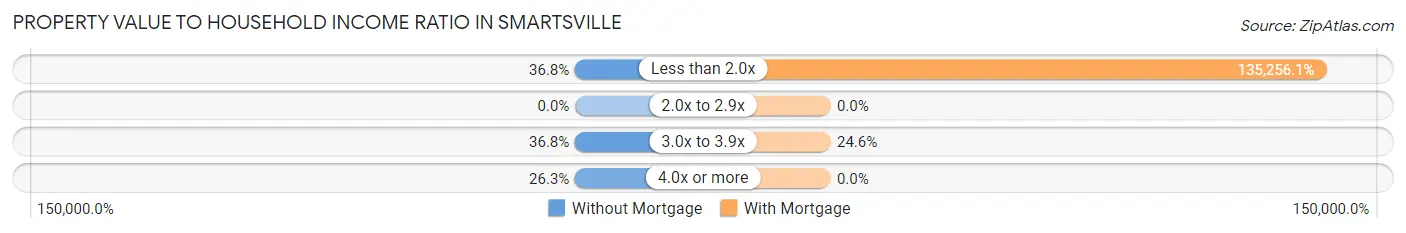
| Value-to-Income Ratio | Without Mortgage | With Mortgage |
| Less than 2.0x | 14 (36.8%) | 77,096 (135,256.1%) |
| 2.0x to 2.9x | 0 (0.0%) | 0 (0.0%) |
| 3.0x to 3.9x | 14 (36.8%) | 14 (24.6%) |
| 4.0x or more | 10 (26.3%) | 0 (0.0%) |
| Total | 38 (100.0%) | 57 (100.0%) |
Real Estate Taxes by Mortgage Status in Smartsville
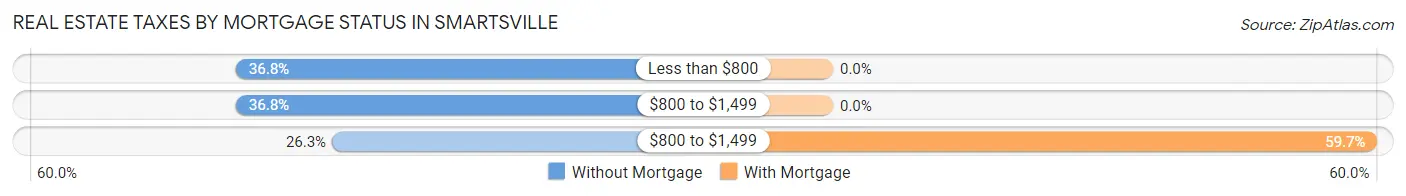
| Property Taxes | Without Mortgage | With Mortgage |
| Less than $800 | 14 (36.8%) | 0 (0.0%) |
| $800 to $1,499 | 14 (36.8%) | 0 (0.0%) |
| $800 to $1,499 | 10 (26.3%) | 34 (59.7%) |
| Total | 38 (100.0%) | 57 (100.0%) |
Health & Disability in Smartsville
Health Insurance Coverage by Age in Smartsville
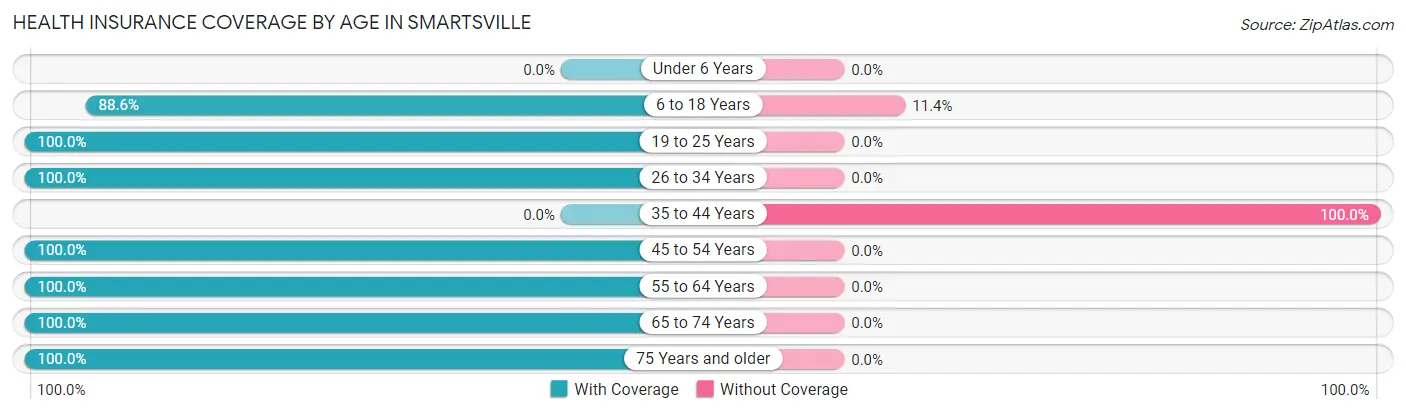
| Age Bracket | With Coverage | Without Coverage |
| Under 6 Years | 0 (0.0%) | 0 (0.0%) |
| 6 to 18 Years | 70 (88.6%) | 9 (11.4%) |
| 19 to 25 Years | 47 (100.0%) | 0 (0.0%) |
| 26 to 34 Years | 93 (100.0%) | 0 (0.0%) |
| 35 to 44 Years | 0 (0.0%) | 14 (100.0%) |
| 45 to 54 Years | 1 (100.0%) | 0 (0.0%) |
| 55 to 64 Years | 44 (100.0%) | 0 (0.0%) |
| 65 to 74 Years | 19 (100.0%) | 0 (0.0%) |
| 75 Years and older | 48 (100.0%) | 0 (0.0%) |
| Total | 322 (93.3%) | 23 (6.7%) |
Health Insurance Coverage by Citizenship Status in Smartsville
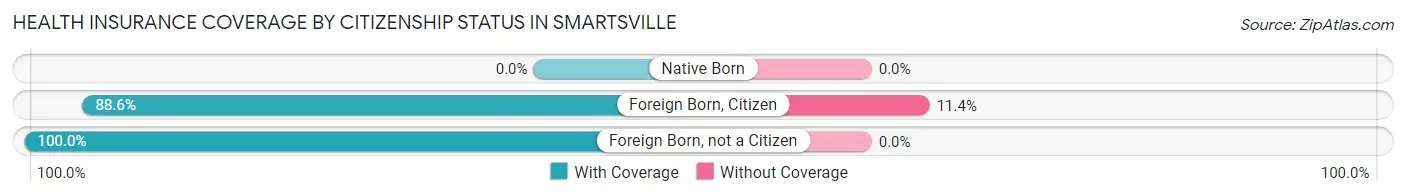
| Citizenship Status | With Coverage | Without Coverage |
| Native Born | 0 (0.0%) | 0 (0.0%) |
| Foreign Born, Citizen | 70 (88.6%) | 9 (11.4%) |
| Foreign Born, not a Citizen | 47 (100.0%) | 0 (0.0%) |
Health Insurance Coverage by Household Income in Smartsville
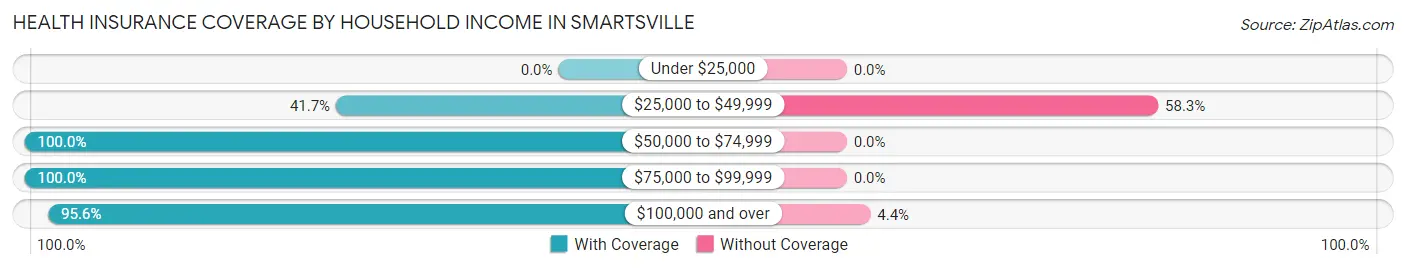
| Household Income | With Coverage | Without Coverage |
| Under $25,000 | 0 (0.0%) | 0 (0.0%) |
| $25,000 to $49,999 | 10 (41.7%) | 14 (58.3%) |
| $50,000 to $74,999 | 31 (100.0%) | 0 (0.0%) |
| $75,000 to $99,999 | 83 (100.0%) | 0 (0.0%) |
| $100,000 and over | 195 (95.6%) | 9 (4.4%) |
Public vs Private Health Insurance Coverage by Age in Smartsville
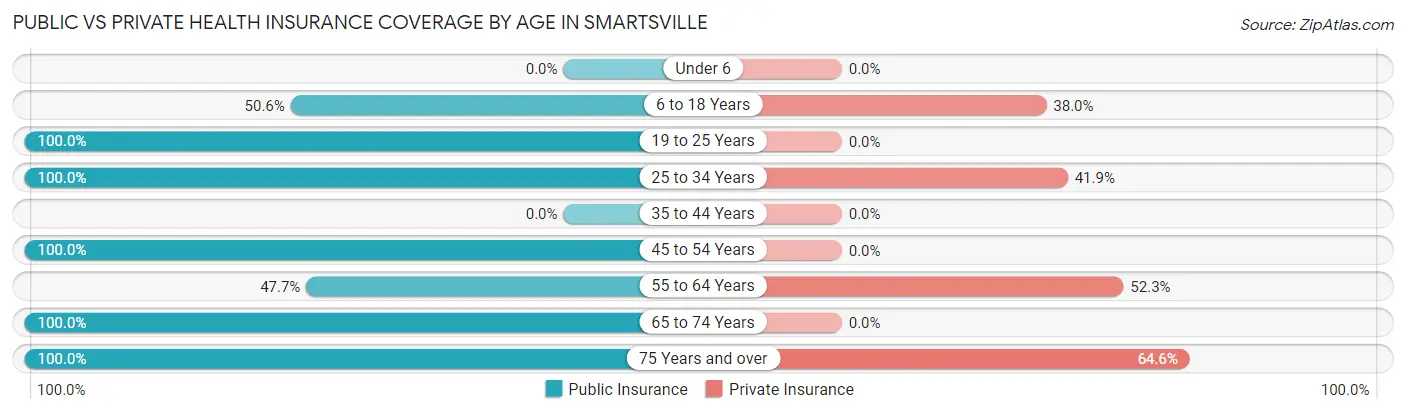
| Age Bracket | Public Insurance | Private Insurance |
| Under 6 | 0 (0.0%) | 0 (0.0%) |
| 6 to 18 Years | 40 (50.6%) | 30 (38.0%) |
| 19 to 25 Years | 47 (100.0%) | 0 (0.0%) |
| 25 to 34 Years | 93 (100.0%) | 39 (41.9%) |
| 35 to 44 Years | 0 (0.0%) | 0 (0.0%) |
| 45 to 54 Years | 1 (100.0%) | 0 (0.0%) |
| 55 to 64 Years | 21 (47.7%) | 23 (52.3%) |
| 65 to 74 Years | 19 (100.0%) | 0 (0.0%) |
| 75 Years and over | 48 (100.0%) | 31 (64.6%) |
| Total | 269 (78.0%) | 123 (35.6%) |
Disability Status by Sex by Age in Smartsville
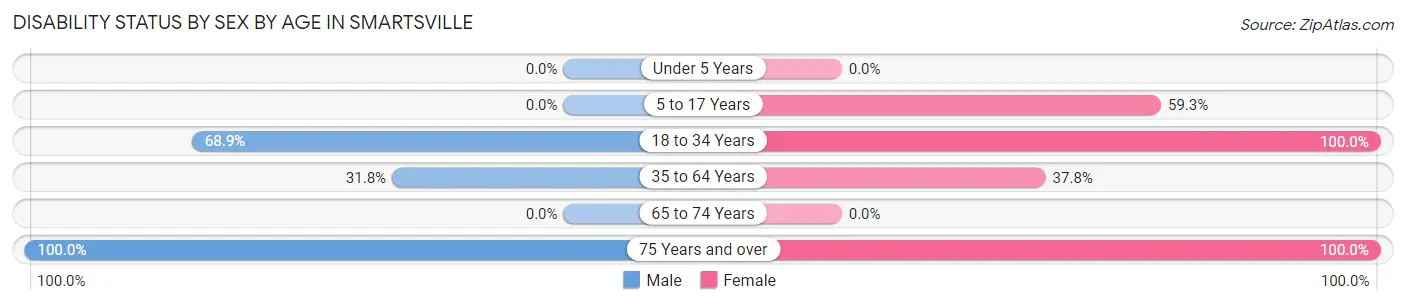
| Age Bracket | Male | Female |
| Under 5 Years | 0 (0.0%) | 0 (0.0%) |
| 5 to 17 Years | 0 (0.0%) | 16 (59.3%) |
| 18 to 34 Years | 91 (68.9%) | 21 (100.0%) |
| 35 to 64 Years | 7 (31.8%) | 14 (37.8%) |
| 65 to 74 Years | 0 (0.0%) | 0 (0.0%) |
| 75 Years and over | 17 (100.0%) | 31 (100.0%) |
Disability Class by Sex by Age in Smartsville
Disability Class: Hearing Difficulty
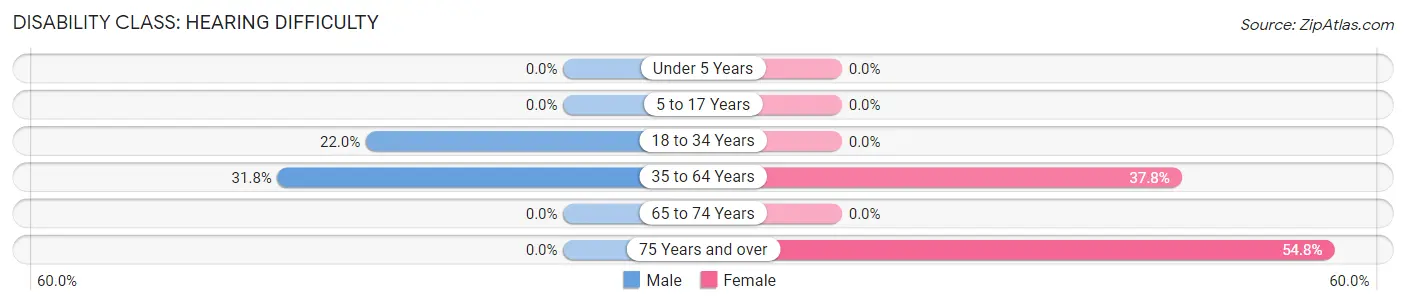
| Age Bracket | Male | Female |
| Under 5 Years | 0 (0.0%) | 0 (0.0%) |
| 5 to 17 Years | 0 (0.0%) | 0 (0.0%) |
| 18 to 34 Years | 29 (22.0%) | 0 (0.0%) |
| 35 to 64 Years | 7 (31.8%) | 14 (37.8%) |
| 65 to 74 Years | 0 (0.0%) | 0 (0.0%) |
| 75 Years and over | 0 (0.0%) | 17 (54.8%) |
Disability Class: Vision Difficulty
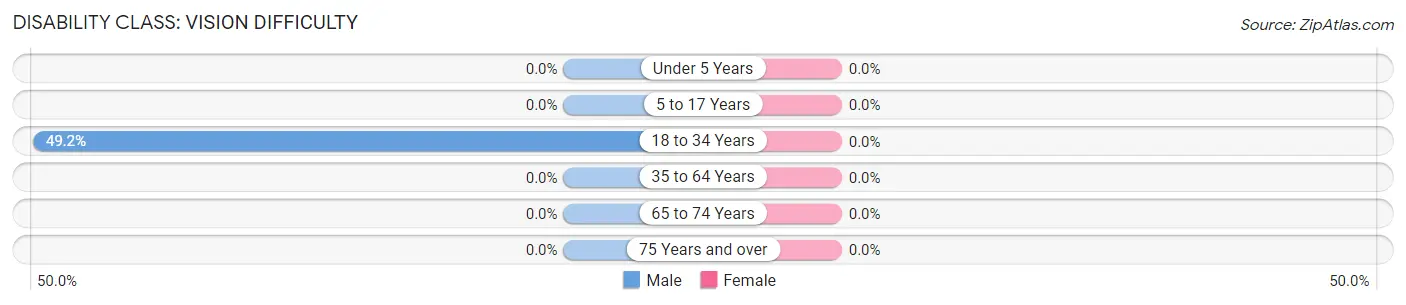
| Age Bracket | Male | Female |
| Under 5 Years | 0 (0.0%) | 0 (0.0%) |
| 5 to 17 Years | 0 (0.0%) | 0 (0.0%) |
| 18 to 34 Years | 65 (49.2%) | 0 (0.0%) |
| 35 to 64 Years | 0 (0.0%) | 0 (0.0%) |
| 65 to 74 Years | 0 (0.0%) | 0 (0.0%) |
| 75 Years and over | 0 (0.0%) | 0 (0.0%) |
Disability Class: Cognitive Difficulty
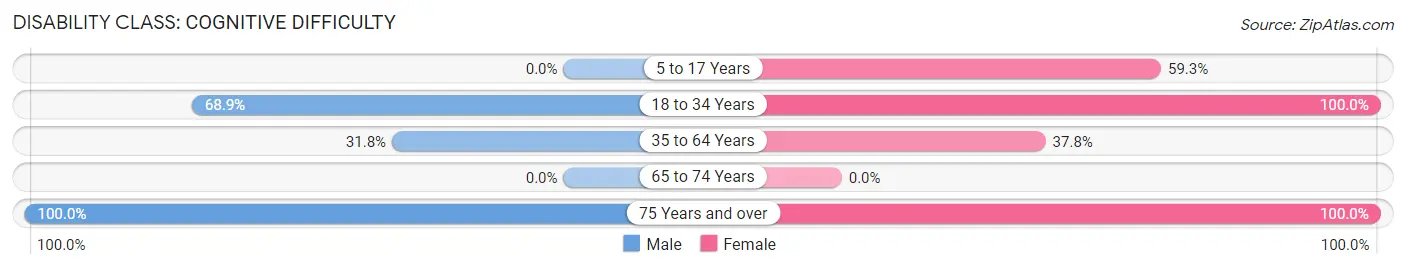
| Age Bracket | Male | Female |
| 5 to 17 Years | 0 (0.0%) | 16 (59.3%) |
| 18 to 34 Years | 91 (68.9%) | 21 (100.0%) |
| 35 to 64 Years | 7 (31.8%) | 14 (37.8%) |
| 65 to 74 Years | 0 (0.0%) | 0 (0.0%) |
| 75 Years and over | 17 (100.0%) | 31 (100.0%) |
Disability Class: Ambulatory Difficulty
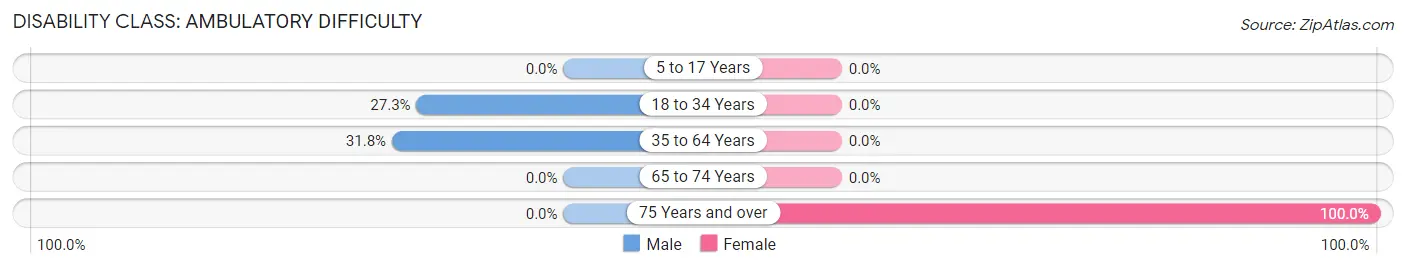
| Age Bracket | Male | Female |
| 5 to 17 Years | 0 (0.0%) | 0 (0.0%) |
| 18 to 34 Years | 36 (27.3%) | 0 (0.0%) |
| 35 to 64 Years | 7 (31.8%) | 0 (0.0%) |
| 65 to 74 Years | 0 (0.0%) | 0 (0.0%) |
| 75 Years and over | 0 (0.0%) | 31 (100.0%) |
Disability Class: Self-Care Difficulty
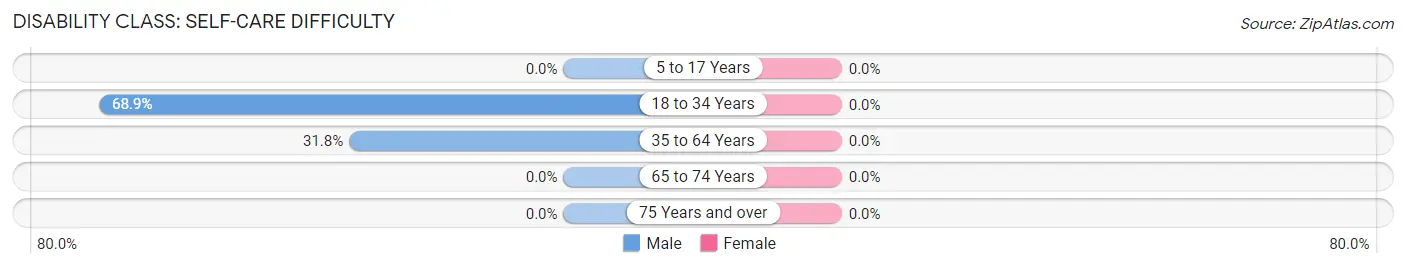
| Age Bracket | Male | Female |
| 5 to 17 Years | 0 (0.0%) | 0 (0.0%) |
| 18 to 34 Years | 91 (68.9%) | 0 (0.0%) |
| 35 to 64 Years | 7 (31.8%) | 0 (0.0%) |
| 65 to 74 Years | 0 (0.0%) | 0 (0.0%) |
| 75 Years and over | 0 (0.0%) | 0 (0.0%) |
Technology Access in Smartsville
Computing Device Access in Smartsville
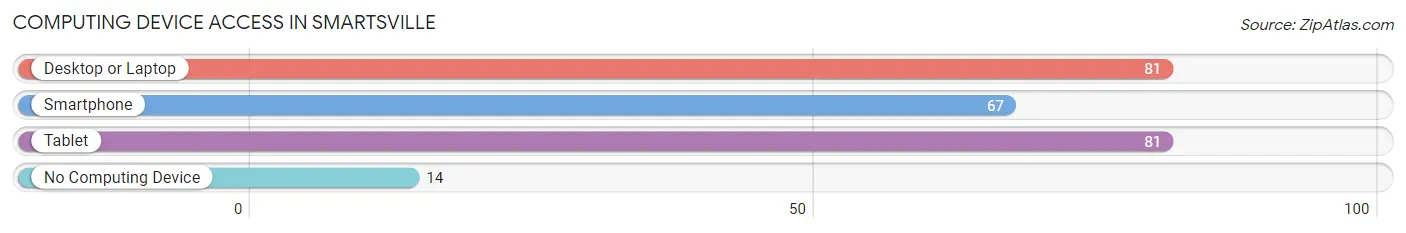
| Device Type | # Households | % Households |
| Desktop or Laptop | 81 | 74.3% |
| Smartphone | 67 | 61.5% |
| Tablet | 81 | 74.3% |
| No Computing Device | 14 | 12.8% |
| Total | 109 | 100.0% |
Internet Access in Smartsville
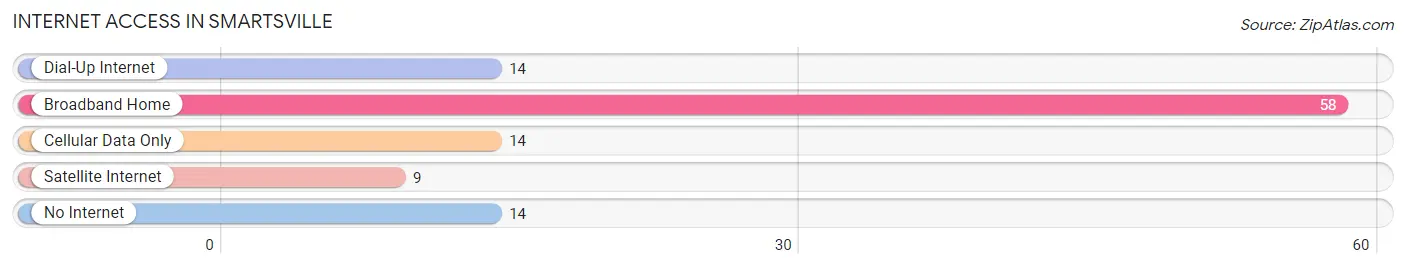
| Internet Type | # Households | % Households |
| Dial-Up Internet | 14 | 12.8% |
| Broadband Home | 58 | 53.2% |
| Cellular Data Only | 14 | 12.8% |
| Satellite Internet | 9 | 8.3% |
| No Internet | 14 | 12.8% |
| Total | 109 | 100.0% |
Smartsville Summary
Smartsville is a small unincorporated community located in Yuba County, California. It is situated in the Sierra Nevada foothills, approximately 20 miles northeast of Marysville and 40 miles north of Sacramento. The population of Smartsville was estimated to be around 200 people in 2020.
History
Smartsville was founded in 1852 by William Smart, a gold miner who had come to California during the Gold Rush. He named the town after himself and it quickly became a bustling mining town. The town was home to several saloons, a hotel, a blacksmith shop, and a general store. In 1854, the first post office was established in Smartsville.
In the late 1800s, the town began to decline as the gold mines were depleted and the population began to move away. By the early 1900s, the town was nearly abandoned. In the 1950s, the town was revived when the Smartsville-Penn Valley Highway was built, connecting the town to Marysville and Sacramento.
Geography
Smartsville is located in the Sierra Nevada foothills, at an elevation of 1,400 feet. The town is situated in a valley surrounded by rolling hills and mountains. The area is known for its scenic beauty and is a popular destination for outdoor recreation.
The climate in Smartsville is mild and temperate, with hot summers and cool winters. The average annual temperature is around 60 degrees Fahrenheit. The area receives an average of 20 inches of precipitation per year, mostly in the form of rain.
Economy
The economy of Smartsville is largely based on agriculture and tourism. The town is home to several wineries and vineyards, as well as a number of small farms and ranches. The area is also popular with tourists, who come to enjoy the scenic beauty and outdoor recreation opportunities.
Demographics
The population of Smartsville was estimated to be around 200 people in 2020. The town is predominantly white, with a small Hispanic population. The median household income is around $50,000, and the median home value is around $250,000. The town has a low unemployment rate and a high rate of homeownership.
Smartsville is a small, rural community with a rich history and a strong sense of community. The town is known for its scenic beauty and outdoor recreation opportunities, and is a popular destination for tourists and locals alike. The town is home to a diverse population and a thriving economy, making it a great place to live and work.
Common Questions
What is Per Capita Income in Smartsville?
Per Capita income in Smartsville is $24,647.
What is the Median Family Income in Smartsville?
Median Family Income in Smartsville is $76,581.
What is the Median Household income in Smartsville?
Median Household Income in Smartsville is $76,213.
What is Inequality or Gini Index in Smartsville?
Inequality or Gini Index in Smartsville is 0.20.
What is the Total Population of Smartsville?
Total Population of Smartsville is 379.
What is the Total Male Population of Smartsville?
Total Male Population of Smartsville is 219.
What is the Total Female Population of Smartsville?
Total Female Population of Smartsville is 160.
What is the Ratio of Males per 100 Females in Smartsville?
There are 136.88 Males per 100 Females in Smartsville.
What is the Ratio of Females per 100 Males in Smartsville?
There are 73.06 Females per 100 Males in Smartsville.
What is the Median Population Age in Smartsville?
Median Population Age in Smartsville is 30.5 Years.
What is the Average Family Size in Smartsville
Average Family Size in Smartsville is 4.8 People.
What is the Average Household Size in Smartsville
Average Household Size in Smartsville is 3.5 People.
How Large is the Labor Force in Smartsville?
There are 71 People in the Labor Forcein in Smartsville.
What is the Percentage of People in the Labor Force in Smartsville?
22.7% of People are in the Labor Force in Smartsville.