Cities with the Highest Percentage of Population with a Degree in Visual and Performing Arts in Massachusetts
RELATED REPORTS & OPTIONS
Visual and Performing Arts
Massachusetts
Compare Cities
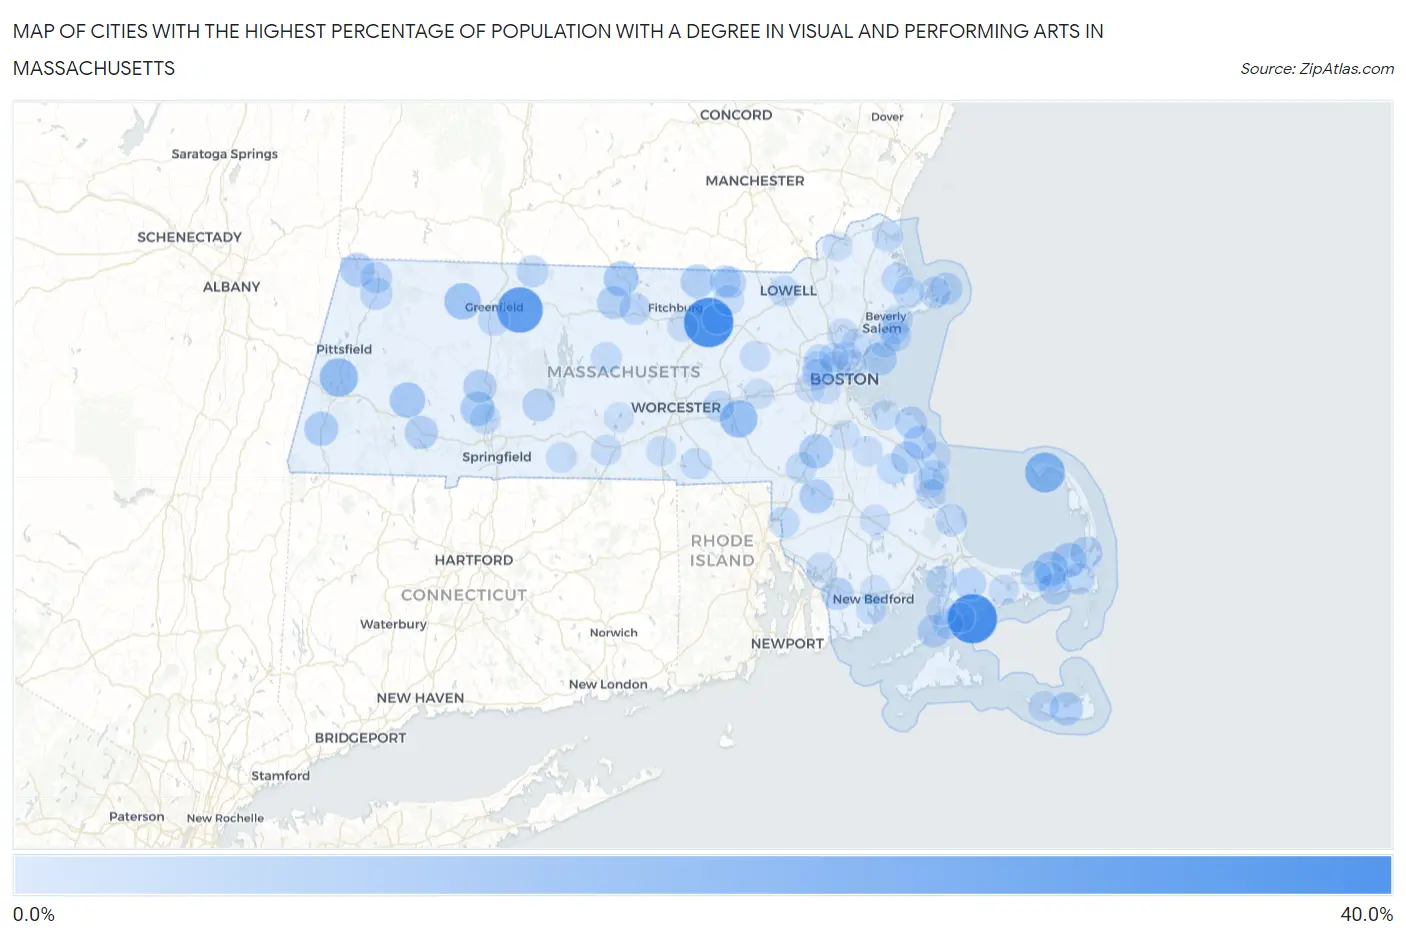
Map of Cities with the Highest Percentage of Population with a Degree in Visual and Performing Arts in Massachusetts
0.0%
40.0%
Cities with the Highest Percentage of Population with a Degree in Visual and Performing Arts in Massachusetts
| City | % Graduates | vs State | vs National | |
| 1. | Shirley | 34.5% | 4.7%(+29.8)#1 | 4.3%(+30.3)#233 |
| 2. | Monomoscoy Island | 34.1% | 4.7%(+29.4)#2 | 4.3%(+29.8)#239 |
| 3. | Millers Falls | 28.6% | 4.7%(+23.9)#3 | 4.3%(+24.3)#336 |
| 4. | Provincetown | 19.8% | 4.7%(+15.0)#4 | 4.3%(+15.5)#652 |
| 5. | Lenox | 17.5% | 4.7%(+12.8)#5 | 4.3%(+13.3)#810 |
| 6. | Hopkinton | 16.3% | 4.7%(+11.6)#6 | 4.3%(+12.1)#930 |
| 7. | Shelburne Falls | 14.7% | 4.7%(+10.00)#7 | 4.3%(+10.5)#1,094 |
| 8. | Chester | 13.2% | 4.7%(+8.52)#8 | 4.3%(+8.98)#1,317 |
| 9. | Winchendon | 12.4% | 4.7%(+7.70)#9 | 4.3%(+8.16)#1,440 |
| 10. | West Warren | 12.4% | 4.7%(+7.69)#10 | 4.3%(+8.15)#1,441 |
| 11. | Brewster | 11.9% | 4.7%(+7.21)#11 | 4.3%(+7.67)#1,537 |
| 12. | East Dennis | 11.9% | 4.7%(+7.20)#12 | 4.3%(+7.66)#1,538 |
| 13. | Easthampton Town | 11.8% | 4.7%(+7.06)#13 | 4.3%(+7.52)#1,568 |
| 14. | Sharon | 11.6% | 4.7%(+6.91)#14 | 4.3%(+7.38)#1,598 |
| 15. | Great Barrington | 11.4% | 4.7%(+6.71)#15 | 4.3%(+7.18)#1,636 |
| 16. | Williamstown | 11.3% | 4.7%(+6.61)#16 | 4.3%(+7.08)#1,648 |
| 17. | Norton Center | 11.0% | 4.7%(+6.32)#17 | 4.3%(+6.78)#1,748 |
| 18. | Townsend | 10.5% | 4.7%(+5.77)#18 | 4.3%(+6.24)#1,904 |
| 19. | Nahant | 10.3% | 4.7%(+5.62)#19 | 4.3%(+6.09)#1,954 |
| 20. | Blandford | 10.2% | 4.7%(+5.49)#20 | 4.3%(+5.95)#1,991 |
| 21. | Nantucket | 10.1% | 4.7%(+5.43)#21 | 4.3%(+5.89)#2,019 |
| 22. | Baldwinville | 9.9% | 4.7%(+5.22)#22 | 4.3%(+5.68)#2,096 |
| 23. | Northampton | 9.9% | 4.7%(+5.19)#23 | 4.3%(+5.65)#2,103 |
| 24. | Marshfield Hills | 9.5% | 4.7%(+4.74)#24 | 4.3%(+5.21)#2,266 |
| 25. | Woods Hole | 9.4% | 4.7%(+4.68)#25 | 4.3%(+5.15)#2,287 |
| 26. | Belchertown | 9.2% | 4.7%(+4.47)#26 | 4.3%(+4.93)#2,365 |
| 27. | North Pembroke | 9.2% | 4.7%(+4.44)#27 | 4.3%(+4.90)#2,379 |
| 28. | North Westport | 9.0% | 4.7%(+4.27)#28 | 4.3%(+4.73)#2,458 |
| 29. | Forestdale | 8.8% | 4.7%(+4.09)#29 | 4.3%(+4.55)#2,554 |
| 30. | Adams | 8.6% | 4.7%(+3.92)#30 | 4.3%(+4.39)#2,631 |
| 31. | North Scituate | 8.6% | 4.7%(+3.91)#31 | 4.3%(+4.37)#2,637 |
| 32. | Rockport | 8.6% | 4.7%(+3.88)#32 | 4.3%(+4.34)#2,649 |
| 33. | Orleans | 8.5% | 4.7%(+3.81)#33 | 4.3%(+4.27)#2,687 |
| 34. | The Pinehills | 8.3% | 4.7%(+3.59)#34 | 4.3%(+4.05)#2,811 |
| 35. | Northfield | 8.1% | 4.7%(+3.36)#35 | 4.3%(+3.82)#2,923 |
| 36. | Amherst | 8.1% | 4.7%(+3.34)#36 | 4.3%(+3.80)#2,937 |
| 37. | Gardner | 8.0% | 4.7%(+3.29)#37 | 4.3%(+3.76)#2,960 |
| 38. | East Pepperell | 8.0% | 4.7%(+3.27)#38 | 4.3%(+3.73)#2,985 |
| 39. | North Adams | 8.0% | 4.7%(+3.26)#39 | 4.3%(+3.72)#2,990 |
| 40. | Dennis Port | 8.0% | 4.7%(+3.24)#40 | 4.3%(+3.71)#3,000 |
| 41. | East Harwich | 7.8% | 4.7%(+3.06)#41 | 4.3%(+3.52)#3,108 |
| 42. | Ipswich | 7.7% | 4.7%(+2.99)#42 | 4.3%(+3.45)#3,140 |
| 43. | Gloucester | 7.7% | 4.7%(+2.96)#43 | 4.3%(+3.42)#3,185 |
| 44. | Deerfield | 7.6% | 4.7%(+2.89)#44 | 4.3%(+3.35)#3,229 |
| 45. | South Dennis | 7.5% | 4.7%(+2.81)#45 | 4.3%(+3.28)#3,281 |
| 46. | Pepperell | 7.5% | 4.7%(+2.81)#46 | 4.3%(+3.27)#3,285 |
| 47. | Greenfield | 7.5% | 4.7%(+2.78)#47 | 4.3%(+3.24)#3,294 |
| 48. | Yarmouth Port | 7.5% | 4.7%(+2.78)#48 | 4.3%(+3.24)#3,296 |
| 49. | Essex | 7.5% | 4.7%(+2.74)#49 | 4.3%(+3.20)#3,321 |
| 50. | Arlington | 7.4% | 4.7%(+2.70)#50 | 4.3%(+3.16)#3,344 |
| 51. | South Duxbury | 7.3% | 4.7%(+2.62)#51 | 4.3%(+3.09)#3,406 |
| 52. | Westborough | 7.3% | 4.7%(+2.62)#52 | 4.3%(+3.08)#3,413 |
| 53. | Devens | 7.3% | 4.7%(+2.58)#53 | 4.3%(+3.05)#3,447 |
| 54. | Foxborough | 7.1% | 4.7%(+2.38)#54 | 4.3%(+2.84)#3,629 |
| 55. | East Douglas | 7.1% | 4.7%(+2.38)#55 | 4.3%(+2.84)#3,632 |
| 56. | North Seekonk | 7.0% | 4.7%(+2.29)#56 | 4.3%(+2.76)#3,695 |
| 57. | Barre | 7.0% | 4.7%(+2.24)#57 | 4.3%(+2.70)#3,742 |
| 58. | Pocasset | 6.9% | 4.7%(+2.16)#58 | 4.3%(+2.62)#3,816 |
| 59. | Salem | 6.8% | 4.7%(+2.04)#59 | 4.3%(+2.50)#3,951 |
| 60. | Newburyport | 6.7% | 4.7%(+2.03)#60 | 4.3%(+2.49)#3,957 |
| 61. | Falmouth | 6.7% | 4.7%(+2.02)#61 | 4.3%(+2.49)#3,967 |
| 62. | Bliss Corner | 6.7% | 4.7%(+1.95)#62 | 4.3%(+2.41)#4,061 |
| 63. | Belmont | 6.6% | 4.7%(+1.90)#63 | 4.3%(+2.36)#4,106 |
| 64. | Lowell | 6.6% | 4.7%(+1.89)#64 | 4.3%(+2.36)#4,112 |
| 65. | Hanson | 6.6% | 4.7%(+1.87)#65 | 4.3%(+2.33)#4,130 |
| 66. | Duxbury | 6.5% | 4.7%(+1.83)#66 | 4.3%(+2.29)#4,151 |
| 67. | Holyoke | 6.5% | 4.7%(+1.78)#67 | 4.3%(+2.24)#4,200 |
| 68. | Chelsea | 6.4% | 4.7%(+1.73)#68 | 4.3%(+2.19)#4,250 |
| 69. | Groton | 6.4% | 4.7%(+1.71)#69 | 4.3%(+2.17)#4,265 |
| 70. | Madaket | 6.4% | 4.7%(+1.71)#70 | 4.3%(+2.17)#4,272 |
| 71. | Monson Center | 6.4% | 4.7%(+1.67)#71 | 4.3%(+2.13)#4,310 |
| 72. | Somerville | 6.4% | 4.7%(+1.66)#72 | 4.3%(+2.13)#4,318 |
| 73. | Maynard | 6.4% | 4.7%(+1.66)#73 | 4.3%(+2.13)#4,319 |
| 74. | Leominster | 6.3% | 4.7%(+1.58)#74 | 4.3%(+2.04)#4,392 |
| 75. | Swampscott | 6.2% | 4.7%(+1.46)#75 | 4.3%(+1.92)#4,524 |
| 76. | Watertown Town | 6.2% | 4.7%(+1.45)#76 | 4.3%(+1.91)#4,529 |
| 77. | Wakefield | 6.1% | 4.7%(+1.43)#77 | 4.3%(+1.90)#4,540 |
| 78. | Fiskdale | 6.1% | 4.7%(+1.43)#78 | 4.3%(+1.89)#4,546 |
| 79. | Barnstable Town | 6.1% | 4.7%(+1.38)#79 | 4.3%(+1.85)#4,591 |
| 80. | Beverly | 6.1% | 4.7%(+1.38)#80 | 4.3%(+1.84)#4,599 |
| 81. | West Falmouth | 6.1% | 4.7%(+1.38)#81 | 4.3%(+1.84)#4,601 |
| 82. | Marblehead | 6.0% | 4.7%(+1.33)#82 | 4.3%(+1.80)#4,669 |
| 83. | Hingham | 6.0% | 4.7%(+1.30)#83 | 4.3%(+1.77)#4,702 |
| 84. | Middleborough Center | 6.0% | 4.7%(+1.24)#84 | 4.3%(+1.70)#4,763 |
| 85. | Brookline | 5.8% | 4.7%(+1.09)#85 | 4.3%(+1.55)#4,933 |
| 86. | Saugus | 5.8% | 4.7%(+1.08)#86 | 4.3%(+1.55)#4,948 |
| 87. | Abington | 5.8% | 4.7%(+1.05)#87 | 4.3%(+1.52)#4,983 |
| 88. | East Falmouth | 5.7% | 4.7%(+0.982)#88 | 4.3%(+1.44)#5,074 |
| 89. | North Plymouth | 5.7% | 4.7%(+0.959)#89 | 4.3%(+1.42)#5,093 |
| 90. | Oxford | 5.6% | 4.7%(+0.882)#90 | 4.3%(+1.34)#5,185 |
| 91. | Somerset | 5.6% | 4.7%(+0.870)#91 | 4.3%(+1.33)#5,194 |
| 92. | Framingham | 5.6% | 4.7%(+0.843)#92 | 4.3%(+1.31)#5,220 |
| 93. | Newton | 5.5% | 4.7%(+0.813)#93 | 4.3%(+1.28)#5,281 |
| 94. | Ocean Bluff Brant Rock | 5.5% | 4.7%(+0.774)#94 | 4.3%(+1.24)#5,319 |
| 95. | Malden | 5.4% | 4.7%(+0.672)#95 | 4.3%(+1.14)#5,464 |
| 96. | East Brookfield | 5.4% | 4.7%(+0.654)#96 | 4.3%(+1.12)#5,489 |
| 97. | Randolph Town | 5.4% | 4.7%(+0.642)#97 | 4.3%(+1.11)#5,505 |
| 98. | Medford | 5.4% | 4.7%(+0.641)#98 | 4.3%(+1.10)#5,514 |
| 99. | Haverhill | 5.3% | 4.7%(+0.576)#99 | 4.3%(+1.04)#5,581 |
| 100. | New Bedford | 5.3% | 4.7%(+0.549)#100 | 4.3%(+1.01)#5,614 |
Common Questions
What are the Top 10 Cities with the Highest Percentage of Population with a Degree in Visual and Performing Arts in Massachusetts?
Top 10 Cities with the Highest Percentage of Population with a Degree in Visual and Performing Arts in Massachusetts are:
#1
34.5%
#2
34.1%
#3
28.6%
#4
19.8%
#5
17.5%
#6
16.3%
#7
14.7%
#8
13.2%
#9
12.4%
#10
11.9%
What city has the Highest Percentage of Population with a Degree in Visual and Performing Arts in Massachusetts?
Shirley has the Highest Percentage of Population with a Degree in Visual and Performing Arts in Massachusetts with 34.5%.
What is the Percentage of Population with a Degree in Visual and Performing Arts in the State of Massachusetts?
Percentage of Population with a Degree in Visual and Performing Arts in Massachusetts is 4.7%.
What is the Percentage of Population with a Degree in Visual and Performing Arts in the United States?
Percentage of Population with a Degree in Visual and Performing Arts in the United States is 4.3%.