Zip Codes with the Highest Percentage of Population with a Degree in Visual and Performing Arts in San Luis Obispo, CA
RELATED REPORTS & OPTIONS
Visual and Performing Arts
San Luis Obispo
Compare Zip Codes
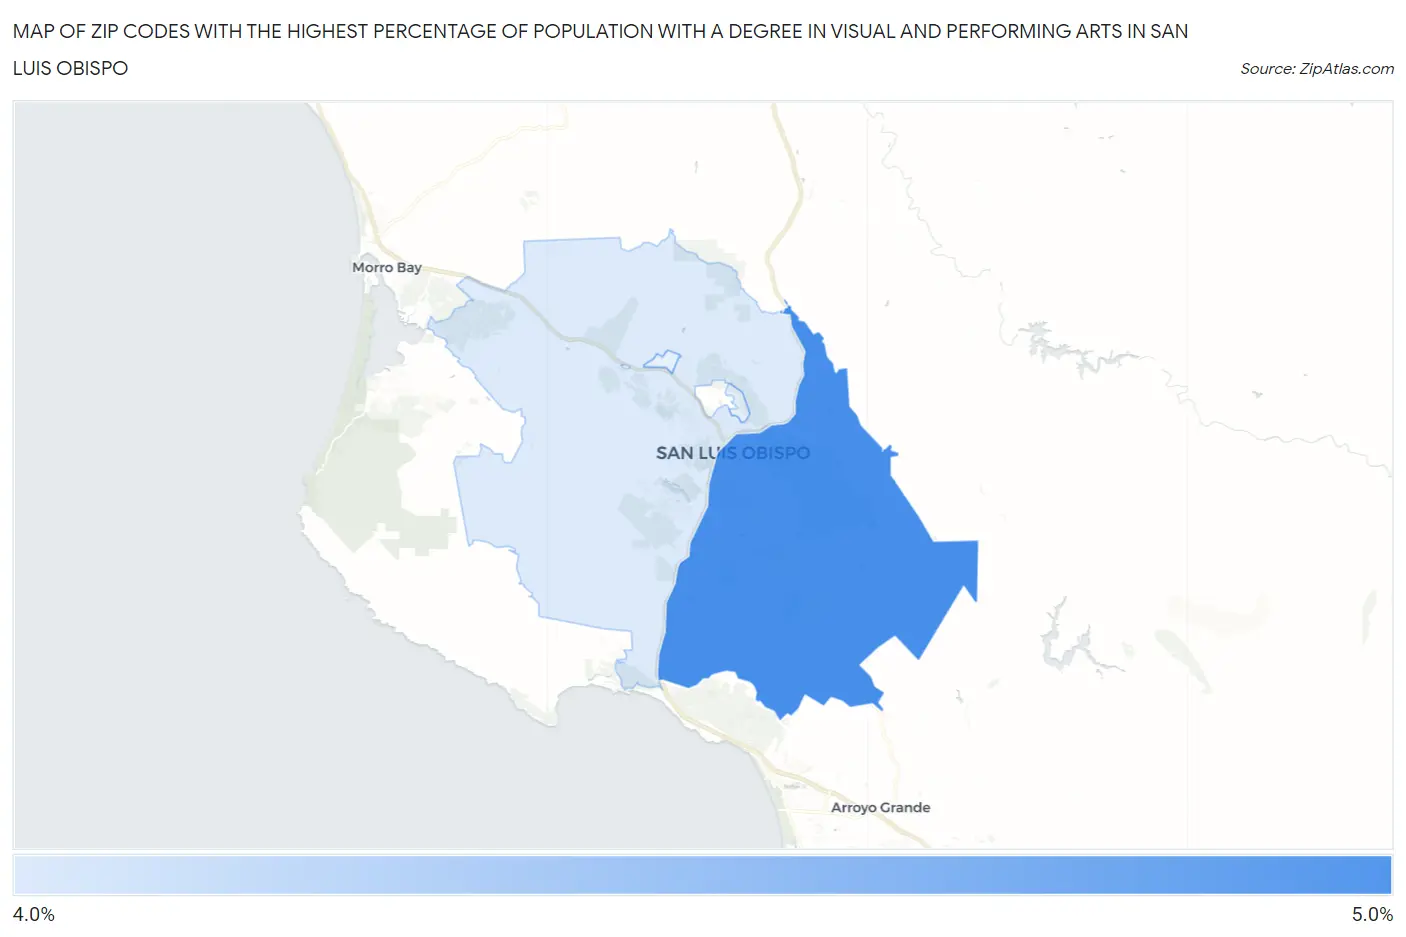
Map of Zip Codes with the Highest Percentage of Population with a Degree in Visual and Performing Arts in San Luis Obispo
4.1%
4.6%
Zip Codes with the Highest Percentage of Population with a Degree in Visual and Performing Arts in San Luis Obispo, CA
| Zip Code | % Graduates | vs State | vs National | |
| 1. | 93401 | 4.6% | 5.7%(-1.13)#732 | 4.3%(+0.357)#7,530 |
| 2. | 93405 | 4.1% | 5.7%(-1.61)#839 | 4.3%(-0.120)#8,828 |
1
Common Questions
What are the Top 3 Zip Codes with the Highest Percentage of Population with a Degree in Visual and Performing Arts in San Luis Obispo, CA?
Top 3 Zip Codes with the Highest Percentage of Population with a Degree in Visual and Performing Arts in San Luis Obispo, CA are:
What zip code has the Highest Percentage of Population with a Degree in Visual and Performing Arts in San Luis Obispo, CA?
93401 has the Highest Percentage of Population with a Degree in Visual and Performing Arts in San Luis Obispo, CA with 4.6%.
What is the Percentage of Population with a Degree in Visual and Performing Arts in San Luis Obispo, CA?
Percentage of Population with a Degree in Visual and Performing Arts in San Luis Obispo is 4.5%.
What is the Percentage of Population with a Degree in Visual and Performing Arts in California?
Percentage of Population with a Degree in Visual and Performing Arts in California is 5.7%.
What is the Percentage of Population with a Degree in Visual and Performing Arts in the United States?
Percentage of Population with a Degree in Visual and Performing Arts in the United States is 4.3%.