Zip Codes with the Highest Percentage of Population with a Degree in Visual and Performing Arts in Victorville, CA
RELATED REPORTS & OPTIONS
Visual and Performing Arts
Victorville
Compare Zip Codes
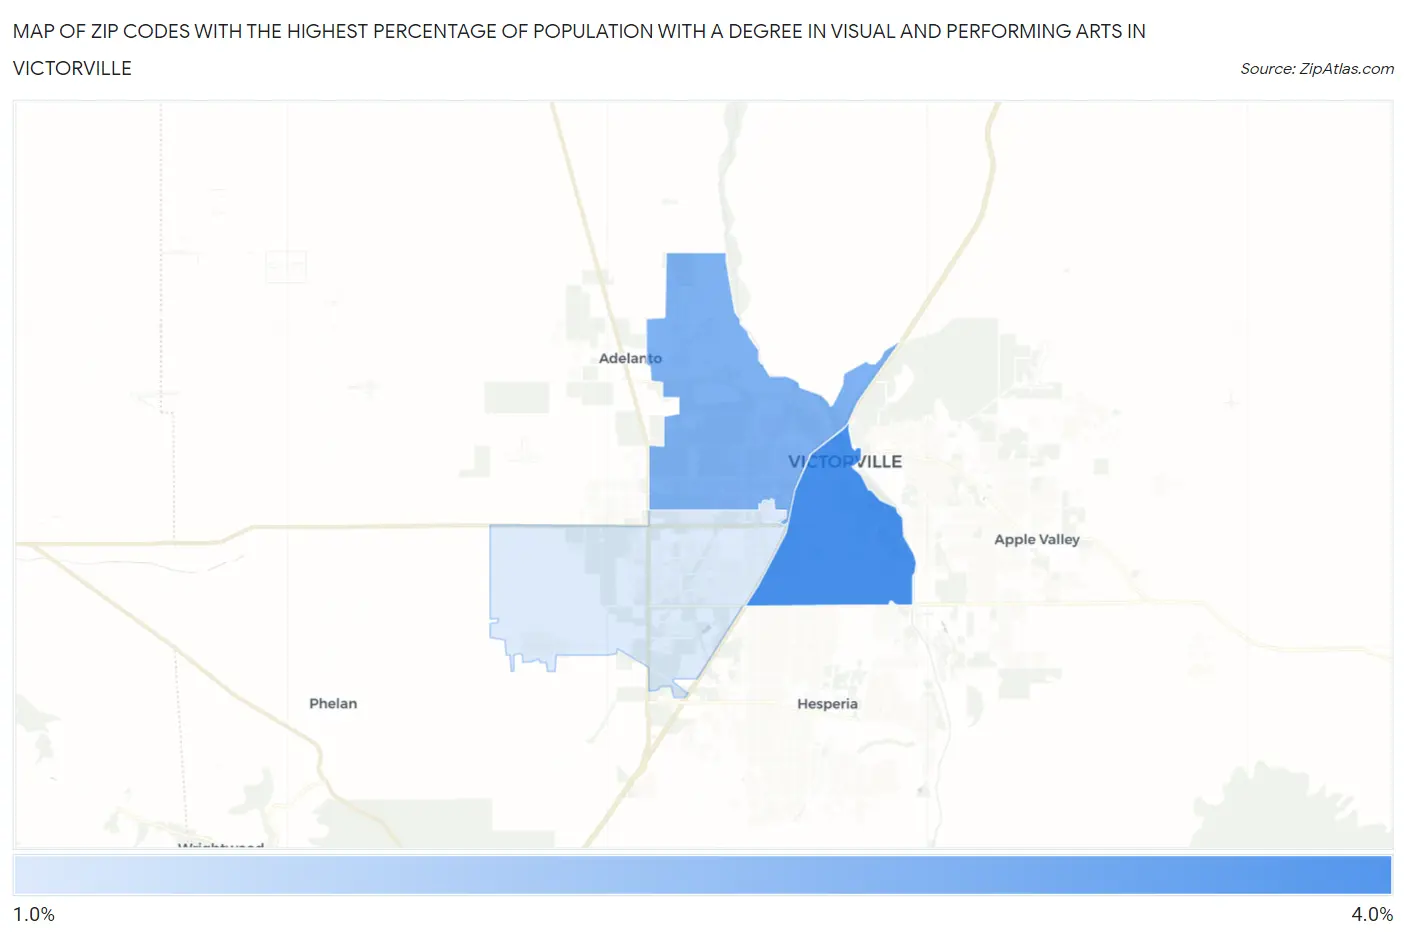
Map of Zip Codes with the Highest Percentage of Population with a Degree in Visual and Performing Arts in Victorville
1.6%
4.0%
Zip Codes with the Highest Percentage of Population with a Degree in Visual and Performing Arts in Victorville, CA
| Zip Code | % Graduates | vs State | vs National | |
| 1. | 92395 | 4.0% | 5.7%(-1.75)#884 | 4.3%(-0.261)#9,291 |
| 2. | 92394 | 3.1% | 5.7%(-2.64)#1,073 | 4.3%(-1.16)#12,355 |
| 3. | 92392 | 1.6% | 5.7%(-4.15)#1,321 | 4.3%(-2.66)#17,865 |
1
Common Questions
What are the Top Zip Codes with the Highest Percentage of Population with a Degree in Visual and Performing Arts in Victorville, CA?
Top Zip Codes with the Highest Percentage of Population with a Degree in Visual and Performing Arts in Victorville, CA are:
What zip code has the Highest Percentage of Population with a Degree in Visual and Performing Arts in Victorville, CA?
92395 has the Highest Percentage of Population with a Degree in Visual and Performing Arts in Victorville, CA with 4.0%.
What is the Percentage of Population with a Degree in Visual and Performing Arts in Victorville, CA?
Percentage of Population with a Degree in Visual and Performing Arts in Victorville is 1.9%.
What is the Percentage of Population with a Degree in Visual and Performing Arts in California?
Percentage of Population with a Degree in Visual and Performing Arts in California is 5.7%.
What is the Percentage of Population with a Degree in Visual and Performing Arts in the United States?
Percentage of Population with a Degree in Visual and Performing Arts in the United States is 4.3%.