Cities with the Highest Percentage of Population with a Degree in Visual and Performing Arts in Vermont
RELATED REPORTS & OPTIONS
Visual and Performing Arts
Vermont
Compare Cities
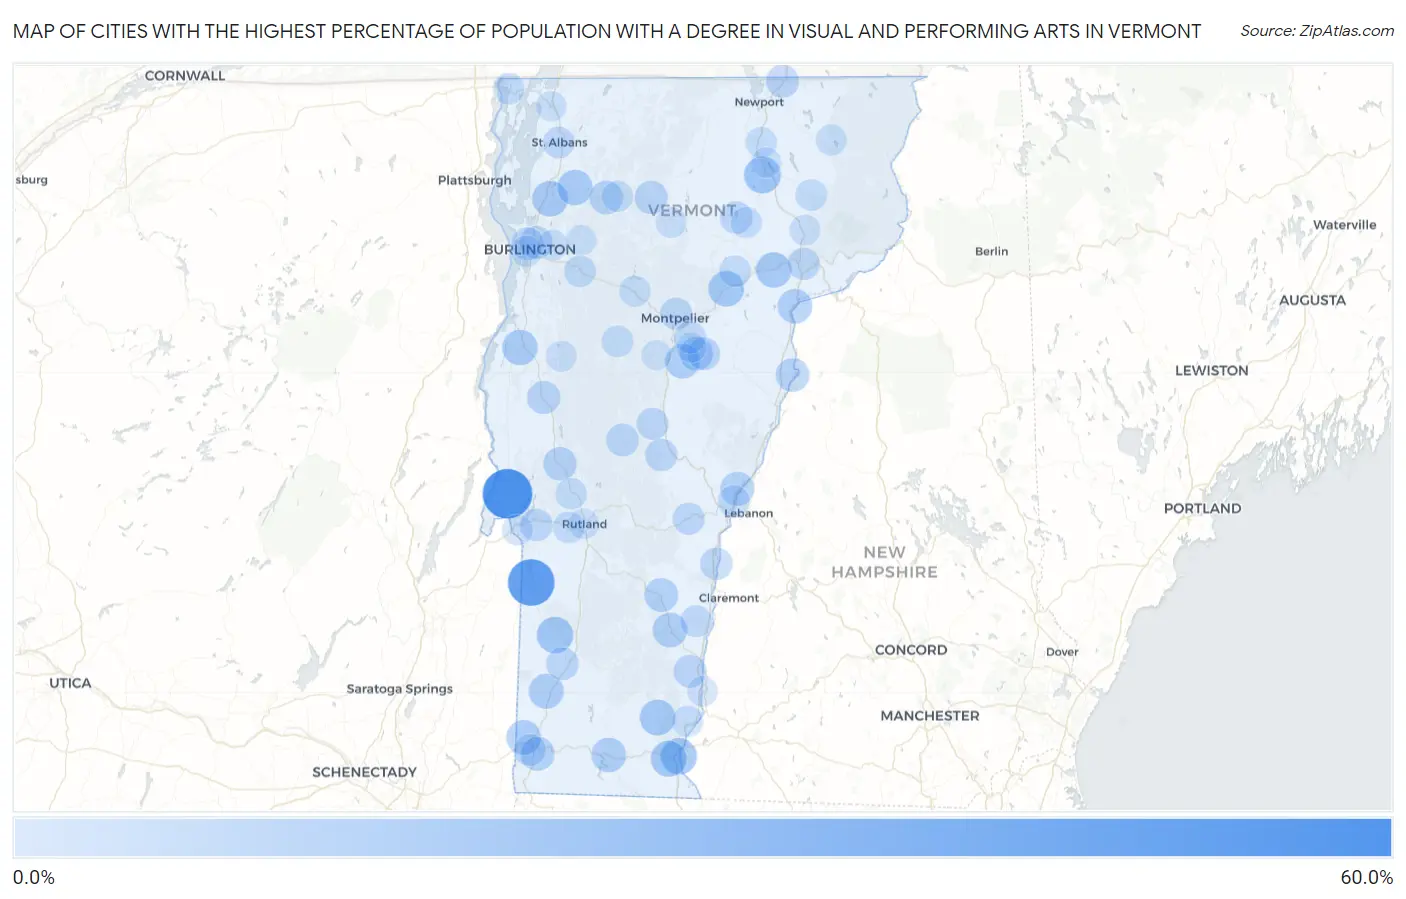
Map of Cities with the Highest Percentage of Population with a Degree in Visual and Performing Arts in Vermont
0.0%
60.0%
Cities with the Highest Percentage of Population with a Degree in Visual and Performing Arts in Vermont
| City | % Graduates | vs State | vs National | |
| 1. | Benson | 60.0% | 6.7%(+53.3)#1 | 4.3%(+55.7)#83 |
| 2. | Wells | 51.0% | 6.7%(+44.3)#2 | 4.3%(+46.7)#107 |
| 3. | Grafton | 41.2% | 6.7%(+34.5)#3 | 4.3%(+36.9)#171 |
| 4. | South Londonderry | 31.7% | 6.7%(+25.1)#4 | 4.3%(+27.5)#284 |
| 5. | West Pawlet | 29.4% | 6.7%(+22.7)#5 | 4.3%(+25.2)#319 |
| 6. | Underhill Center | 29.1% | 6.7%(+22.4)#6 | 4.3%(+24.8)#328 |
| 7. | South Hero | 22.0% | 6.7%(+15.3)#7 | 4.3%(+17.7)#529 |
| 8. | Glover | 21.7% | 6.7%(+15.0)#8 | 4.3%(+17.5)#541 |
| 9. | Wolcott | 21.7% | 6.7%(+15.0)#9 | 4.3%(+17.5)#542 |
| 10. | Brattleboro | 20.5% | 6.7%(+13.8)#10 | 4.3%(+16.2)#601 |
| 11. | Dorset | 20.2% | 6.7%(+13.5)#11 | 4.3%(+16.0)#617 |
| 12. | Jamaica | 20.0% | 6.7%(+13.3)#12 | 4.3%(+15.7)#641 |
| 13. | North Clarendon | 19.1% | 6.7%(+12.5)#13 | 4.3%(+14.9)#696 |
| 14. | West Brattleboro | 19.0% | 6.7%(+12.3)#14 | 4.3%(+14.7)#714 |
| 15. | Newfane | 18.9% | 6.7%(+12.2)#15 | 4.3%(+14.6)#719 |
| 16. | Marshfield | 18.6% | 6.7%(+11.9)#16 | 4.3%(+14.3)#740 |
| 17. | Milton | 17.9% | 6.7%(+11.3)#17 | 4.3%(+13.7)#784 |
| 18. | East Poultney | 17.7% | 6.7%(+11.0)#18 | 4.3%(+13.5)#799 |
| 19. | Danville | 17.5% | 6.7%(+10.8)#19 | 4.3%(+13.3)#813 |
| 20. | Fairfax | 17.2% | 6.7%(+10.5)#20 | 4.3%(+12.9)#839 |
| 21. | Vergennes | 17.1% | 6.7%(+10.4)#21 | 4.3%(+12.8)#842 |
| 22. | West Charlotte | 16.7% | 6.7%(+9.98)#22 | 4.3%(+12.4)#891 |
| 23. | Arlington | 16.3% | 6.7%(+9.64)#23 | 4.3%(+12.1)#926 |
| 24. | North Bennington | 15.3% | 6.7%(+8.61)#24 | 4.3%(+11.0)#1,034 |
| 25. | Chester | 15.0% | 6.7%(+8.36)#25 | 4.3%(+10.8)#1,053 |
| 26. | Williamstown | 15.0% | 6.7%(+8.31)#26 | 4.3%(+10.7)#1,056 |
| 27. | Barnet | 15.0% | 6.7%(+8.31)#27 | 4.3%(+10.7)#1,065 |
| 28. | Wilmington | 14.7% | 6.7%(+7.98)#28 | 4.3%(+10.4)#1,098 |
| 29. | North Pownal | 14.5% | 6.7%(+7.77)#29 | 4.3%(+10.2)#1,128 |
| 30. | Peacham | 14.1% | 6.7%(+7.39)#30 | 4.3%(+9.83)#1,189 |
| 31. | Underhill Flats | 13.4% | 6.7%(+6.68)#31 | 4.3%(+9.12)#1,284 |
| 32. | Bennington | 13.3% | 6.7%(+6.64)#32 | 4.3%(+9.08)#1,306 |
| 33. | Norwich | 13.3% | 6.7%(+6.59)#33 | 4.3%(+9.03)#1,311 |
| 34. | Proctorsville | 12.7% | 6.7%(+6.05)#34 | 4.3%(+8.49)#1,382 |
| 35. | Newbury | 12.3% | 6.7%(+5.64)#35 | 4.3%(+8.08)#1,454 |
| 36. | Graniteville | 12.3% | 6.7%(+5.63)#36 | 4.3%(+8.07)#1,455 |
| 37. | Cambridge | 11.9% | 6.7%(+5.21)#37 | 4.3%(+7.65)#1,542 |
| 38. | Brandon | 11.6% | 6.7%(+4.94)#38 | 4.3%(+7.38)#1,600 |
| 39. | Sheffield | 11.1% | 6.7%(+4.42)#39 | 4.3%(+6.86)#1,720 |
| 40. | Danby | 11.1% | 6.7%(+4.42)#40 | 4.3%(+6.86)#1,722 |
| 41. | Johnson | 11.1% | 6.7%(+4.37)#41 | 4.3%(+6.81)#1,739 |
| 42. | Middlebury | 10.9% | 6.7%(+4.19)#42 | 4.3%(+6.63)#1,776 |
| 43. | Winooski | 10.3% | 6.7%(+3.66)#43 | 4.3%(+6.09)#1,946 |
| 44. | Derby Line | 10.2% | 6.7%(+3.49)#44 | 4.3%(+5.93)#2,003 |
| 45. | Bolton Valley | 10.0% | 6.7%(+3.31)#45 | 4.3%(+5.75)#2,078 |
| 46. | Saxtons River | 9.8% | 6.7%(+3.09)#46 | 4.3%(+5.53)#2,138 |
| 47. | East Barre | 9.8% | 6.7%(+3.06)#47 | 4.3%(+5.50)#2,147 |
| 48. | Rochester | 9.6% | 6.7%(+2.87)#48 | 4.3%(+5.31)#2,219 |
| 49. | Burlington | 9.5% | 6.7%(+2.83)#49 | 4.3%(+5.27)#2,246 |
| 50. | Manchester | 9.3% | 6.7%(+2.63)#50 | 4.3%(+5.06)#2,317 |
| 51. | Castleton | 9.3% | 6.7%(+2.57)#51 | 4.3%(+5.01)#2,339 |
| 52. | Middletown Springs | 9.1% | 6.7%(+2.40)#52 | 4.3%(+4.84)#2,420 |
| 53. | Greensboro | 9.1% | 6.7%(+2.40)#53 | 4.3%(+4.84)#2,423 |
| 54. | Bethel | 8.7% | 6.7%(+2.00)#54 | 4.3%(+4.44)#2,605 |
| 55. | St Johnsbury | 8.3% | 6.7%(+1.63)#55 | 4.3%(+4.07)#2,804 |
| 56. | Montpelier | 8.3% | 6.7%(+1.58)#56 | 4.3%(+4.02)#2,829 |
| 57. | Woodstock | 8.2% | 6.7%(+1.53)#57 | 4.3%(+3.97)#2,858 |
| 58. | Windsor | 8.1% | 6.7%(+1.38)#58 | 4.3%(+3.82)#2,927 |
| 59. | Randolph | 8.0% | 6.7%(+1.27)#59 | 4.3%(+3.71)#2,994 |
| 60. | Algiers | 7.8% | 6.7%(+1.15)#60 | 4.3%(+3.59)#3,064 |
| 61. | New Haven | 7.7% | 6.7%(+1.00)#61 | 4.3%(+3.44)#3,170 |
| 62. | Westford | 7.6% | 6.7%(+0.917)#62 | 4.3%(+3.36)#3,226 |
| 63. | Barre | 7.6% | 6.7%(+0.909)#63 | 4.3%(+3.35)#3,232 |
| 64. | Huntington Center | 7.3% | 6.7%(+0.600)#64 | 4.3%(+3.04)#3,452 |
| 65. | Wilder | 7.1% | 6.7%(+0.419)#65 | 4.3%(+2.86)#3,618 |
| 66. | Springfield | 7.1% | 6.7%(+0.410)#66 | 4.3%(+2.85)#3,626 |
| 67. | Richmond | 6.8% | 6.7%(+0.158)#67 | 4.3%(+2.60)#3,838 |
| 68. | Castleton Four Corners | 6.8% | 6.7%(+0.151)#68 | 4.3%(+2.59)#3,843 |
| 69. | St Albans | 6.8% | 6.7%(+0.145)#69 | 4.3%(+2.58)#3,848 |
| 70. | Old Bennington | 6.8% | 6.7%(+0.105)#70 | 4.3%(+2.54)#3,901 |
| 71. | West Burke | 6.7% | 6.7%(-0.025)#71 | 4.3%(+2.41)#4,052 |
| 72. | Waitsfield | 6.6% | 6.7%(-0.105)#72 | 4.3%(+2.33)#4,129 |
| 73. | Cabot | 6.4% | 6.7%(-0.309)#73 | 4.3%(+2.13)#4,315 |
| 74. | Alburgh | 6.2% | 6.7%(-0.442)#74 | 4.3%(+2.00)#4,442 |
| 75. | West Rutland | 6.1% | 6.7%(-0.587)#75 | 4.3%(+1.85)#4,588 |
| 76. | Harmonyville | 5.9% | 6.7%(-0.809)#76 | 4.3%(+1.63)#4,858 |
| 77. | Pittsford | 5.8% | 6.7%(-0.844)#77 | 4.3%(+1.60)#4,897 |
| 78. | Waterbury | 5.5% | 6.7%(-1.15)#78 | 4.3%(+1.29)#5,269 |
| 79. | Jeffersonville | 5.3% | 6.7%(-1.35)#79 | 4.3%(+1.09)#5,528 |
| 80. | Greensboro Bend | 5.1% | 6.7%(-1.61)#80 | 4.3%(+0.833)#5,873 |
| 81. | Orleans | 5.1% | 6.7%(-1.63)#81 | 4.3%(+0.811)#5,906 |
| 82. | Putney | 4.9% | 6.7%(-1.80)#82 | 4.3%(+0.643)#6,179 |
| 83. | Pawlet | 4.7% | 6.7%(-1.99)#83 | 4.3%(+0.454)#6,516 |
| 84. | Lincoln | 4.6% | 6.7%(-2.09)#84 | 4.3%(+0.346)#6,724 |
| 85. | Island Pond | 4.5% | 6.7%(-2.20)#85 | 4.3%(+0.242)#6,918 |
| 86. | Huntington | 4.5% | 6.7%(-2.24)#86 | 4.3%(+0.203)#6,997 |
| 87. | St. George | 4.4% | 6.7%(-2.25)#87 | 4.3%(+0.192)#7,014 |
| 88. | Morrisville | 4.3% | 6.7%(-2.38)#88 | 4.3%(+0.057)#7,280 |
| 89. | South Burlington | 4.3% | 6.7%(-2.41)#89 | 4.3%(+0.031)#7,338 |
| 90. | Lyndonville | 4.3% | 6.7%(-2.43)#90 | 4.3%(+0.013)#7,376 |
| 91. | Fair Haven | 4.0% | 6.7%(-2.69)#91 | 4.3%(-0.252)#7,920 |
| 92. | Bristol | 3.9% | 6.7%(-2.84)#92 | 4.3%(-0.399)#8,258 |
| 93. | Rutland | 3.8% | 6.7%(-2.86)#93 | 4.3%(-0.419)#8,328 |
| 94. | Essex Junction | 3.5% | 6.7%(-3.17)#94 | 4.3%(-0.734)#9,039 |
| 95. | Westminster | 3.3% | 6.7%(-3.36)#95 | 4.3%(-0.919)#9,504 |
| 96. | Jericho | 3.2% | 6.7%(-3.53)#96 | 4.3%(-1.09)#9,931 |
| 97. | Swanton | 3.0% | 6.7%(-3.73)#97 | 4.3%(-1.29)#10,435 |
| 98. | Barton | 2.9% | 6.7%(-3.83)#98 | 4.3%(-1.39)#10,727 |
| 99. | South Barre | 2.7% | 6.7%(-4.04)#99 | 4.3%(-1.60)#11,258 |
| 100. | Northfield | 2.4% | 6.7%(-4.25)#100 | 4.3%(-1.81)#11,807 |
1
2Common Questions
What are the Top 10 Cities with the Highest Percentage of Population with a Degree in Visual and Performing Arts in Vermont?
Top 10 Cities with the Highest Percentage of Population with a Degree in Visual and Performing Arts in Vermont are:
#1
60.0%
#2
51.0%
#3
21.7%
#4
20.5%
#5
20.2%
#6
19.0%
#7
18.9%
#8
18.6%
#9
17.9%
#10
17.5%
What city has the Highest Percentage of Population with a Degree in Visual and Performing Arts in Vermont?
Benson has the Highest Percentage of Population with a Degree in Visual and Performing Arts in Vermont with 60.0%.
What is the Percentage of Population with a Degree in Visual and Performing Arts in the State of Vermont?
Percentage of Population with a Degree in Visual and Performing Arts in Vermont is 6.7%.
What is the Percentage of Population with a Degree in Visual and Performing Arts in the United States?
Percentage of Population with a Degree in Visual and Performing Arts in the United States is 4.3%.