Cities with the Highest Percentage of Population with a Degree in Visual and Performing Arts in Colorado
RELATED REPORTS & OPTIONS
Visual and Performing Arts
Colorado
Compare Cities
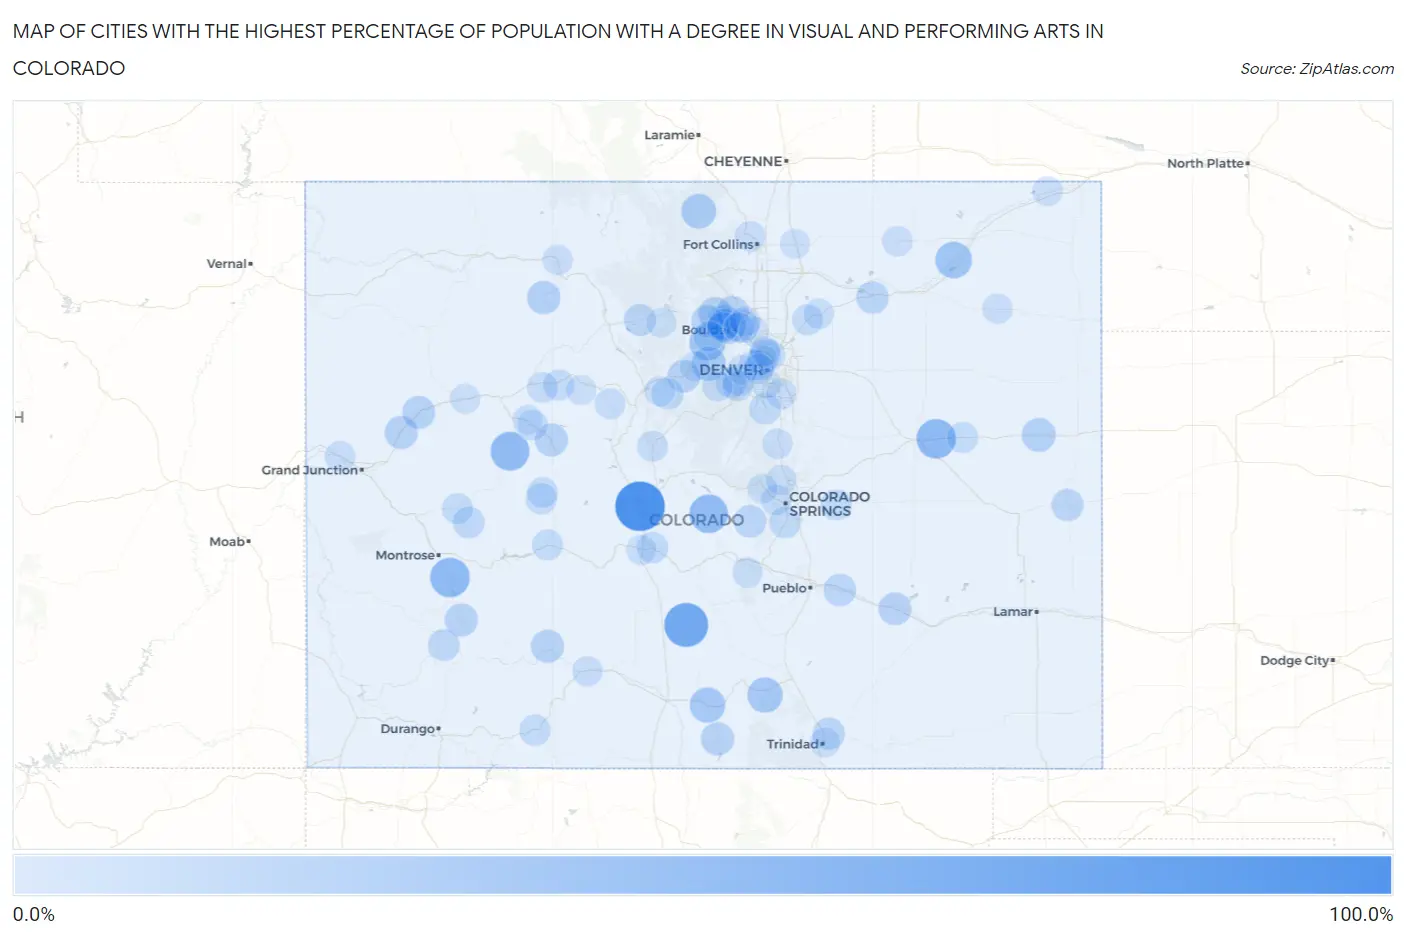
Map of Cities with the Highest Percentage of Population with a Degree in Visual and Performing Arts in Colorado
0.0%
100.0%
Cities with the Highest Percentage of Population with a Degree in Visual and Performing Arts in Colorado
| City | % Graduates | vs State | vs National | |
| 1. | Johnson Village | 81.4% | 4.3%(+77.1)#1 | 4.3%(+77.2)#54 |
| 2. | Crestone | 59.1% | 4.3%(+54.8)#2 | 4.3%(+54.8)#86 |
| 3. | Colona | 41.5% | 4.3%(+37.1)#3 | 4.3%(+37.2)#166 |
| 4. | Genoa | 41.2% | 4.3%(+36.8)#4 | 4.3%(+36.9)#170 |
| 5. | Redstone | 38.5% | 4.3%(+34.1)#5 | 4.3%(+34.2)#185 |
| 6. | Guffey | 38.1% | 4.3%(+33.8)#6 | 4.3%(+33.8)#192 |
| 7. | Merino | 30.4% | 4.3%(+26.1)#7 | 4.3%(+26.2)#305 |
| 8. | Rollinsville | 28.1% | 4.3%(+23.8)#8 | 4.3%(+23.9)#353 |
| 9. | Blanca | 26.1% | 4.3%(+21.8)#9 | 4.3%(+21.8)#397 |
| 10. | La Veta | 25.6% | 4.3%(+21.2)#10 | 4.3%(+21.3)#406 |
| 11. | Seven Hills | 25.3% | 4.3%(+20.9)#11 | 4.3%(+21.0)#411 |
| 12. | Red Feather Lakes | 23.3% | 4.3%(+19.0)#12 | 4.3%(+19.1)#480 |
| 13. | Sunshine | 22.4% | 4.3%(+18.1)#13 | 4.3%(+18.2)#505 |
| 14. | Central City | 21.8% | 4.3%(+17.5)#14 | 4.3%(+17.6)#535 |
| 15. | Stratton | 20.0% | 4.3%(+15.7)#15 | 4.3%(+15.7)#622 |
| 16. | Matheson | 20.0% | 4.3%(+15.7)#16 | 4.3%(+15.7)#644 |
| 17. | Phippsburg | 18.0% | 4.3%(+13.7)#17 | 4.3%(+13.8)#777 |
| 18. | De Beque | 17.9% | 4.3%(+13.5)#18 | 4.3%(+13.6)#791 |
| 19. | San Luis | 17.5% | 4.3%(+13.2)#19 | 4.3%(+13.2)#814 |
| 20. | City Of Creede | 17.1% | 4.3%(+12.7)#20 | 4.3%(+12.8)#843 |
| 21. | Woody Creek | 16.9% | 4.3%(+12.6)#21 | 4.3%(+12.7)#856 |
| 22. | Ouray | 16.8% | 4.3%(+12.5)#22 | 4.3%(+12.6)#860 |
| 23. | Bark Ranch | 16.8% | 4.3%(+12.5)#23 | 4.3%(+12.5)#861 |
| 24. | Parachute | 16.7% | 4.3%(+12.3)#24 | 4.3%(+12.4)#868 |
| 25. | Valmont | 16.7% | 4.3%(+12.3)#25 | 4.3%(+12.4)#907 |
| 26. | Manzanola | 16.2% | 4.3%(+11.9)#26 | 4.3%(+12.0)#938 |
| 27. | Silver Plume | 16.2% | 4.3%(+11.8)#27 | 4.3%(+11.9)#939 |
| 28. | Altona | 16.1% | 4.3%(+11.8)#28 | 4.3%(+11.9)#940 |
| 29. | Park Center | 15.8% | 4.3%(+11.5)#29 | 4.3%(+11.5)#967 |
| 30. | Ward | 15.4% | 4.3%(+11.1)#30 | 4.3%(+11.1)#1,030 |
| 31. | Wiggins | 14.9% | 4.3%(+10.6)#31 | 4.3%(+10.7)#1,070 |
| 32. | Avondale | 14.5% | 4.3%(+10.2)#32 | 4.3%(+10.3)#1,117 |
| 33. | Victor | 14.5% | 4.3%(+10.2)#33 | 4.3%(+10.3)#1,118 |
| 34. | El Moro | 14.0% | 4.3%(+9.63)#34 | 4.3%(+9.70)#1,204 |
| 35. | Cheyenne Wells | 13.7% | 4.3%(+9.36)#35 | 4.3%(+9.44)#1,238 |
| 36. | Crisman | 13.4% | 4.3%(+9.08)#36 | 4.3%(+9.15)#1,280 |
| 37. | Hot Sulphur Springs | 13.2% | 4.3%(+8.88)#37 | 4.3%(+8.96)#1,321 |
| 38. | Ophir | 12.6% | 4.3%(+8.29)#38 | 4.3%(+8.37)#1,403 |
| 39. | Montezuma | 12.5% | 4.3%(+8.17)#39 | 4.3%(+8.25)#1,432 |
| 40. | Brook Forest | 12.3% | 4.3%(+7.93)#40 | 4.3%(+8.00)#1,465 |
| 41. | Crawford | 12.1% | 4.3%(+7.74)#41 | 4.3%(+7.82)#1,512 |
| 42. | Idledale | 11.7% | 4.3%(+7.36)#42 | 4.3%(+7.43)#1,591 |
| 43. | Louviers | 11.3% | 4.3%(+6.99)#43 | 4.3%(+7.07)#1,654 |
| 44. | Rock Creek Park | 11.2% | 4.3%(+6.89)#44 | 4.3%(+6.96)#1,673 |
| 45. | Pine Valley | 11.1% | 4.3%(+6.75)#45 | 4.3%(+6.82)#1,733 |
| 46. | Sherrelwood | 10.9% | 4.3%(+6.56)#46 | 4.3%(+6.63)#1,775 |
| 47. | Salida | 10.3% | 4.3%(+6.02)#47 | 4.3%(+6.10)#1,945 |
| 48. | Crested Butte | 10.3% | 4.3%(+5.98)#48 | 4.3%(+6.05)#1,959 |
| 49. | Ellicott | 10.2% | 4.3%(+5.88)#49 | 4.3%(+5.95)#1,989 |
| 50. | Pagosa Springs | 10.1% | 4.3%(+5.76)#50 | 4.3%(+5.84)#2,030 |
| 51. | Arriba | 9.7% | 4.3%(+5.35)#51 | 4.3%(+5.43)#2,186 |
| 52. | Gunnison | 9.4% | 4.3%(+5.09)#52 | 4.3%(+5.17)#2,280 |
| 53. | Hotchkiss | 9.3% | 4.3%(+4.98)#53 | 4.3%(+5.05)#2,322 |
| 54. | Eagle | 9.3% | 4.3%(+4.97)#54 | 4.3%(+5.04)#2,328 |
| 55. | Hudson | 9.3% | 4.3%(+4.95)#55 | 4.3%(+5.03)#2,330 |
| 56. | Kittredge | 9.1% | 4.3%(+4.76)#56 | 4.3%(+4.84)#2,394 |
| 57. | Gypsum | 9.0% | 4.3%(+4.65)#57 | 4.3%(+4.72)#2,471 |
| 58. | Welby | 8.7% | 4.3%(+4.39)#58 | 4.3%(+4.46)#2,589 |
| 59. | Mount Crested Butte | 8.7% | 4.3%(+4.35)#59 | 4.3%(+4.42)#2,614 |
| 60. | Mountain Meadows | 8.7% | 4.3%(+4.34)#60 | 4.3%(+4.41)#2,620 |
| 61. | Fairplay | 8.6% | 4.3%(+4.27)#61 | 4.3%(+4.34)#2,645 |
| 62. | Basalt | 8.4% | 4.3%(+4.04)#62 | 4.3%(+4.12)#2,757 |
| 63. | Manitou Springs | 8.0% | 4.3%(+3.64)#63 | 4.3%(+3.71)#2,992 |
| 64. | Red Cliff | 7.9% | 4.3%(+3.59)#64 | 4.3%(+3.67)#3,019 |
| 65. | Mountain View | 7.7% | 4.3%(+3.40)#65 | 4.3%(+3.47)#3,134 |
| 66. | Raymer New Raymer | 7.7% | 4.3%(+3.37)#66 | 4.3%(+3.44)#3,173 |
| 67. | Inverness | 7.6% | 4.3%(+3.29)#67 | 4.3%(+3.37)#3,216 |
| 68. | Gunbarrel | 7.4% | 4.3%(+3.08)#68 | 4.3%(+3.16)#3,346 |
| 69. | Indian Hills | 7.4% | 4.3%(+3.03)#69 | 4.3%(+3.10)#3,394 |
| 70. | Larkspur | 7.4% | 4.3%(+3.03)#70 | 4.3%(+3.10)#3,399 |
| 71. | Fruita | 7.3% | 4.3%(+2.95)#71 | 4.3%(+3.03)#3,466 |
| 72. | Wheat Ridge | 7.3% | 4.3%(+2.93)#72 | 4.3%(+3.00)#3,483 |
| 73. | Nederland | 7.2% | 4.3%(+2.92)#73 | 4.3%(+2.99)#3,492 |
| 74. | Berkley | 7.2% | 4.3%(+2.85)#74 | 4.3%(+2.93)#3,537 |
| 75. | Gerrard | 7.1% | 4.3%(+2.82)#75 | 4.3%(+2.89)#3,589 |
| 76. | Rockvale | 7.0% | 4.3%(+2.69)#76 | 4.3%(+2.77)#3,690 |
| 77. | Otis | 7.0% | 4.3%(+2.65)#77 | 4.3%(+2.72)#3,726 |
| 78. | Keenesburg | 6.8% | 4.3%(+2.48)#78 | 4.3%(+2.55)#3,891 |
| 79. | Upper Bear Creek | 6.8% | 4.3%(+2.47)#79 | 4.3%(+2.54)#3,903 |
| 80. | Laporte | 6.8% | 4.3%(+2.43)#80 | 4.3%(+2.51)#3,939 |
| 81. | Air Force Academy | 6.6% | 4.3%(+2.30)#81 | 4.3%(+2.38)#4,091 |
| 82. | Keystone | 6.6% | 4.3%(+2.29)#82 | 4.3%(+2.36)#4,103 |
| 83. | Steamboat Springs | 6.6% | 4.3%(+2.27)#83 | 4.3%(+2.34)#4,121 |
| 84. | Downieville Lawson Dumont | 6.5% | 4.3%(+2.16)#84 | 4.3%(+2.23)#4,208 |
| 85. | Boulder | 6.4% | 4.3%(+2.05)#85 | 4.3%(+2.12)#4,321 |
| 86. | El Jebel | 6.3% | 4.3%(+2.01)#86 | 4.3%(+2.08)#4,352 |
| 87. | Trinidad | 6.3% | 4.3%(+2.01)#87 | 4.3%(+2.08)#4,354 |
| 88. | Edgewater | 6.3% | 4.3%(+1.99)#88 | 4.3%(+2.06)#4,377 |
| 89. | Golden | 6.3% | 4.3%(+1.98)#89 | 4.3%(+2.05)#4,383 |
| 90. | Sedgwick | 6.2% | 4.3%(+1.92)#90 | 4.3%(+2.00)#4,458 |
| 91. | Silt | 6.2% | 4.3%(+1.91)#91 | 4.3%(+1.98)#4,467 |
| 92. | Lafayette | 6.2% | 4.3%(+1.89)#92 | 4.3%(+1.97)#4,485 |
| 93. | Green Mountain Falls | 6.2% | 4.3%(+1.85)#93 | 4.3%(+1.93)#4,518 |
| 94. | Englewood | 6.1% | 4.3%(+1.82)#94 | 4.3%(+1.89)#4,543 |
| 95. | Granby | 6.1% | 4.3%(+1.79)#95 | 4.3%(+1.87)#4,577 |
| 96. | Poncha Springs | 6.1% | 4.3%(+1.79)#96 | 4.3%(+1.86)#4,579 |
| 97. | Stepping Stone | 6.0% | 4.3%(+1.71)#97 | 4.3%(+1.78)#4,686 |
| 98. | Edwards | 6.0% | 4.3%(+1.69)#98 | 4.3%(+1.77)#4,703 |
| 99. | Federal Heights | 6.0% | 4.3%(+1.69)#99 | 4.3%(+1.76)#4,705 |
| 100. | Ault | 5.9% | 4.3%(+1.58)#100 | 4.3%(+1.65)#4,809 |
Common Questions
What are the Top 10 Cities with the Highest Percentage of Population with a Degree in Visual and Performing Arts in Colorado?
Top 10 Cities with the Highest Percentage of Population with a Degree in Visual and Performing Arts in Colorado are:
#1
81.4%
#2
59.1%
#3
41.5%
#4
41.2%
#5
38.5%
#6
38.1%
#7
30.4%
#8
28.1%
#9
26.1%
#10
25.6%
What city has the Highest Percentage of Population with a Degree in Visual and Performing Arts in Colorado?
Johnson Village has the Highest Percentage of Population with a Degree in Visual and Performing Arts in Colorado with 81.4%.
What is the Percentage of Population with a Degree in Visual and Performing Arts in the State of Colorado?
Percentage of Population with a Degree in Visual and Performing Arts in Colorado is 4.3%.
What is the Percentage of Population with a Degree in Visual and Performing Arts in the United States?
Percentage of Population with a Degree in Visual and Performing Arts in the United States is 4.3%.