Cities with the Highest Percentage of Population with a Degree in Visual and Performing Arts in Michigan
RELATED REPORTS & OPTIONS
Visual and Performing Arts
Michigan
Compare Cities
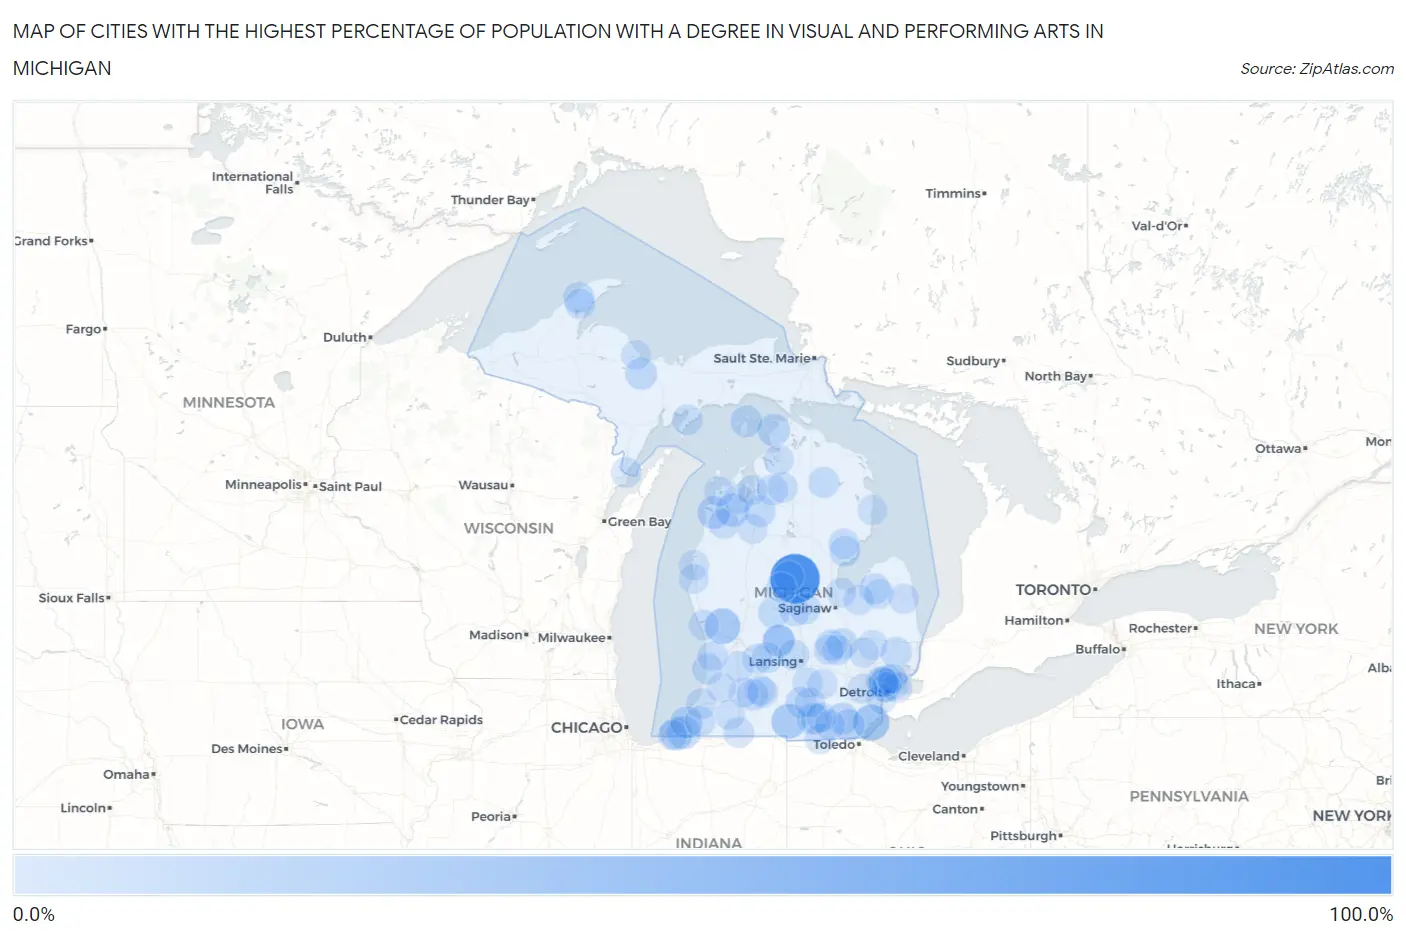
Map of Cities with the Highest Percentage of Population with a Degree in Visual and Performing Arts in Michigan
0.0%
100.0%
Cities with the Highest Percentage of Population with a Degree in Visual and Performing Arts in Michigan
| City | % Graduates | vs State | vs National | |
| 1. | Loomis | 100.0% | 3.4%(+96.6)#1 | 4.3%(+95.7)#16 |
| 2. | Nunica | 100.0% | 3.4%(+96.6)#2 | 4.3%(+95.7)#18 |
| 3. | Greenland | 100.0% | 3.4%(+96.6)#3 | 4.3%(+95.7)#24 |
| 4. | Detroit Beach | 35.2% | 3.4%(+31.8)#4 | 4.3%(+30.9)#226 |
| 5. | Ravenna | 32.3% | 3.4%(+28.9)#5 | 4.3%(+28.0)#279 |
| 6. | Allen | 28.6% | 3.4%(+25.2)#6 | 4.3%(+24.3)#340 |
| 7. | Atlantic Mine | 26.1% | 3.4%(+22.7)#7 | 4.3%(+21.8)#396 |
| 8. | Mears | 21.7% | 3.4%(+18.3)#8 | 4.3%(+17.5)#540 |
| 9. | Interlochen | 21.1% | 3.4%(+17.7)#9 | 4.3%(+16.9)#568 |
| 10. | Three Oaks | 20.2% | 3.4%(+16.8)#10 | 4.3%(+16.0)#615 |
| 11. | New Buffalo | 19.1% | 3.4%(+15.7)#11 | 4.3%(+14.8)#701 |
| 12. | Benzonia | 19.0% | 3.4%(+15.6)#12 | 4.3%(+14.7)#715 |
| 13. | Scotts | 18.5% | 3.4%(+15.1)#13 | 4.3%(+14.3)#744 |
| 14. | Cross Village | 18.2% | 3.4%(+14.8)#14 | 4.3%(+13.9)#772 |
| 15. | Britton | 16.5% | 3.4%(+13.1)#15 | 4.3%(+12.2)#917 |
| 16. | Lyons | 16.2% | 3.4%(+12.8)#16 | 4.3%(+12.0)#936 |
| 17. | Mohawk | 15.9% | 3.4%(+12.5)#17 | 4.3%(+11.7)#961 |
| 18. | Bridgman | 15.8% | 3.4%(+12.4)#18 | 4.3%(+11.6)#966 |
| 19. | Petersburg | 15.6% | 3.4%(+12.2)#19 | 4.3%(+11.4)#991 |
| 20. | Ida | 15.6% | 3.4%(+12.2)#20 | 4.3%(+11.4)#992 |
| 21. | K I Sawyer | 15.1% | 3.4%(+11.7)#21 | 4.3%(+10.8)#1,051 |
| 22. | St James | 15.0% | 3.4%(+11.6)#22 | 4.3%(+10.7)#1,061 |
| 23. | Addison | 13.9% | 3.4%(+10.5)#23 | 4.3%(+9.67)#1,211 |
| 24. | Spring Arbor | 13.5% | 3.4%(+10.1)#24 | 4.3%(+9.22)#1,271 |
| 25. | Mcbride | 13.3% | 3.4%(+9.93)#25 | 4.3%(+9.08)#1,299 |
| 26. | Calumet | 12.8% | 3.4%(+9.38)#26 | 4.3%(+8.53)#1,375 |
| 27. | South Boardman | 12.7% | 3.4%(+9.30)#27 | 4.3%(+8.45)#1,389 |
| 28. | Muir | 12.5% | 3.4%(+9.10)#28 | 4.3%(+8.25)#1,415 |
| 29. | Galesburg | 12.1% | 3.4%(+8.65)#29 | 4.3%(+7.80)#1,513 |
| 30. | Highland Park | 12.0% | 3.4%(+8.61)#30 | 4.3%(+7.76)#1,517 |
| 31. | Armada | 12.0% | 3.4%(+8.58)#31 | 4.3%(+7.73)#1,526 |
| 32. | Hartland | 11.9% | 3.4%(+8.47)#32 | 4.3%(+7.62)#1,548 |
| 33. | Douglas | 11.8% | 3.4%(+8.39)#33 | 4.3%(+7.54)#1,565 |
| 34. | Atlanta | 11.8% | 3.4%(+8.36)#34 | 4.3%(+7.51)#1,574 |
| 35. | Ferndale | 11.7% | 3.4%(+8.31)#35 | 4.3%(+7.46)#1,586 |
| 36. | Breckenridge | 11.5% | 3.4%(+8.14)#36 | 4.3%(+7.29)#1,620 |
| 37. | Lake Odessa | 11.3% | 3.4%(+7.86)#37 | 4.3%(+7.01)#1,662 |
| 38. | Gagetown | 11.1% | 3.4%(+7.71)#38 | 4.3%(+6.86)#1,708 |
| 39. | Turner | 11.1% | 3.4%(+7.71)#39 | 4.3%(+6.86)#1,728 |
| 40. | Swartz Creek | 11.1% | 3.4%(+7.69)#40 | 4.3%(+6.84)#1,730 |
| 41. | Wacousta | 11.1% | 3.4%(+7.66)#41 | 4.3%(+6.81)#1,736 |
| 42. | Vernon | 10.8% | 3.4%(+7.37)#42 | 4.3%(+6.52)#1,810 |
| 43. | Mancelona | 10.3% | 3.4%(+6.85)#43 | 4.3%(+6.00)#1,973 |
| 44. | Manitou Beach Devils Lake | 10.0% | 3.4%(+6.64)#44 | 4.3%(+5.79)#2,041 |
| 45. | Coloma | 9.7% | 3.4%(+6.28)#45 | 4.3%(+5.43)#2,179 |
| 46. | White Pigeon | 9.6% | 3.4%(+6.20)#46 | 4.3%(+5.35)#2,210 |
| 47. | Garden | 9.5% | 3.4%(+6.12)#47 | 4.3%(+5.27)#2,243 |
| 48. | Ruby | 9.3% | 3.4%(+5.92)#48 | 4.3%(+5.07)#2,314 |
| 49. | Berrien Springs | 9.3% | 3.4%(+5.88)#49 | 4.3%(+5.03)#2,331 |
| 50. | Lakes Of The North | 9.2% | 3.4%(+5.76)#50 | 4.3%(+4.91)#2,375 |
| 51. | Level Park Oak Park | 9.1% | 3.4%(+5.69)#51 | 4.3%(+4.84)#2,393 |
| 52. | Springfield | 9.0% | 3.4%(+5.60)#52 | 4.3%(+4.75)#2,449 |
| 53. | Menominee | 9.0% | 3.4%(+5.60)#53 | 4.3%(+4.75)#2,451 |
| 54. | Harper Woods | 9.0% | 3.4%(+5.55)#54 | 4.3%(+4.70)#2,479 |
| 55. | Copemish | 8.9% | 3.4%(+5.53)#55 | 4.3%(+4.68)#2,494 |
| 56. | Clare | 8.9% | 3.4%(+5.51)#56 | 4.3%(+4.66)#2,499 |
| 57. | Hubbell | 8.8% | 3.4%(+5.42)#57 | 4.3%(+4.57)#2,539 |
| 58. | Whittemore | 8.8% | 3.4%(+5.42)#58 | 4.3%(+4.57)#2,542 |
| 59. | Roosevelt Park | 8.8% | 3.4%(+5.41)#59 | 4.3%(+4.56)#2,552 |
| 60. | Morenci | 8.7% | 3.4%(+5.33)#60 | 4.3%(+4.48)#2,583 |
| 61. | Gaines | 8.6% | 3.4%(+5.17)#61 | 4.3%(+4.32)#2,662 |
| 62. | Three Lakes | 8.5% | 3.4%(+5.07)#62 | 4.3%(+4.22)#2,708 |
| 63. | Walloon Lake | 8.5% | 3.4%(+5.06)#63 | 4.3%(+4.21)#2,715 |
| 64. | Alma | 8.4% | 3.4%(+5.04)#64 | 4.3%(+4.19)#2,723 |
| 65. | Pleasant Ridge | 8.4% | 3.4%(+4.97)#65 | 4.3%(+4.12)#2,753 |
| 66. | Freeport | 8.3% | 3.4%(+4.93)#66 | 4.3%(+4.08)#2,775 |
| 67. | Fairgrove | 8.3% | 3.4%(+4.93)#67 | 4.3%(+4.08)#2,779 |
| 68. | Beal City | 8.3% | 3.4%(+4.93)#68 | 4.3%(+4.08)#2,786 |
| 69. | Wayland | 8.2% | 3.4%(+4.84)#69 | 4.3%(+3.99)#2,846 |
| 70. | Beechwood | 8.2% | 3.4%(+4.83)#70 | 4.3%(+3.98)#2,849 |
| 71. | Leslie | 8.2% | 3.4%(+4.79)#71 | 4.3%(+3.94)#2,874 |
| 72. | Deckerville | 8.2% | 3.4%(+4.76)#72 | 4.3%(+3.91)#2,884 |
| 73. | Grosse Pointe Farms | 8.1% | 3.4%(+4.70)#73 | 4.3%(+3.85)#2,916 |
| 74. | Bancroft | 7.9% | 3.4%(+4.49)#74 | 4.3%(+3.64)#3,031 |
| 75. | Vandercook Lake | 7.9% | 3.4%(+4.47)#75 | 4.3%(+3.62)#3,043 |
| 76. | Center Line | 7.8% | 3.4%(+4.42)#76 | 4.3%(+3.57)#3,072 |
| 77. | Adrian | 7.7% | 3.4%(+4.33)#77 | 4.3%(+3.48)#3,128 |
| 78. | Ludington | 7.6% | 3.4%(+4.17)#78 | 4.3%(+3.32)#3,246 |
| 79. | Marcellus | 7.6% | 3.4%(+4.16)#79 | 4.3%(+3.31)#3,255 |
| 80. | Onsted | 7.5% | 3.4%(+4.11)#80 | 4.3%(+3.26)#3,287 |
| 81. | Trowbridge Park | 7.5% | 3.4%(+4.07)#81 | 4.3%(+3.22)#3,304 |
| 82. | Stockbridge | 7.3% | 3.4%(+3.93)#82 | 4.3%(+3.08)#3,415 |
| 83. | Ecorse | 7.3% | 3.4%(+3.93)#83 | 4.3%(+3.08)#3,419 |
| 84. | Metamora | 7.3% | 3.4%(+3.92)#84 | 4.3%(+3.06)#3,431 |
| 85. | Ortonville | 7.3% | 3.4%(+3.89)#85 | 4.3%(+3.04)#3,457 |
| 86. | Elk Rapids | 7.2% | 3.4%(+3.85)#86 | 4.3%(+3.00)#3,489 |
| 87. | Hamtramck | 7.2% | 3.4%(+3.76)#87 | 4.3%(+2.91)#3,549 |
| 88. | Hazel Park | 7.1% | 3.4%(+3.74)#88 | 4.3%(+2.89)#3,608 |
| 89. | Cass City | 7.1% | 3.4%(+3.72)#89 | 4.3%(+2.87)#3,614 |
| 90. | Parchment | 7.1% | 3.4%(+3.68)#90 | 4.3%(+2.83)#3,638 |
| 91. | Greilickville | 7.1% | 3.4%(+3.67)#91 | 4.3%(+2.82)#3,650 |
| 92. | Roseville | 7.0% | 3.4%(+3.60)#92 | 4.3%(+2.75)#3,707 |
| 93. | Manton | 7.0% | 3.4%(+3.57)#93 | 4.3%(+2.72)#3,723 |
| 94. | Bloomingdale | 7.0% | 3.4%(+3.57)#94 | 4.3%(+2.72)#3,728 |
| 95. | Harrisville | 6.9% | 3.4%(+3.53)#95 | 4.3%(+2.68)#3,762 |
| 96. | Pentwater | 6.9% | 3.4%(+3.49)#96 | 4.3%(+2.64)#3,783 |
| 97. | Michiana | 6.9% | 3.4%(+3.49)#97 | 4.3%(+2.64)#3,789 |
| 98. | Essexville | 6.9% | 3.4%(+3.48)#98 | 4.3%(+2.63)#3,805 |
| 99. | Glen Arbor | 6.9% | 3.4%(+3.48)#99 | 4.3%(+2.63)#3,809 |
| 100. | Plymouth | 6.9% | 3.4%(+3.47)#100 | 4.3%(+2.62)#3,818 |
Common Questions
What are the Top 10 Cities with the Highest Percentage of Population with a Degree in Visual and Performing Arts in Michigan?
Top 10 Cities with the Highest Percentage of Population with a Degree in Visual and Performing Arts in Michigan are:
#1
100.0%
#2
35.2%
#3
32.3%
#4
28.6%
#5
21.1%
#6
20.2%
#7
19.1%
#8
19.0%
#9
18.2%
#10
16.5%
What city has the Highest Percentage of Population with a Degree in Visual and Performing Arts in Michigan?
Loomis has the Highest Percentage of Population with a Degree in Visual and Performing Arts in Michigan with 100.0%.
What is the Percentage of Population with a Degree in Visual and Performing Arts in the State of Michigan?
Percentage of Population with a Degree in Visual and Performing Arts in Michigan is 3.4%.
What is the Percentage of Population with a Degree in Visual and Performing Arts in the United States?
Percentage of Population with a Degree in Visual and Performing Arts in the United States is 4.3%.