Stinson Beach, CA Map & Demographics
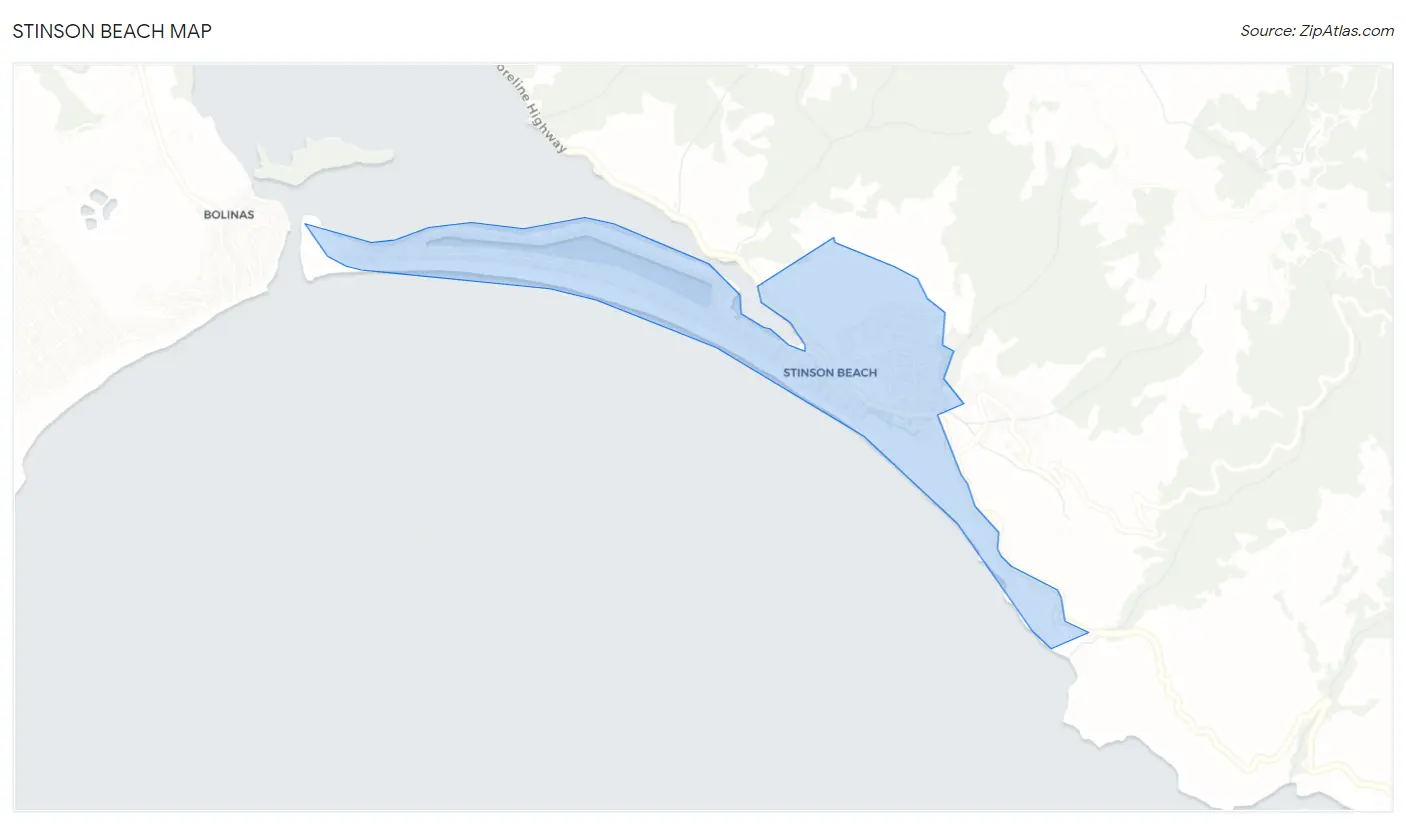
Stinson Beach Map
Stinson Beach Overview
$62,004
PER CAPITA INCOME
$74,286
AVG FAMILY INCOME
$74,405
AVG HOUSEHOLD INCOME
0.47
INEQUALITY / GINI INDEX
371
TOTAL POPULATION
226
MALE POPULATION
145
FEMALE POPULATION
155.86
MALES / 100 FEMALES
64.16
FEMALES / 100 MALES
63.8
MEDIAN AGE
2.2
AVG FAMILY SIZE
1.7
AVG HOUSEHOLD SIZE
208
LABOR FORCE [ PEOPLE ]
57.1%
PERCENT IN LABOR FORCE
Stinson Beach Zip Codes
Stinson Beach Area Codes
Income in Stinson Beach
Income Overview in Stinson Beach
Per Capita Income in Stinson Beach is $62,004, while median incomes of families and households are $74,286 and $74,405 respectively.
| Characteristic | Number | Measure |
| Per Capita Income | 371 | $62,004 |
| Median Family Income | 72 | $74,286 |
| Mean Family Income | 72 | $101,942 |
| Median Household Income | 224 | $74,405 |
| Mean Household Income | 224 | $101,575 |
| Income Deficit | 72 | $0 |
| Wage / Income Gap (%) | 371 | 0.00% |
| Wage / Income Gap ($) | 371 | 100.00¢ per $1 |
| Gini / Inequality Index | 371 | 0.47 |
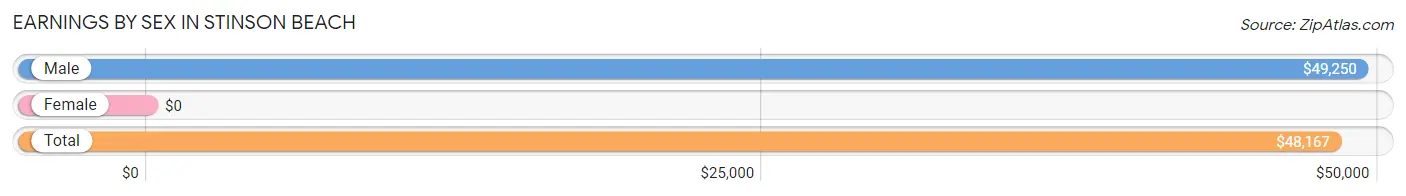
Earnings by Sex in Stinson Beach
| Sex | Number | Average Earnings |
| Male | 159 (76.4%) | $49,250 |
| Female | 49 (23.6%) | $0 |
| Total | 208 (100.0%) | $48,167 |
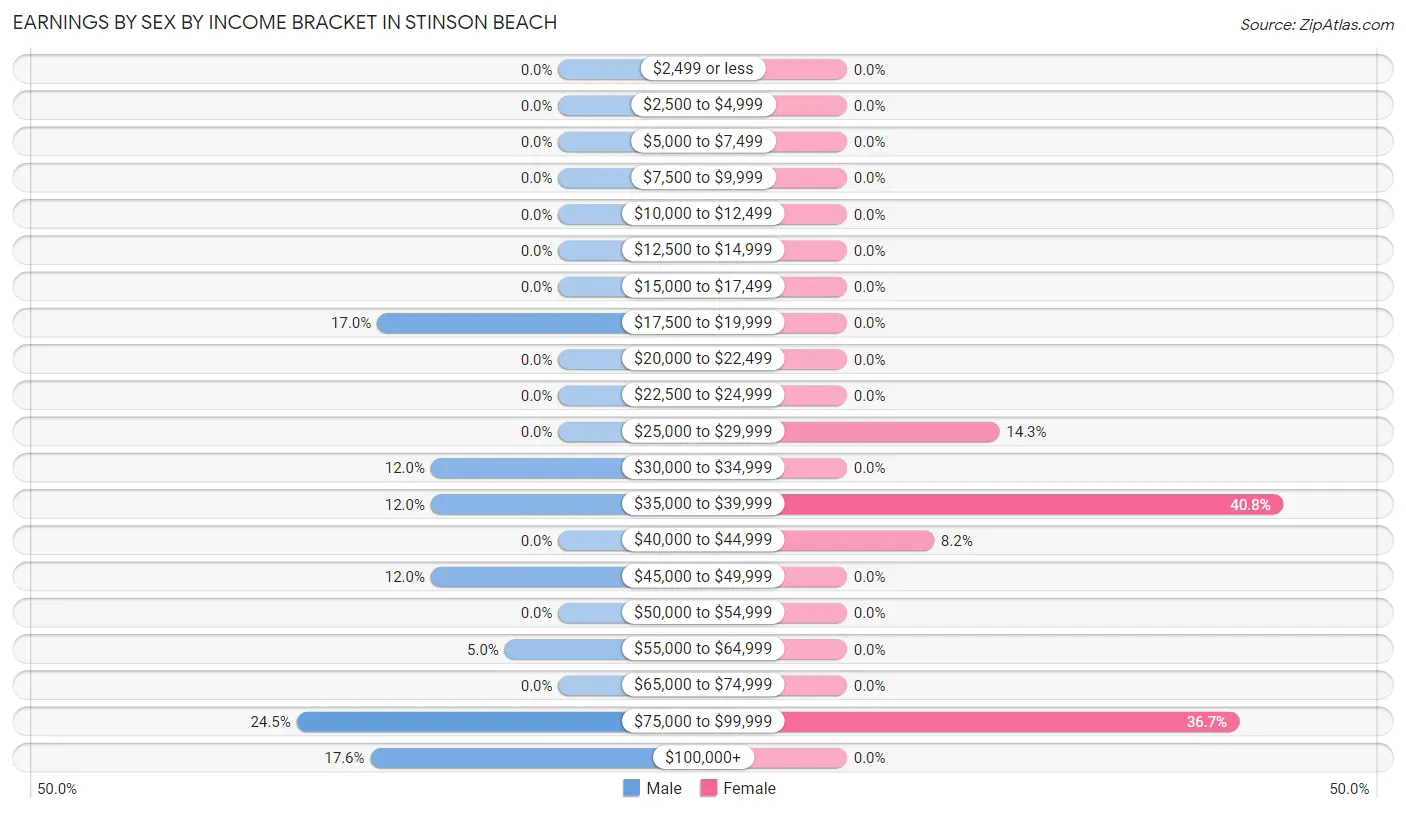
Earnings by Sex by Income Bracket in Stinson Beach
The most common earnings brackets in Stinson Beach are $75,000 to $99,999 for men (39 | 24.5%) and $35,000 to $39,999 for women (20 | 40.8%).
| Income | Male | Female |
| $2,499 or less | 0 (0.0%) | 0 (0.0%) |
| $2,500 to $4,999 | 0 (0.0%) | 0 (0.0%) |
| $5,000 to $7,499 | 0 (0.0%) | 0 (0.0%) |
| $7,500 to $9,999 | 0 (0.0%) | 0 (0.0%) |
| $10,000 to $12,499 | 0 (0.0%) | 0 (0.0%) |
| $12,500 to $14,999 | 0 (0.0%) | 0 (0.0%) |
| $15,000 to $17,499 | 0 (0.0%) | 0 (0.0%) |
| $17,500 to $19,999 | 27 (17.0%) | 0 (0.0%) |
| $20,000 to $22,499 | 0 (0.0%) | 0 (0.0%) |
| $22,500 to $24,999 | 0 (0.0%) | 0 (0.0%) |
| $25,000 to $29,999 | 0 (0.0%) | 7 (14.3%) |
| $30,000 to $34,999 | 19 (11.9%) | 0 (0.0%) |
| $35,000 to $39,999 | 19 (11.9%) | 20 (40.8%) |
| $40,000 to $44,999 | 0 (0.0%) | 4 (8.2%) |
| $45,000 to $49,999 | 19 (11.9%) | 0 (0.0%) |
| $50,000 to $54,999 | 0 (0.0%) | 0 (0.0%) |
| $55,000 to $64,999 | 8 (5.0%) | 0 (0.0%) |
| $65,000 to $74,999 | 0 (0.0%) | 0 (0.0%) |
| $75,000 to $99,999 | 39 (24.5%) | 18 (36.7%) |
| $100,000+ | 28 (17.6%) | 0 (0.0%) |
| Total | 159 (100.0%) | 49 (100.0%) |
Earnings by Sex by Educational Attainment in Stinson Beach
| Educational Attainment | Male Income | Female Income |
| Less than High School | - | - |
| High School Diploma | - | - |
| College or Associate's Degree | - | - |
| Bachelor's Degree | - | - |
| Graduate Degree | - | - |
| Total | $49,250 | $0 |
Family Income in Stinson Beach
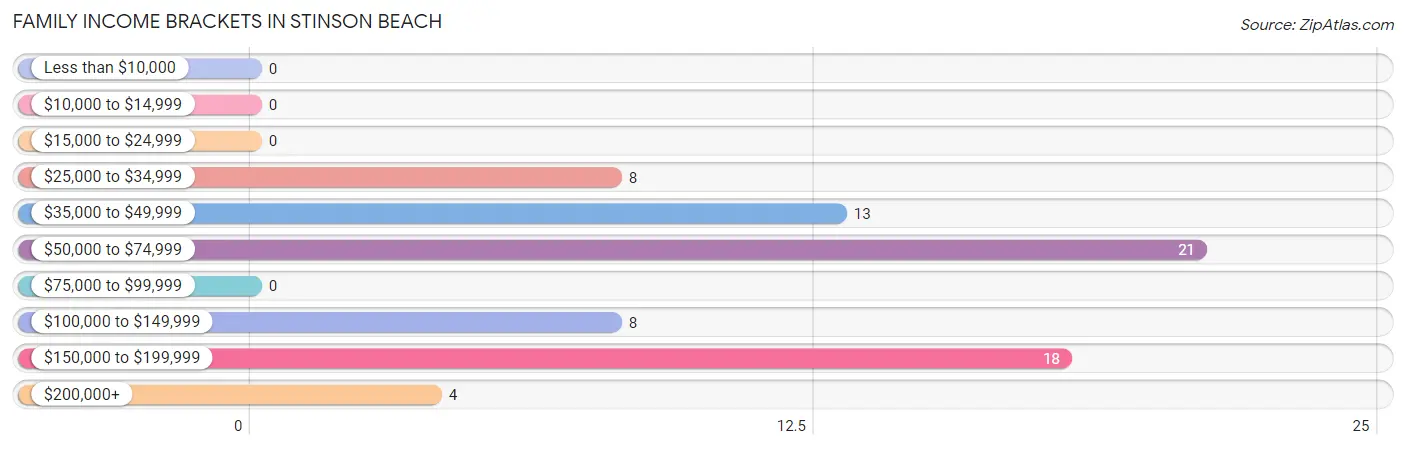
Family Income Brackets in Stinson Beach
According to the Stinson Beach family income data, there are 21 families falling into the $50,000 to $74,999 income range, which is the most common income bracket and makes up 29.2% of all families.
| Income Bracket | # Families | % Families |
| Less than $10,000 | 0 | 0.0% |
| $10,000 to $14,999 | 0 | 0.0% |
| $15,000 to $24,999 | 0 | 0.0% |
| $25,000 to $34,999 | 8 | 11.1% |
| $35,000 to $49,999 | 13 | 18.1% |
| $50,000 to $74,999 | 21 | 29.2% |
| $75,000 to $99,999 | 0 | 0.0% |
| $100,000 to $149,999 | 8 | 11.1% |
| $150,000 to $199,999 | 18 | 25.0% |
| $200,000+ | 4 | 5.6% |
Family Income by Famaliy Size in Stinson Beach

| Income Bracket | # Families | Median Income |
| 2-Person Families | 64 (88.9%) | $0 |
| 3-Person Families | 0 (0.0%) | $0 |
| 4-Person Families | 8 (11.1%) | $0 |
| 5-Person Families | 0 (0.0%) | $0 |
| 6-Person Families | 0 (0.0%) | $0 |
| 7+ Person Families | 0 (0.0%) | $0 |
| Total | 72 (100.0%) | $74,286 |
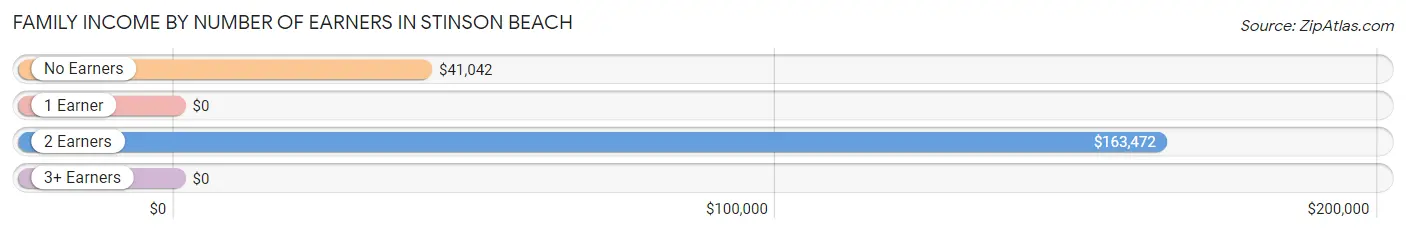
Family Income by Number of Earners in Stinson Beach
| Number of Earners | # Families | Median Income |
| No Earners | 21 (29.2%) | $41,042 |
| 1 Earner | 21 (29.2%) | $0 |
| 2 Earners | 30 (41.7%) | $163,472 |
| 3+ Earners | 0 (0.0%) | $0 |
| Total | 72 (100.0%) | $74,286 |
Household Income in Stinson Beach
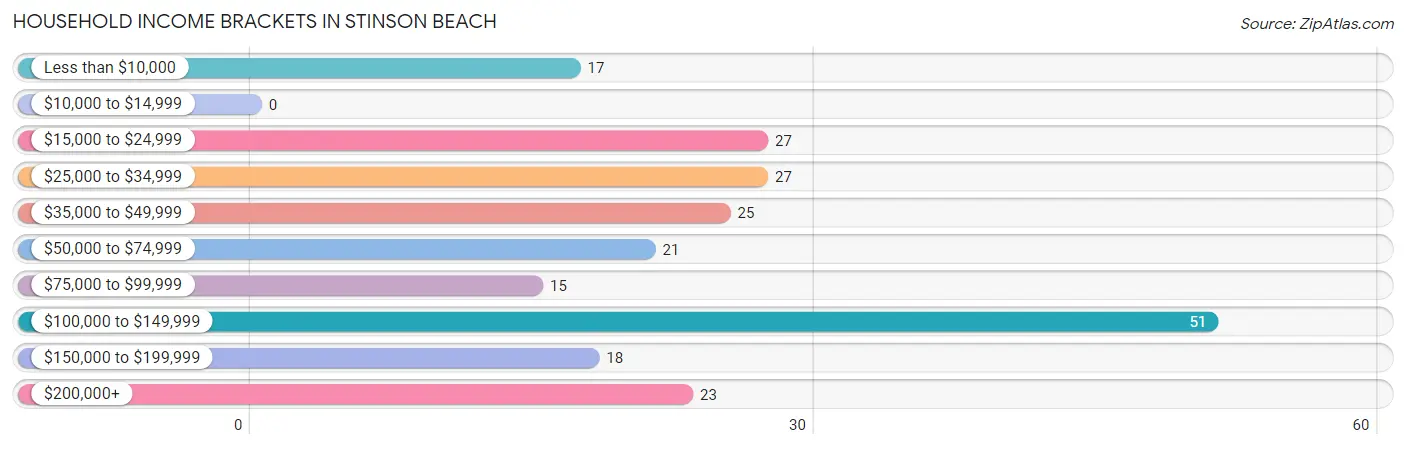
Household Income Brackets in Stinson Beach
With 51 households falling in the category, the $100,000 to $149,999 income range is the most frequent in Stinson Beach, accounting for 22.8% of all households.
| Income Bracket | # Households | % Households |
| Less than $10,000 | 17 | 7.6% |
| $10,000 to $14,999 | 0 | 0.0% |
| $15,000 to $24,999 | 27 | 12.1% |
| $25,000 to $34,999 | 27 | 12.1% |
| $35,000 to $49,999 | 25 | 11.2% |
| $50,000 to $74,999 | 21 | 9.4% |
| $75,000 to $99,999 | 15 | 6.7% |
| $100,000 to $149,999 | 51 | 22.8% |
| $150,000 to $199,999 | 18 | 8.0% |
| $200,000+ | 23 | 10.3% |
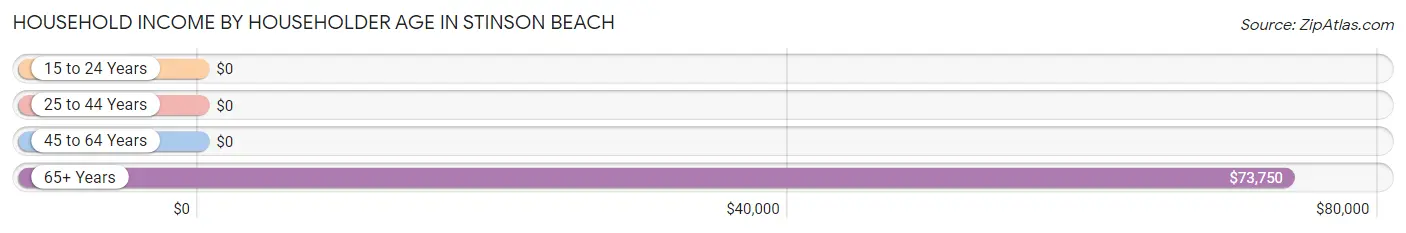
Household Income by Householder Age in Stinson Beach
The median household income in Stinson Beach is $74,405, with the highest median household income of $73,750 found in the 65+ years age bracket for the primary householder. A total of 105 households (46.9%) fall into this category.
| Income Bracket | # Households | Median Income |
| 15 to 24 Years | 0 (0.0%) | $0 |
| 25 to 44 Years | 0 (0.0%) | $0 |
| 45 to 64 Years | 119 (53.1%) | $0 |
| 65+ Years | 105 (46.9%) | $73,750 |
| Total | 224 (100.0%) | $74,405 |
Poverty in Stinson Beach
Income Below Poverty by Sex and Age in Stinson Beach
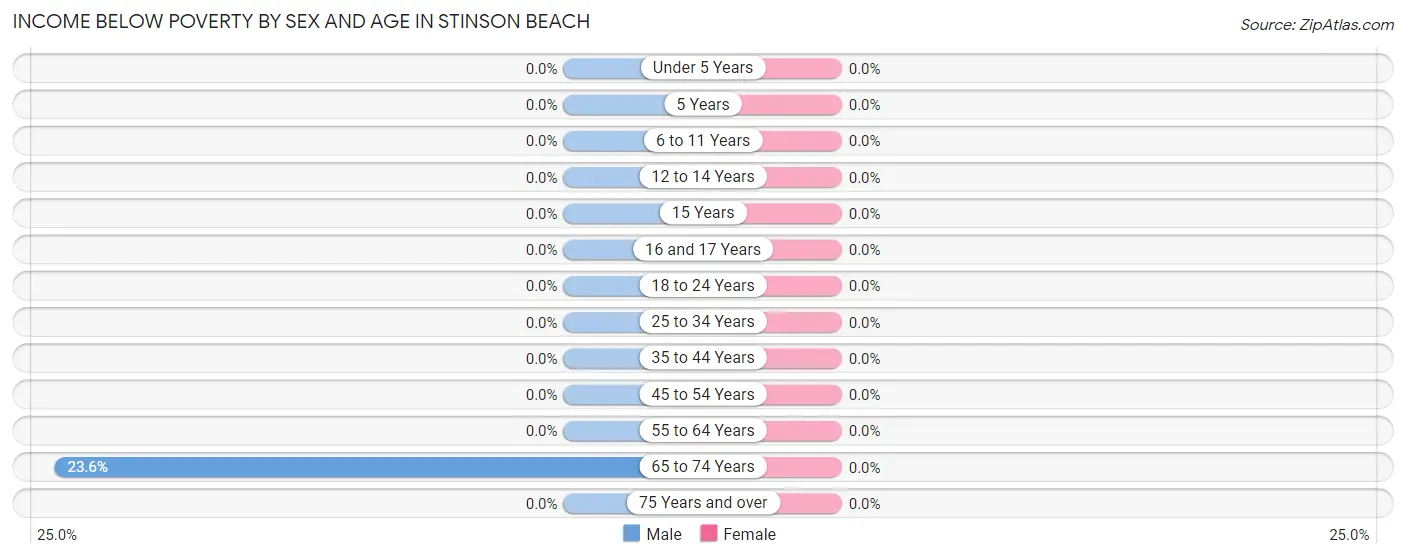
| Age Bracket | Male | Female |
| Under 5 Years | 0 (0.0%) | 0 (0.0%) |
| 5 Years | 0 (0.0%) | 0 (0.0%) |
| 6 to 11 Years | 0 (0.0%) | 0 (0.0%) |
| 12 to 14 Years | 0 (0.0%) | 0 (0.0%) |
| 15 Years | 0 (0.0%) | 0 (0.0%) |
| 16 and 17 Years | 0 (0.0%) | 0 (0.0%) |
| 18 to 24 Years | 0 (0.0%) | 0 (0.0%) |
| 25 to 34 Years | 0 (0.0%) | 0 (0.0%) |
| 35 to 44 Years | 0 (0.0%) | 0 (0.0%) |
| 45 to 54 Years | 0 (0.0%) | 0 (0.0%) |
| 55 to 64 Years | 0 (0.0%) | 0 (0.0%) |
| 65 to 74 Years | 17 (23.6%) | 0 (0.0%) |
| 75 Years and over | 0 (0.0%) | 0 (0.0%) |
| Total | 17 (7.5%) | 0 (0.0%) |
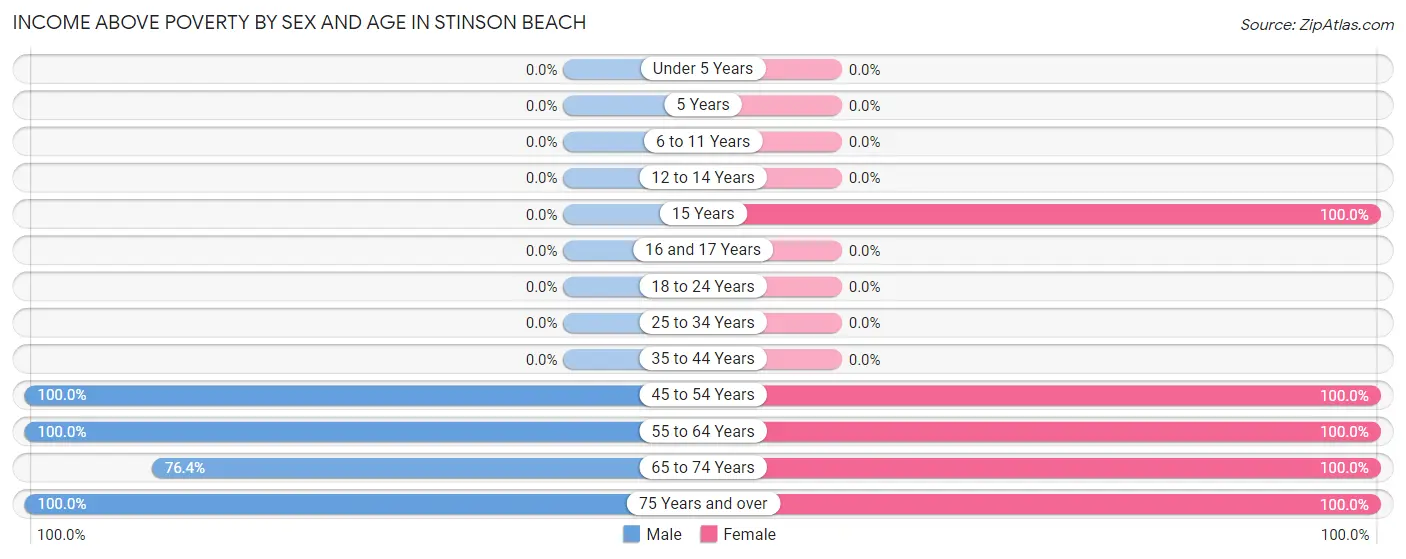
Income Above Poverty by Sex and Age in Stinson Beach
According to the poverty statistics in Stinson Beach, males aged 45 to 54 years and females aged 15 years are the age groups that are most secure financially, with 100.0% of males and 100.0% of females in these age groups living above the poverty line.
| Age Bracket | Male | Female |
| Under 5 Years | 0 (0.0%) | 0 (0.0%) |
| 5 Years | 0 (0.0%) | 0 (0.0%) |
| 6 to 11 Years | 0 (0.0%) | 0 (0.0%) |
| 12 to 14 Years | 0 (0.0%) | 0 (0.0%) |
| 15 Years | 0 (0.0%) | 7 (100.0%) |
| 16 and 17 Years | 0 (0.0%) | 0 (0.0%) |
| 18 to 24 Years | 0 (0.0%) | 0 (0.0%) |
| 25 to 34 Years | 0 (0.0%) | 0 (0.0%) |
| 35 to 44 Years | 0 (0.0%) | 0 (0.0%) |
| 45 to 54 Years | 85 (100.0%) | 38 (100.0%) |
| 55 to 64 Years | 52 (100.0%) | 7 (100.0%) |
| 65 to 74 Years | 55 (76.4%) | 11 (100.0%) |
| 75 Years and over | 17 (100.0%) | 82 (100.0%) |
| Total | 209 (92.5%) | 145 (100.0%) |
Income Below Poverty Among Married-Couple Families in Stinson Beach
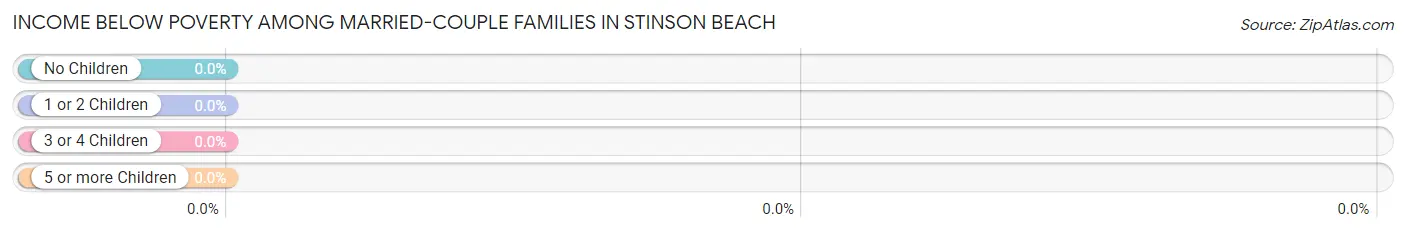
| Children | Above Poverty | Below Poverty |
| No Children | 64 (100.0%) | 0 (0.0%) |
| 1 or 2 Children | 8 (100.0%) | 0 (0.0%) |
| 3 or 4 Children | 0 (0.0%) | 0 (0.0%) |
| 5 or more Children | 0 (0.0%) | 0 (0.0%) |
| Total | 72 (100.0%) | 0 (0.0%) |
Income Below Poverty Among Single-Parent Households in Stinson Beach
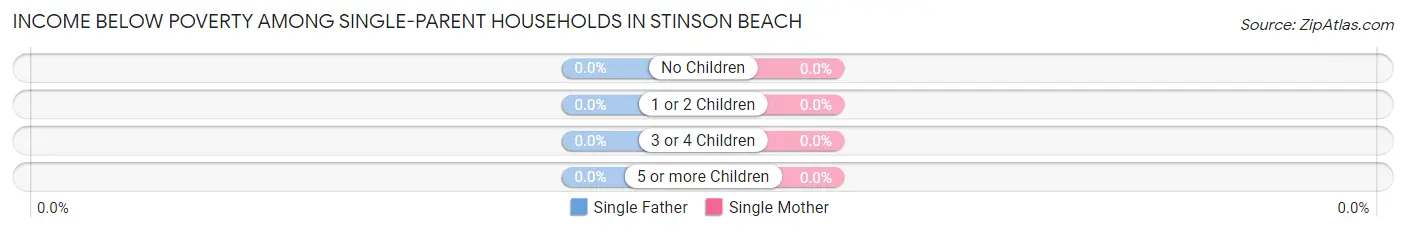
| Children | Single Father | Single Mother |
| No Children | 0 (0.0%) | 0 (0.0%) |
| 1 or 2 Children | 0 (0.0%) | 0 (0.0%) |
| 3 or 4 Children | 0 (0.0%) | 0 (0.0%) |
| 5 or more Children | 0 (0.0%) | 0 (0.0%) |
| Total | 0 (0.0%) | 0 (0.0%) |
Income Below Poverty Among Married-Couple vs Single-Parent Households in Stinson Beach
| Children | Married-Couple Families | Single-Parent Households |
| No Children | 0 (0.0%) | 0 (0.0%) |
| 1 or 2 Children | 0 (0.0%) | 0 (0.0%) |
| 3 or 4 Children | 0 (0.0%) | 0 (0.0%) |
| 5 or more Children | 0 (0.0%) | 0 (0.0%) |
| Total | 0 (0.0%) | 0 (0.0%) |
Race in Stinson Beach
The most populous races in Stinson Beach are White / Caucasian (352 | 94.9%), Hispanic or Latino (46 | 12.4%), and Two or more Races (19 | 5.1%).

| Race | # Population | % Population |
| Asian | 0 | 0.0% |
| Black / African American | 0 | 0.0% |
| Hawaiian / Pacific | 0 | 0.0% |
| Hispanic or Latino | 46 | 12.4% |
| Native / Alaskan | 0 | 0.0% |
| White / Caucasian | 352 | 94.9% |
| Two or more Races | 19 | 5.1% |
| Some other Race | 0 | 0.0% |
| Total | 371 | 100.0% |
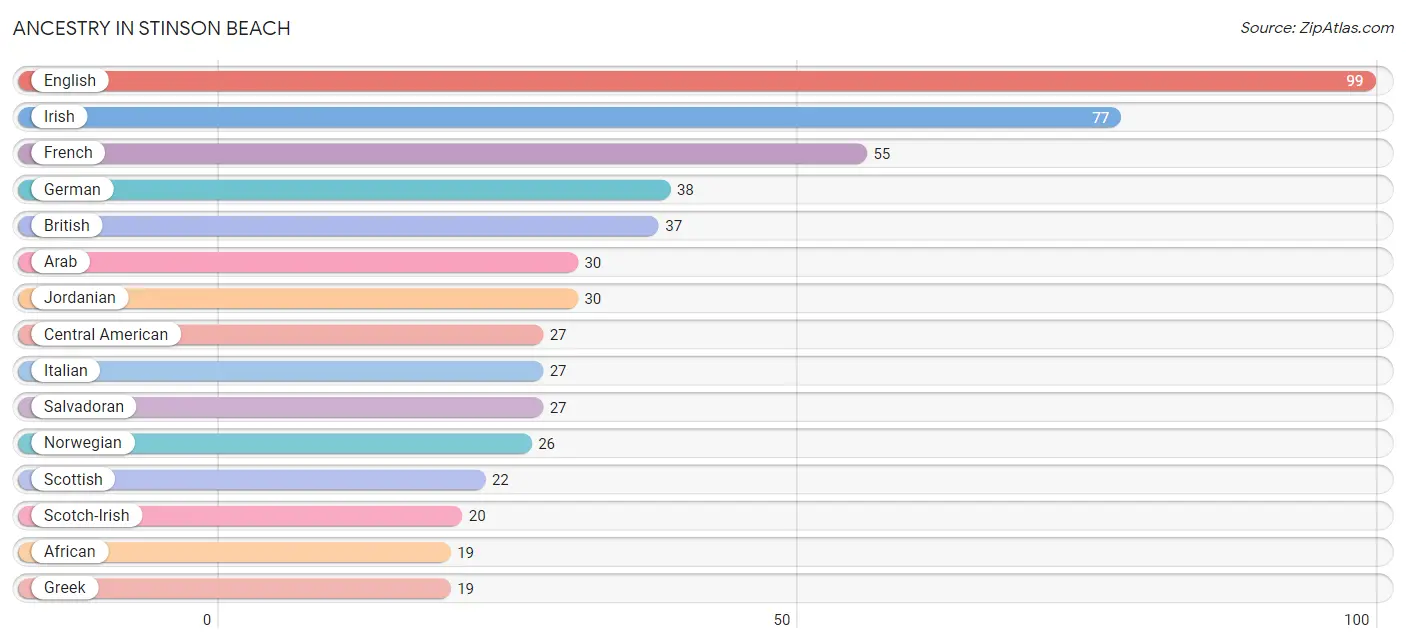
Ancestry in Stinson Beach
The most populous ancestries reported in Stinson Beach are English (99 | 26.7%), Irish (77 | 20.7%), French (55 | 14.8%), German (38 | 10.2%), and British (37 | 10.0%), together accounting for 82.5% of all Stinson Beach residents.
| Ancestry | # Population | % Population |
| African | 19 | 5.1% |
| Arab | 30 | 8.1% |
| British | 37 | 10.0% |
| Central American | 27 | 7.3% |
| English | 99 | 26.7% |
| French | 55 | 14.8% |
| German | 38 | 10.2% |
| Greek | 19 | 5.1% |
| Irish | 77 | 20.7% |
| Italian | 27 | 7.3% |
| Jordanian | 30 | 8.1% |
| Mexican American Indian | 19 | 5.1% |
| Norwegian | 26 | 7.0% |
| Polish | 6 | 1.6% |
| Russian | 15 | 4.0% |
| Salvadoran | 27 | 7.3% |
| Scotch-Irish | 20 | 5.4% |
| Scottish | 22 | 5.9% |
| Spaniard | 19 | 5.1% |
| Subsaharan African | 19 | 5.1% |
| Swedish | 7 | 1.9% | View All 21 Rows |
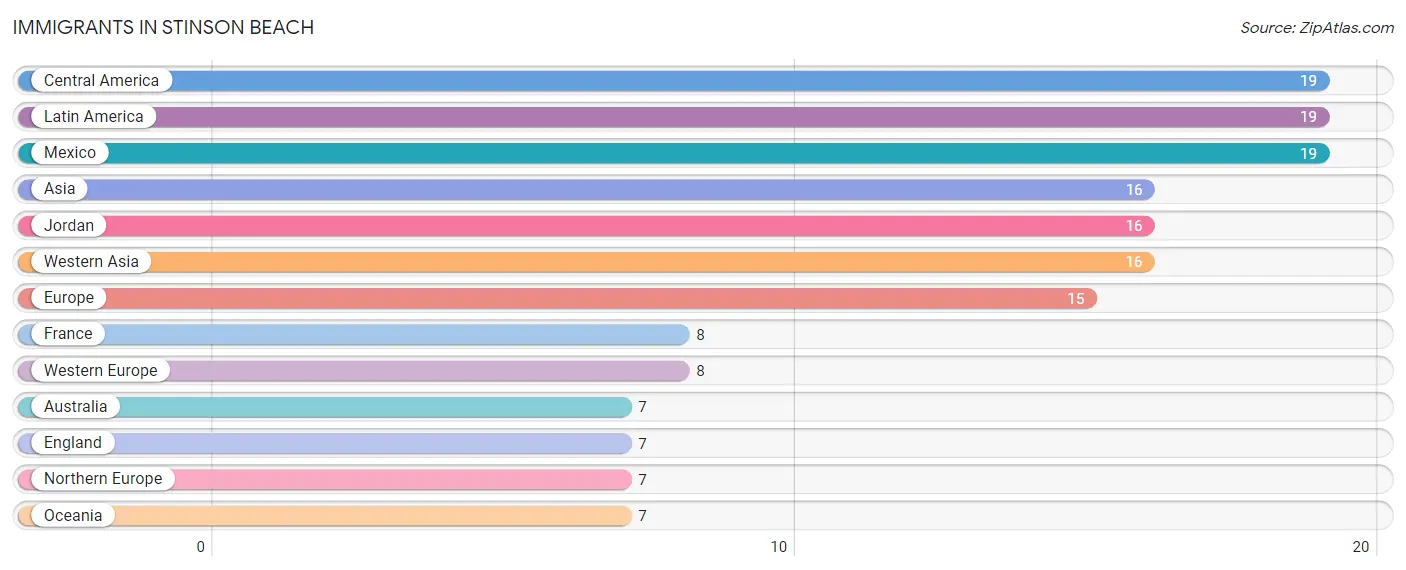
Immigrants in Stinson Beach
The most numerous immigrant groups reported in Stinson Beach came from Central America (19 | 5.1%), Latin America (19 | 5.1%), Mexico (19 | 5.1%), Asia (16 | 4.3%), and Jordan (16 | 4.3%), together accounting for 24.0% of all Stinson Beach residents.
| Immigration Origin | # Population | % Population |
| Asia | 16 | 4.3% |
| Australia | 7 | 1.9% |
| Central America | 19 | 5.1% |
| England | 7 | 1.9% |
| Europe | 15 | 4.0% |
| France | 8 | 2.2% |
| Jordan | 16 | 4.3% |
| Latin America | 19 | 5.1% |
| Mexico | 19 | 5.1% |
| Northern Europe | 7 | 1.9% |
| Oceania | 7 | 1.9% |
| Western Asia | 16 | 4.3% |
| Western Europe | 8 | 2.2% | View All 13 Rows |
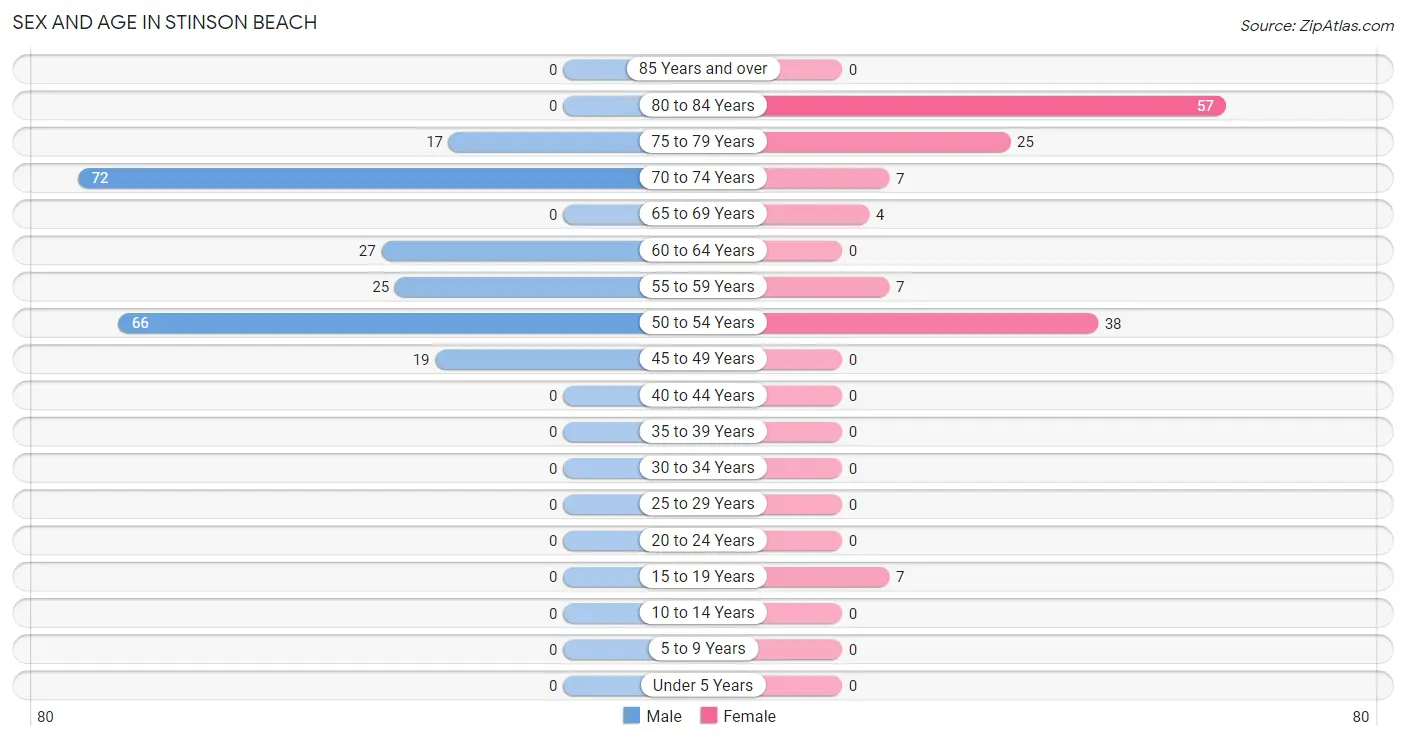
Sex and Age in Stinson Beach
Sex and Age in Stinson Beach
The most populous age groups in Stinson Beach are 70 to 74 Years (72 | 31.9%) for men and 80 to 84 Years (57 | 39.3%) for women.
| Age Bracket | Male | Female |
| Under 5 Years | 0 (0.0%) | 0 (0.0%) |
| 5 to 9 Years | 0 (0.0%) | 0 (0.0%) |
| 10 to 14 Years | 0 (0.0%) | 0 (0.0%) |
| 15 to 19 Years | 0 (0.0%) | 7 (4.8%) |
| 20 to 24 Years | 0 (0.0%) | 0 (0.0%) |
| 25 to 29 Years | 0 (0.0%) | 0 (0.0%) |
| 30 to 34 Years | 0 (0.0%) | 0 (0.0%) |
| 35 to 39 Years | 0 (0.0%) | 0 (0.0%) |
| 40 to 44 Years | 0 (0.0%) | 0 (0.0%) |
| 45 to 49 Years | 19 (8.4%) | 0 (0.0%) |
| 50 to 54 Years | 66 (29.2%) | 38 (26.2%) |
| 55 to 59 Years | 25 (11.1%) | 7 (4.8%) |
| 60 to 64 Years | 27 (11.9%) | 0 (0.0%) |
| 65 to 69 Years | 0 (0.0%) | 4 (2.8%) |
| 70 to 74 Years | 72 (31.9%) | 7 (4.8%) |
| 75 to 79 Years | 17 (7.5%) | 25 (17.2%) |
| 80 to 84 Years | 0 (0.0%) | 57 (39.3%) |
| 85 Years and over | 0 (0.0%) | 0 (0.0%) |
| Total | 226 (100.0%) | 145 (100.0%) |
Families and Households in Stinson Beach
Median Family Size in Stinson Beach
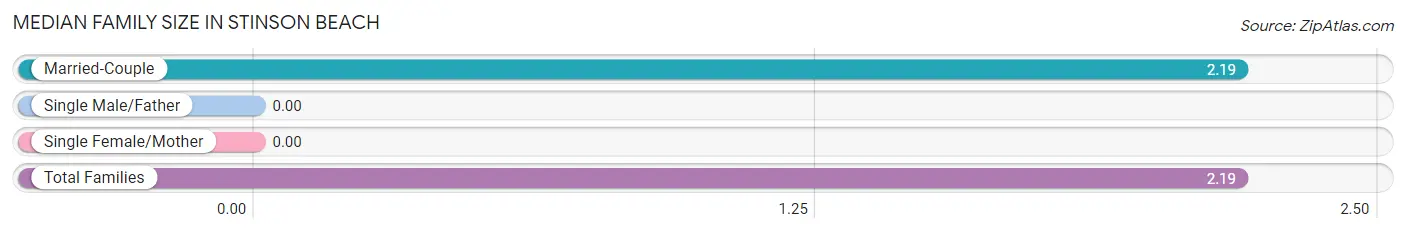
| Family Type | # Families | Family Size |
| Married-Couple | 72 (100.0%) | 2.19 |
| Single Male/Father | 0 (0.0%) | - |
| Single Female/Mother | 0 (0.0%) | - |
| Total Families | 72 (100.0%) | 2.19 |
Median Household Size in Stinson Beach
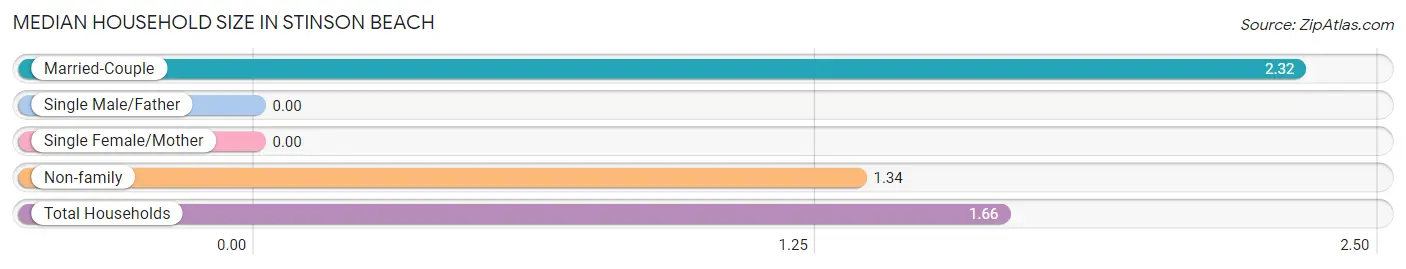
| Household Type | # Households | Household Size |
| Married-Couple | 72 (32.1%) | 2.32 |
| Single Male/Father | 0 (0.0%) | - |
| Single Female/Mother | 0 (0.0%) | - |
| Non-family | 152 (67.9%) | 1.34 |
| Total Households | 224 (100.0%) | 1.66 |
Household Size by Marriage Status in Stinson Beach
Out of a total of 224 households in Stinson Beach, 72 (32.1%) are family households, while 152 (67.9%) are nonfamily households. The most numerous type of family households are 2-person households, comprising 58, and the most common type of nonfamily households are 1-person households, comprising 100.
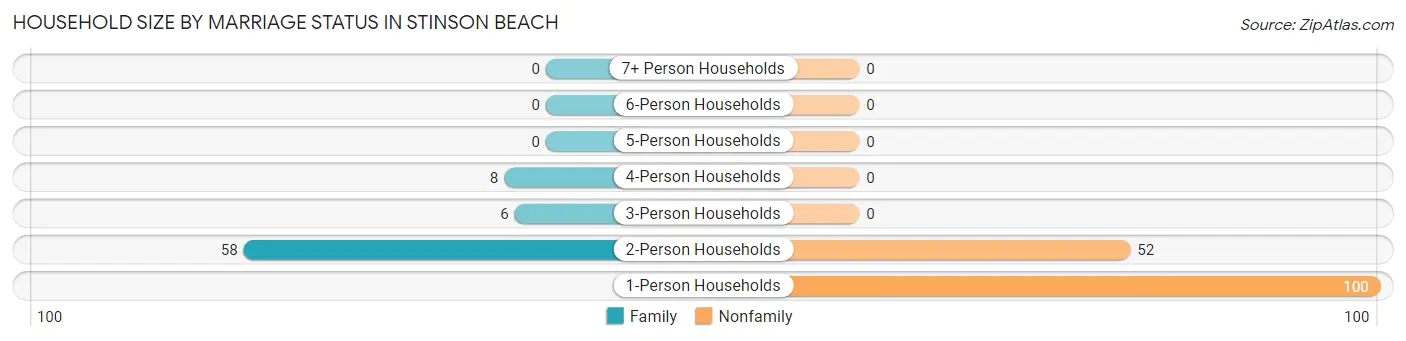
| Household Size | Family Households | Nonfamily Households |
| 1-Person Households | - | 100 (44.6%) |
| 2-Person Households | 58 (25.9%) | 52 (23.2%) |
| 3-Person Households | 6 (2.7%) | 0 (0.0%) |
| 4-Person Households | 8 (3.6%) | 0 (0.0%) |
| 5-Person Households | 0 (0.0%) | 0 (0.0%) |
| 6-Person Households | 0 (0.0%) | 0 (0.0%) |
| 7+ Person Households | 0 (0.0%) | 0 (0.0%) |
| Total | 72 (32.1%) | 152 (67.9%) |
Female Fertility in Stinson Beach
Fertility by Age in Stinson Beach
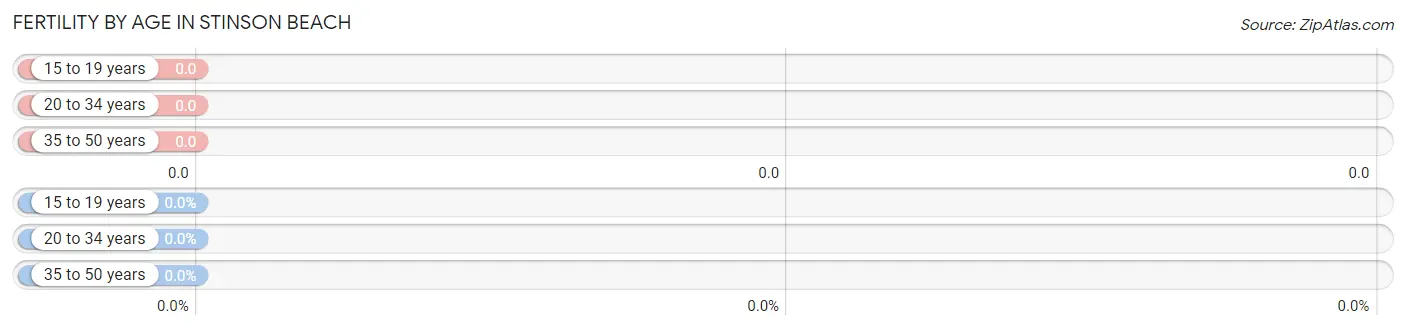
| Age Bracket | Women with Births | Births / 1,000 Women |
| 15 to 19 years | 0 (0.0%) | 0.0 |
| 20 to 34 years | 0 (0.0%) | 0.0 |
| 35 to 50 years | 0 (0.0%) | 0.0 |
| Total | 0 (0.0%) | 0.0 |
Fertility by Age by Marriage Status in Stinson Beach
| Age Bracket | Married | Unmarried |
| 15 to 19 years | 0 (0.0%) | 0 (0.0%) |
| 20 to 34 years | 0 (0.0%) | 0 (0.0%) |
| 35 to 50 years | 0 (0.0%) | 0 (0.0%) |
| Total | 0 (0.0%) | 0 (0.0%) |
Fertility by Education in Stinson Beach
| Educational Attainment | Women with Births | Births / 1,000 Women |
| Less than High School | 0 (0.0%) | 0.0 |
| High School Diploma | 0 (0.0%) | 0.0 |
| College or Associate's Degree | 0 (0.0%) | 0.0 |
| Bachelor's Degree | 0 (0.0%) | 0.0 |
| Graduate Degree | 0 (0.0%) | 0.0 |
| Total | 0 (0.0%) | 0.0 |
Fertility by Education by Marriage Status in Stinson Beach
| Educational Attainment | Married | Unmarried |
| Less than High School | 0 (0.0%) | 0 (0.0%) |
| High School Diploma | 0 (0.0%) | 0 (0.0%) |
| College or Associate's Degree | 0 (0.0%) | 0 (0.0%) |
| Bachelor's Degree | 0 (0.0%) | 0 (0.0%) |
| Graduate Degree | 0 (0.0%) | 0 (0.0%) |
| Total | 0 (0.0%) | 0 (0.0%) |
Employment Characteristics in Stinson Beach
Employment by Class of Employer in Stinson Beach
Among the 208 employed individuals in Stinson Beach, private company employees (107 | 51.4%), self-employed (not incorporated) (46 | 22.1%), and self-employed (incorporated) (19 | 9.1%) make up the most common classes of employment.
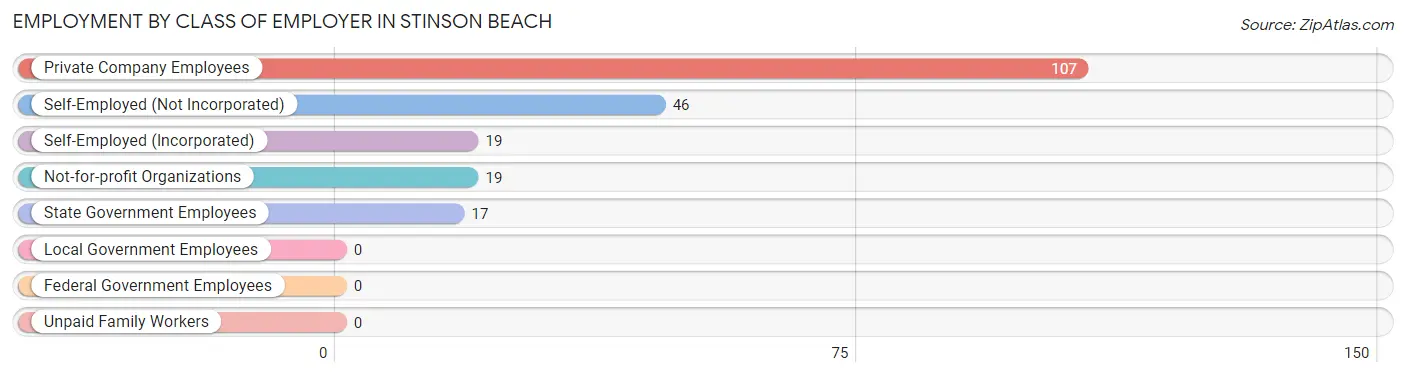
| Employer Class | # Employees | % Employees |
| Private Company Employees | 107 | 51.4% |
| Self-Employed (Incorporated) | 19 | 9.1% |
| Self-Employed (Not Incorporated) | 46 | 22.1% |
| Not-for-profit Organizations | 19 | 9.1% |
| Local Government Employees | 0 | 0.0% |
| State Government Employees | 17 | 8.2% |
| Federal Government Employees | 0 | 0.0% |
| Unpaid Family Workers | 0 | 0.0% |
| Total | 208 | 100.0% |
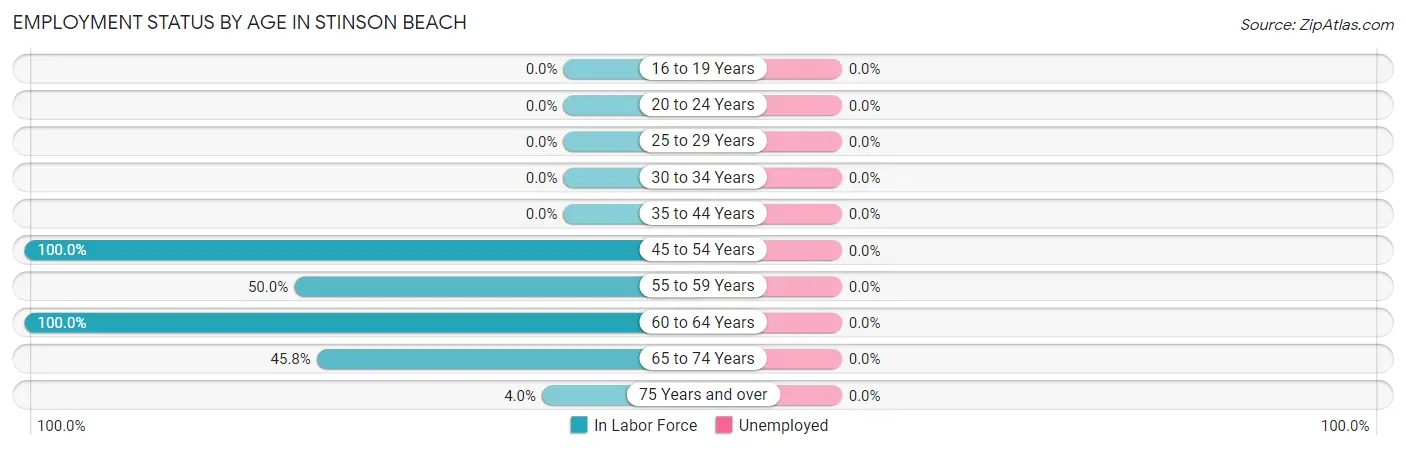
Employment Status by Age in Stinson Beach
| Age Bracket | In Labor Force | Unemployed |
| 16 to 19 Years | 0 (0.0%) | 0 (0.0%) |
| 20 to 24 Years | 0 (0.0%) | 0 (0.0%) |
| 25 to 29 Years | 0 (0.0%) | 0 (0.0%) |
| 30 to 34 Years | 0 (0.0%) | 0 (0.0%) |
| 35 to 44 Years | 0 (0.0%) | 0 (0.0%) |
| 45 to 54 Years | 123 (100.0%) | 0 (0.0%) |
| 55 to 59 Years | 16 (50.0%) | 0 (0.0%) |
| 60 to 64 Years | 27 (100.0%) | 0 (0.0%) |
| 65 to 74 Years | 38 (45.8%) | 0 (0.0%) |
| 75 Years and over | 4 (4.0%) | 0 (0.0%) |
| Total | 208 (57.1%) | 0 (0.0%) |
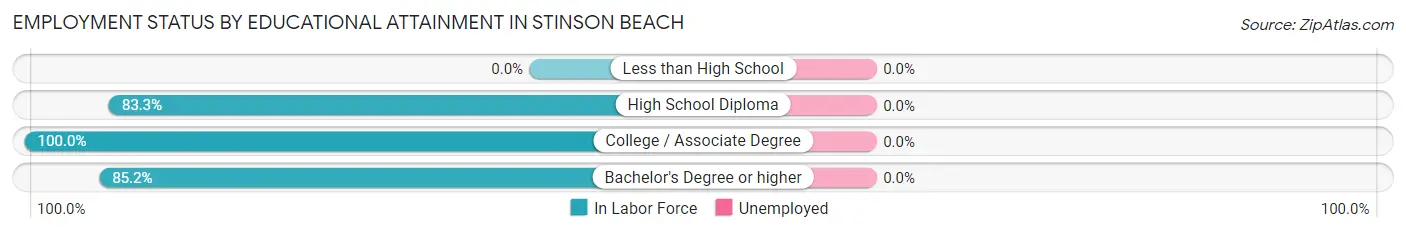
Employment Status by Educational Attainment in Stinson Beach
| Educational Attainment | In Labor Force | Unemployed |
| Less than High School | 0 (0.0%) | 0 (0.0%) |
| High School Diploma | 40 (83.3%) | 0 (0.0%) |
| College / Associate Degree | 80 (100.0%) | 0 (0.0%) |
| Bachelor's Degree or higher | 46 (85.2%) | 0 (0.0%) |
| Total | 166 (91.2%) | 0 (0.0%) |
Employment Occupations by Sex in Stinson Beach
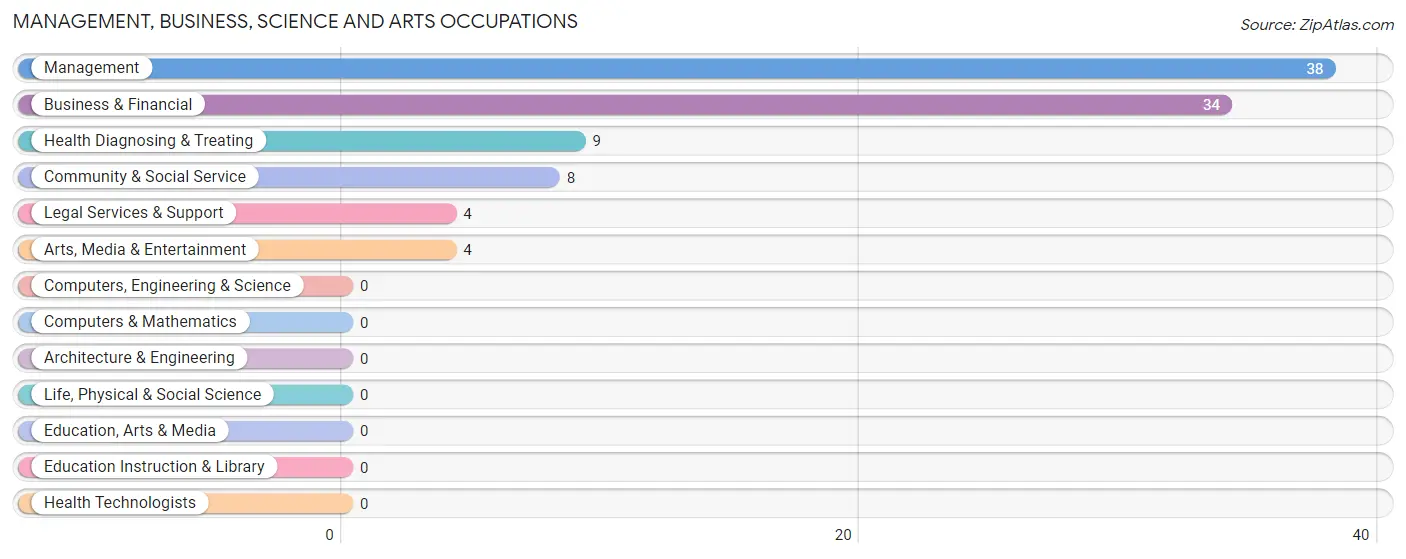
Management, Business, Science and Arts Occupations
The most common Management, Business, Science and Arts occupations in Stinson Beach are Management (38 | 18.3%), Business & Financial (34 | 16.4%), Health Diagnosing & Treating (9 | 4.3%), Community & Social Service (8 | 3.8%), and Legal Services & Support (4 | 1.9%).
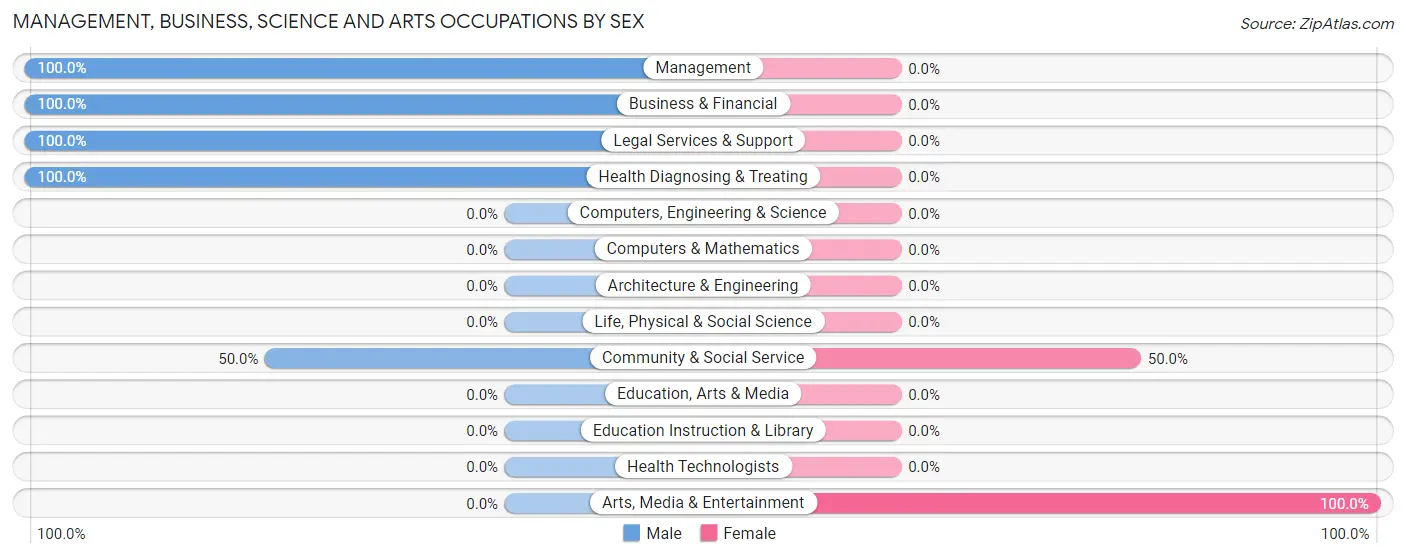
Management, Business, Science and Arts Occupations by Sex
Within the Management, Business, Science and Arts occupations in Stinson Beach, the most male-oriented occupations are Management (100.0%), Business & Financial (100.0%), and Legal Services & Support (100.0%), while the most female-oriented occupations are Arts, Media & Entertainment (100.0%), and Community & Social Service (50.0%).
| Occupation | Male | Female |
| Management | 38 (100.0%) | 0 (0.0%) |
| Business & Financial | 34 (100.0%) | 0 (0.0%) |
| Computers, Engineering & Science | 0 (0.0%) | 0 (0.0%) |
| Computers & Mathematics | 0 (0.0%) | 0 (0.0%) |
| Architecture & Engineering | 0 (0.0%) | 0 (0.0%) |
| Life, Physical & Social Science | 0 (0.0%) | 0 (0.0%) |
| Community & Social Service | 4 (50.0%) | 4 (50.0%) |
| Education, Arts & Media | 0 (0.0%) | 0 (0.0%) |
| Legal Services & Support | 4 (100.0%) | 0 (0.0%) |
| Education Instruction & Library | 0 (0.0%) | 0 (0.0%) |
| Arts, Media & Entertainment | 0 (0.0%) | 4 (100.0%) |
| Health Diagnosing & Treating | 9 (100.0%) | 0 (0.0%) |
| Health Technologists | 0 (0.0%) | 0 (0.0%) |
| Total (Category) | 85 (95.5%) | 4 (4.5%) |
| Total (Overall) | 159 (76.4%) | 49 (23.6%) |
Services Occupations
The most common Services occupations in Stinson Beach are , and Food Preparation & Serving (8 | 3.8%).
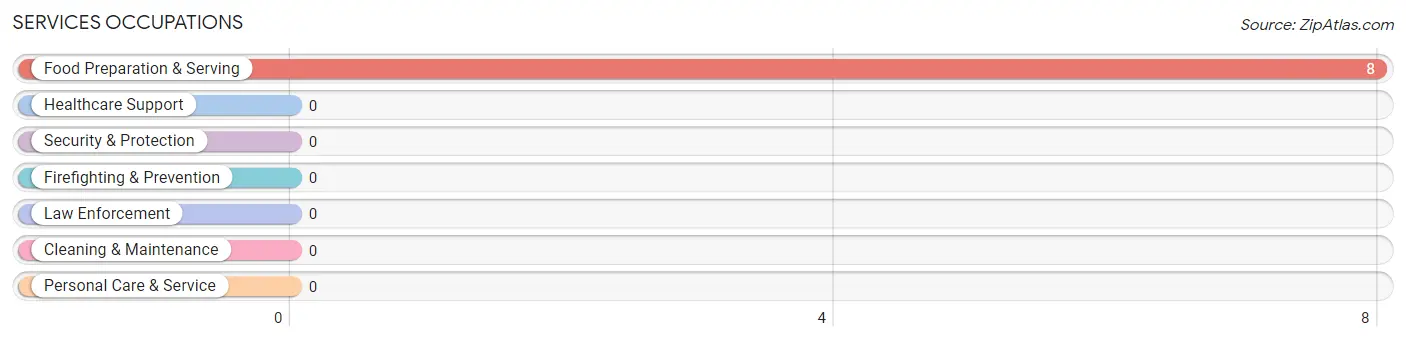
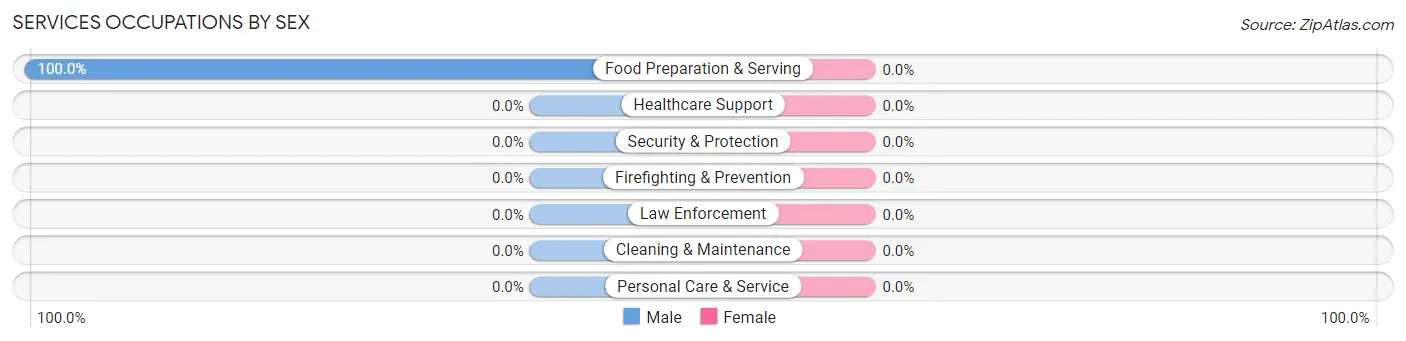
Services Occupations by Sex
| Occupation | Male | Female |
| Healthcare Support | 0 (0.0%) | 0 (0.0%) |
| Security & Protection | 0 (0.0%) | 0 (0.0%) |
| Firefighting & Prevention | 0 (0.0%) | 0 (0.0%) |
| Law Enforcement | 0 (0.0%) | 0 (0.0%) |
| Food Preparation & Serving | 8 (100.0%) | 0 (0.0%) |
| Cleaning & Maintenance | 0 (0.0%) | 0 (0.0%) |
| Personal Care & Service | 0 (0.0%) | 0 (0.0%) |
| Total (Category) | 8 (100.0%) | 0 (0.0%) |
| Total (Overall) | 159 (76.4%) | 49 (23.6%) |
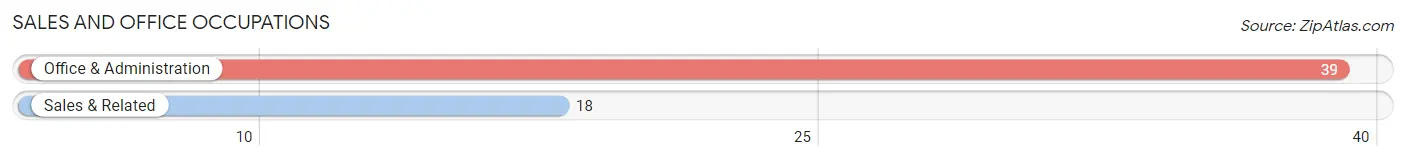
Sales and Office Occupations
The most common Sales and Office occupations in Stinson Beach are Office & Administration (39 | 18.8%), and Sales & Related (18 | 8.6%).
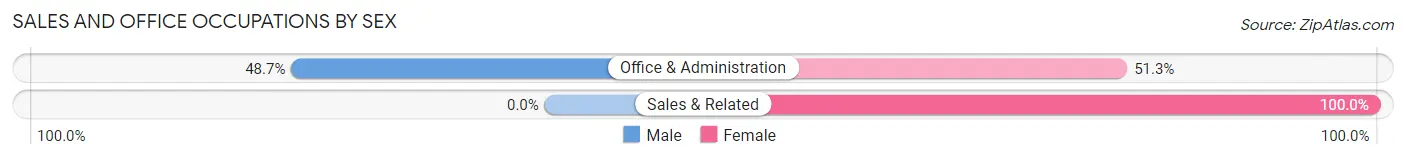
Sales and Office Occupations by Sex
| Occupation | Male | Female |
| Sales & Related | 0 (0.0%) | 18 (100.0%) |
| Office & Administration | 19 (48.7%) | 20 (51.3%) |
| Total (Category) | 19 (33.3%) | 38 (66.7%) |
| Total (Overall) | 159 (76.4%) | 49 (23.6%) |
Natural Resources, Construction and Maintenance Occupations
The most common Natural Resources, Construction and Maintenance occupations in Stinson Beach are , and Construction & Extraction (47 | 22.6%).
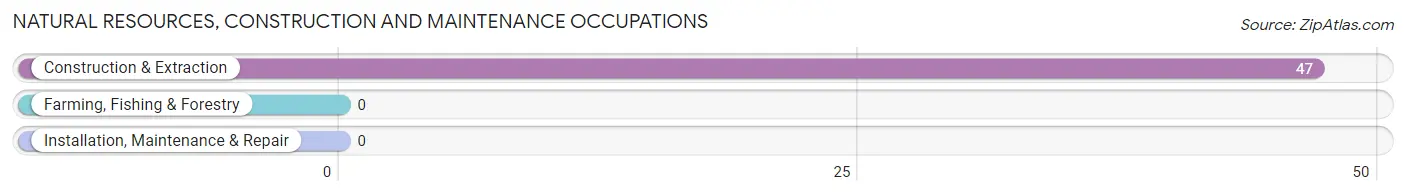
Natural Resources, Construction and Maintenance Occupations by Sex
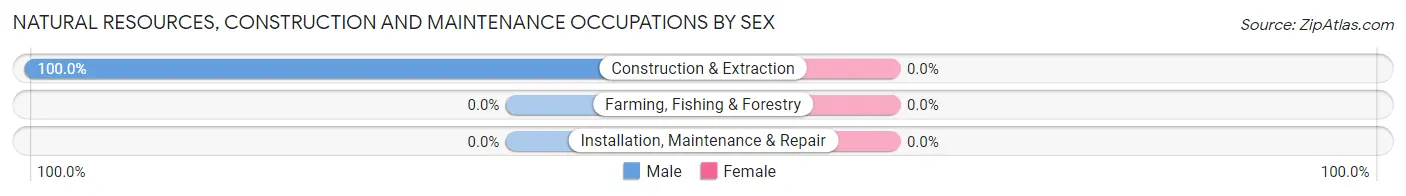
| Occupation | Male | Female |
| Farming, Fishing & Forestry | 0 (0.0%) | 0 (0.0%) |
| Construction & Extraction | 47 (100.0%) | 0 (0.0%) |
| Installation, Maintenance & Repair | 0 (0.0%) | 0 (0.0%) |
| Total (Category) | 47 (100.0%) | 0 (0.0%) |
| Total (Overall) | 159 (76.4%) | 49 (23.6%) |
Production, Transportation and Moving Occupations
The most common Production, Transportation and Moving occupations in Stinson Beach are , and Material Moving (7 | 3.4%).
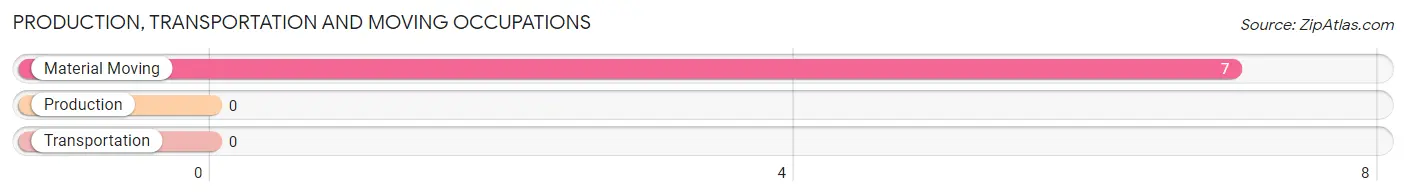
Production, Transportation and Moving Occupations by Sex
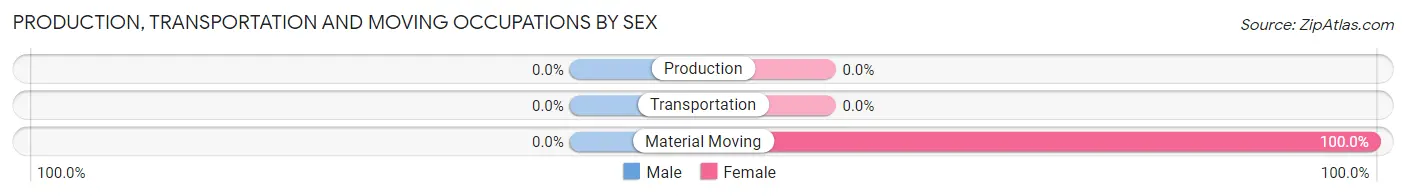
| Occupation | Male | Female |
| Production | 0 (0.0%) | 0 (0.0%) |
| Transportation | 0 (0.0%) | 0 (0.0%) |
| Material Moving | 0 (0.0%) | 7 (100.0%) |
| Total (Category) | 0 (0.0%) | 7 (100.0%) |
| Total (Overall) | 159 (76.4%) | 49 (23.6%) |
Employment Industries by Sex in Stinson Beach
Employment Industries in Stinson Beach
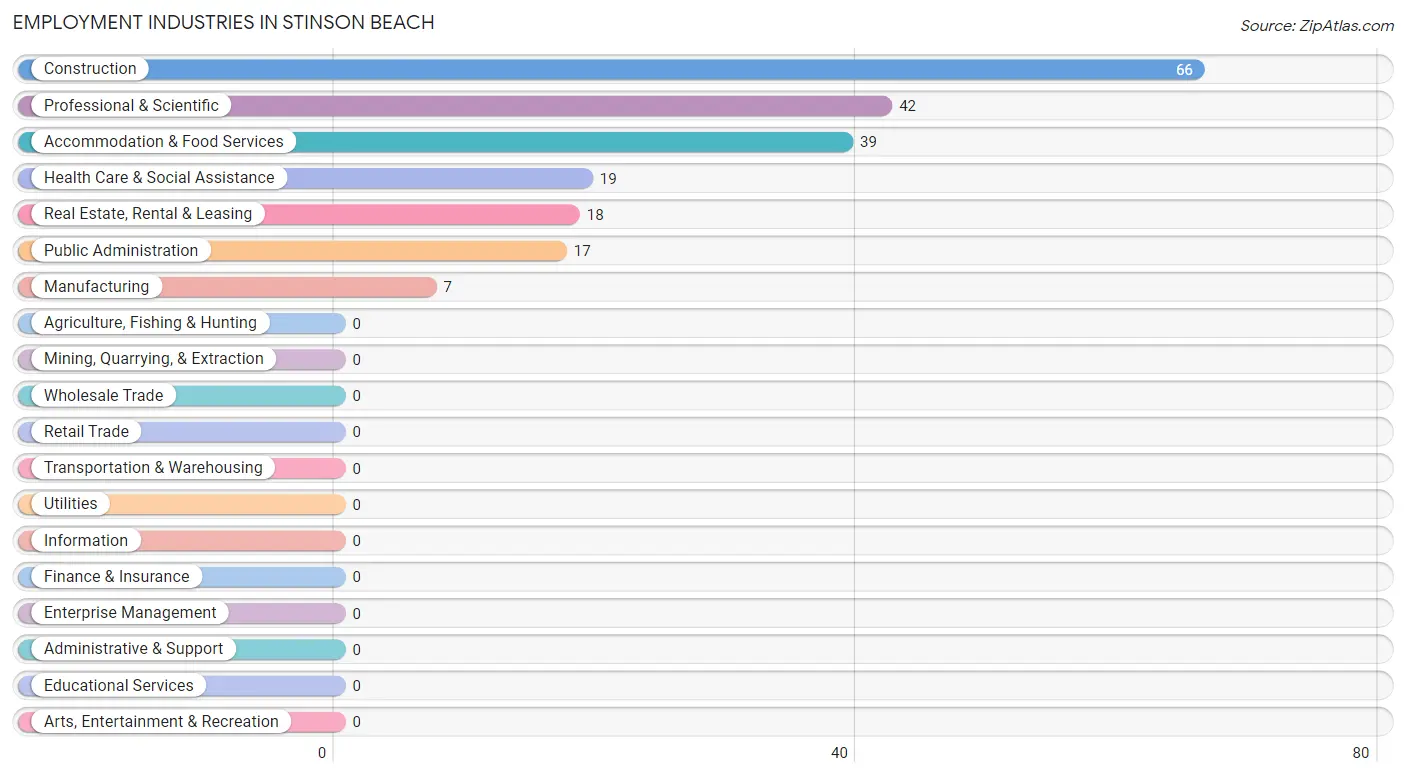
The major employment industries in Stinson Beach include Construction (66 | 31.7%), Professional & Scientific (42 | 20.2%), Accommodation & Food Services (39 | 18.8%), Health Care & Social Assistance (19 | 9.1%), and Real Estate, Rental & Leasing (18 | 8.6%).
Employment Industries by Sex in Stinson Beach
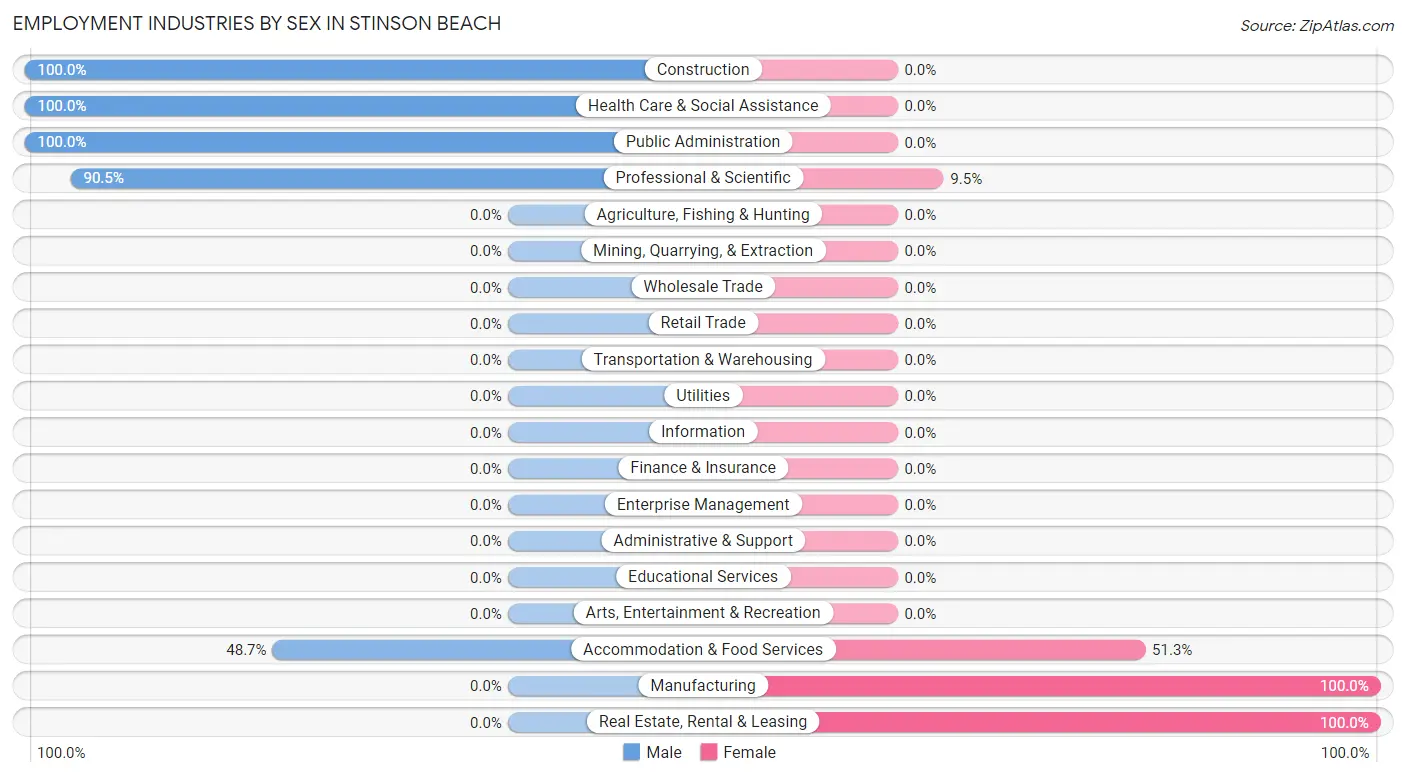
The Stinson Beach industries that see more men than women are Construction (100.0%), Health Care & Social Assistance (100.0%), and Public Administration (100.0%), whereas the industries that tend to have a higher number of women are Manufacturing (100.0%), Real Estate, Rental & Leasing (100.0%), and Accommodation & Food Services (51.3%).
| Industry | Male | Female |
| Agriculture, Fishing & Hunting | 0 (0.0%) | 0 (0.0%) |
| Mining, Quarrying, & Extraction | 0 (0.0%) | 0 (0.0%) |
| Construction | 66 (100.0%) | 0 (0.0%) |
| Manufacturing | 0 (0.0%) | 7 (100.0%) |
| Wholesale Trade | 0 (0.0%) | 0 (0.0%) |
| Retail Trade | 0 (0.0%) | 0 (0.0%) |
| Transportation & Warehousing | 0 (0.0%) | 0 (0.0%) |
| Utilities | 0 (0.0%) | 0 (0.0%) |
| Information | 0 (0.0%) | 0 (0.0%) |
| Finance & Insurance | 0 (0.0%) | 0 (0.0%) |
| Real Estate, Rental & Leasing | 0 (0.0%) | 18 (100.0%) |
| Professional & Scientific | 38 (90.5%) | 4 (9.5%) |
| Enterprise Management | 0 (0.0%) | 0 (0.0%) |
| Administrative & Support | 0 (0.0%) | 0 (0.0%) |
| Educational Services | 0 (0.0%) | 0 (0.0%) |
| Health Care & Social Assistance | 19 (100.0%) | 0 (0.0%) |
| Arts, Entertainment & Recreation | 0 (0.0%) | 0 (0.0%) |
| Accommodation & Food Services | 19 (48.7%) | 20 (51.3%) |
| Public Administration | 17 (100.0%) | 0 (0.0%) |
| Total | 159 (76.4%) | 49 (23.6%) |
Education in Stinson Beach
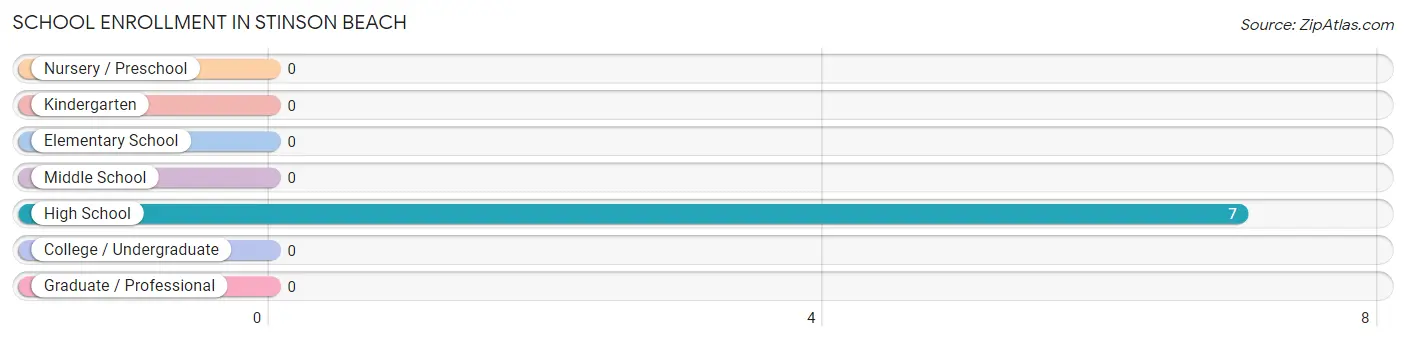
School Enrollment in Stinson Beach
| School Level | # Students | % Students |
| Nursery / Preschool | 0 | 0.0% |
| Kindergarten | 0 | 0.0% |
| Elementary School | 0 | 0.0% |
| Middle School | 0 | 0.0% |
| High School | 7 | 100.0% |
| College / Undergraduate | 0 | 0.0% |
| Graduate / Professional | 0 | 0.0% |
| Total | 7 | 100.0% |
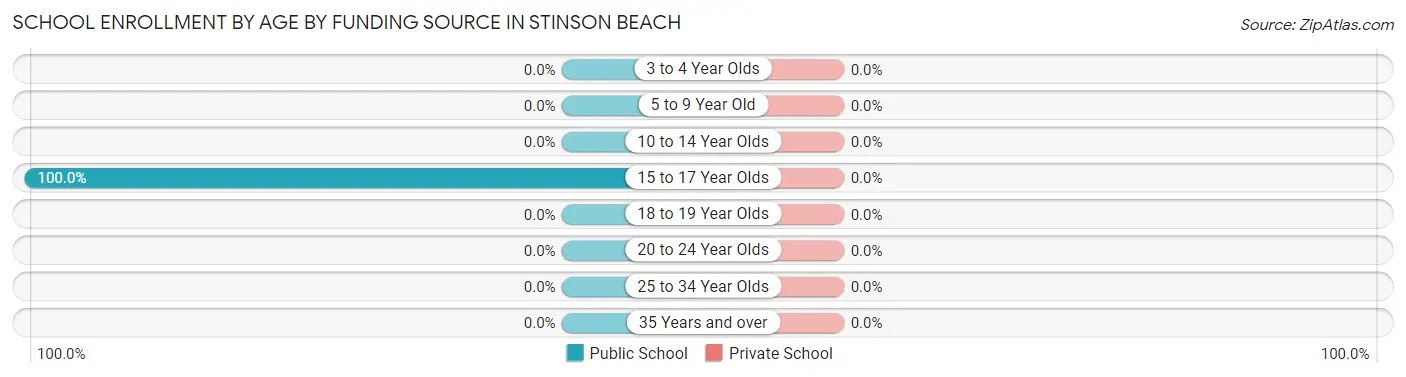
School Enrollment by Age by Funding Source in Stinson Beach
| Age Bracket | Public School | Private School |
| 3 to 4 Year Olds | 0 (0.0%) | 0 (0.0%) |
| 5 to 9 Year Old | 0 (0.0%) | 0 (0.0%) |
| 10 to 14 Year Olds | 0 (0.0%) | 0 (0.0%) |
| 15 to 17 Year Olds | 7 (100.0%) | 0 (0.0%) |
| 18 to 19 Year Olds | 0 (0.0%) | 0 (0.0%) |
| 20 to 24 Year Olds | 0 (0.0%) | 0 (0.0%) |
| 25 to 34 Year Olds | 0 (0.0%) | 0 (0.0%) |
| 35 Years and over | 0 (0.0%) | 0 (0.0%) |
| Total | 7 (100.0%) | 0 (0.0%) |
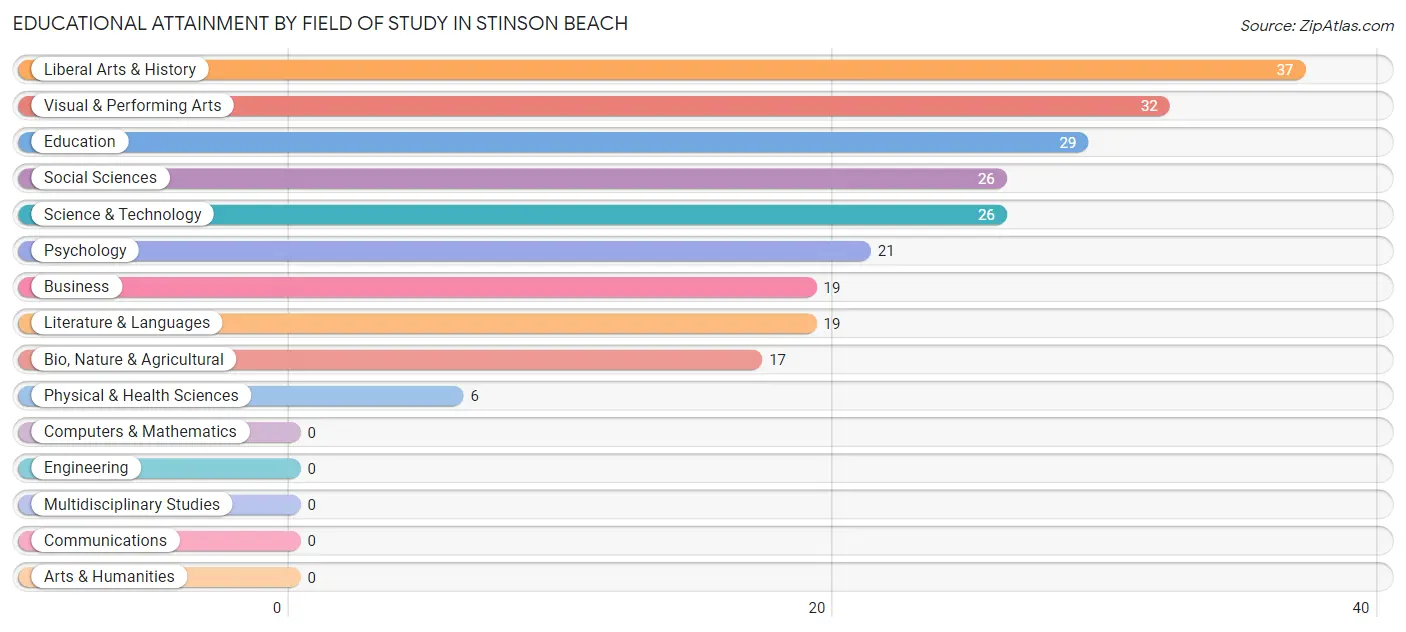
Educational Attainment by Field of Study in Stinson Beach
Liberal arts & history (37 | 16.0%), visual & performing arts (32 | 13.8%), education (29 | 12.5%), social sciences (26 | 11.2%), and science & technology (26 | 11.2%) are the most common fields of study among 232 individuals in Stinson Beach who have obtained a bachelor's degree or higher.
| Field of Study | # Graduates | % Graduates |
| Computers & Mathematics | 0 | 0.0% |
| Bio, Nature & Agricultural | 17 | 7.3% |
| Physical & Health Sciences | 6 | 2.6% |
| Psychology | 21 | 9.0% |
| Social Sciences | 26 | 11.2% |
| Engineering | 0 | 0.0% |
| Multidisciplinary Studies | 0 | 0.0% |
| Science & Technology | 26 | 11.2% |
| Business | 19 | 8.2% |
| Education | 29 | 12.5% |
| Literature & Languages | 19 | 8.2% |
| Liberal Arts & History | 37 | 16.0% |
| Visual & Performing Arts | 32 | 13.8% |
| Communications | 0 | 0.0% |
| Arts & Humanities | 0 | 0.0% |
| Total | 232 | 100.0% |
Transportation & Commute in Stinson Beach
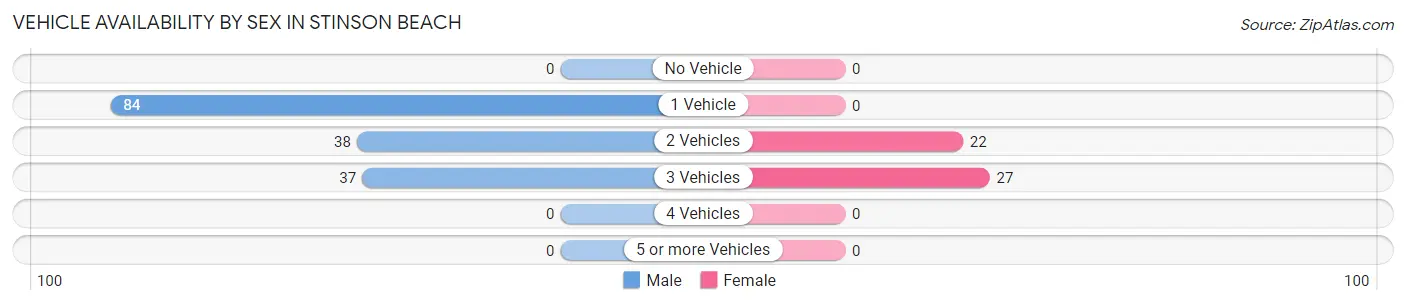
Vehicle Availability by Sex in Stinson Beach
The most prevalent vehicle ownership categories in Stinson Beach are males with 1 vehicle (84, accounting for 52.8%) and females with 1 vehicle (0, making up 171.4%).
| Vehicles Available | Male | Female |
| No Vehicle | 0 (0.0%) | 0 (0.0%) |
| 1 Vehicle | 84 (52.8%) | 0 (0.0%) |
| 2 Vehicles | 38 (23.9%) | 22 (44.9%) |
| 3 Vehicles | 37 (23.3%) | 27 (55.1%) |
| 4 Vehicles | 0 (0.0%) | 0 (0.0%) |
| 5 or more Vehicles | 0 (0.0%) | 0 (0.0%) |
| Total | 159 (100.0%) | 49 (100.0%) |
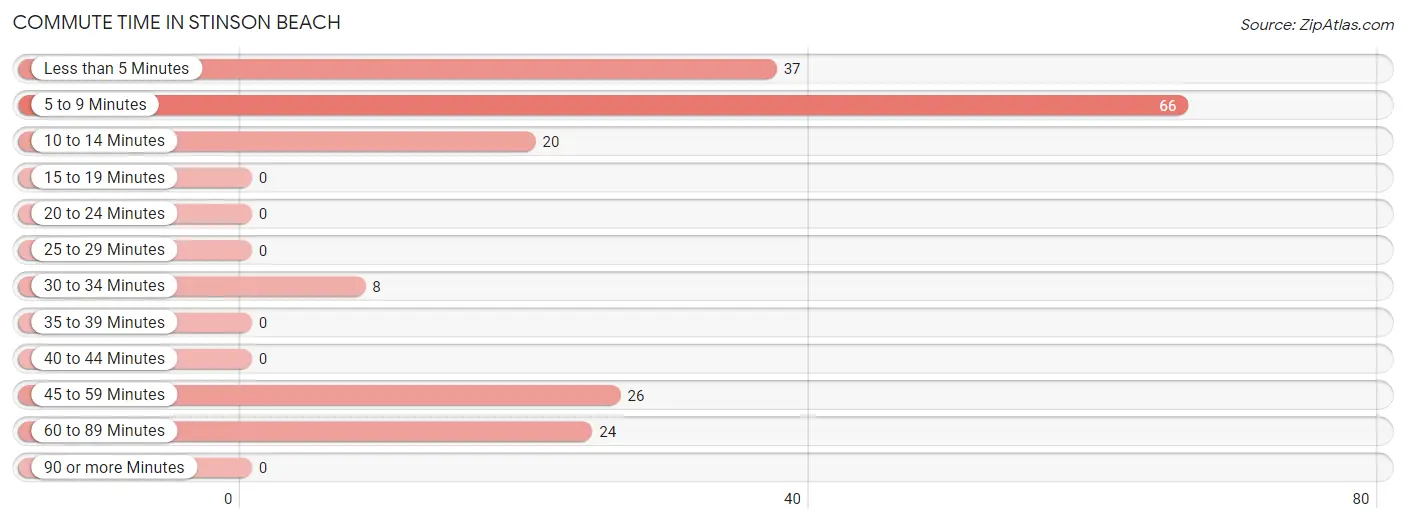
Commute Time in Stinson Beach
The most frequently occuring commute durations in Stinson Beach are 5 to 9 minutes (66 commuters, 36.5%), less than 5 minutes (37 commuters, 20.4%), and 45 to 59 minutes (26 commuters, 14.4%).
| Commute Time | # Commuters | % Commuters |
| Less than 5 Minutes | 37 | 20.4% |
| 5 to 9 Minutes | 66 | 36.5% |
| 10 to 14 Minutes | 20 | 11.1% |
| 15 to 19 Minutes | 0 | 0.0% |
| 20 to 24 Minutes | 0 | 0.0% |
| 25 to 29 Minutes | 0 | 0.0% |
| 30 to 34 Minutes | 8 | 4.4% |
| 35 to 39 Minutes | 0 | 0.0% |
| 40 to 44 Minutes | 0 | 0.0% |
| 45 to 59 Minutes | 26 | 14.4% |
| 60 to 89 Minutes | 24 | 13.3% |
| 90 or more Minutes | 0 | 0.0% |
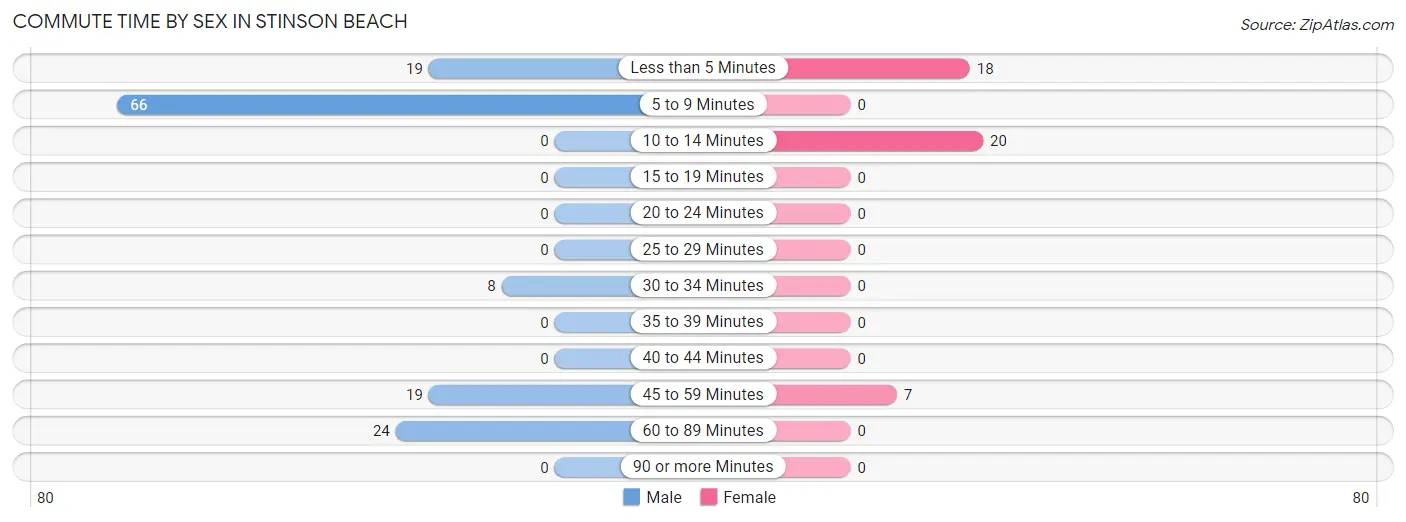
Commute Time by Sex in Stinson Beach
The most common commute times in Stinson Beach are 5 to 9 minutes (66 commuters, 48.5%) for males and 10 to 14 minutes (20 commuters, 44.4%) for females.
| Commute Time | Male | Female |
| Less than 5 Minutes | 19 (14.0%) | 18 (40.0%) |
| 5 to 9 Minutes | 66 (48.5%) | 0 (0.0%) |
| 10 to 14 Minutes | 0 (0.0%) | 20 (44.4%) |
| 15 to 19 Minutes | 0 (0.0%) | 0 (0.0%) |
| 20 to 24 Minutes | 0 (0.0%) | 0 (0.0%) |
| 25 to 29 Minutes | 0 (0.0%) | 0 (0.0%) |
| 30 to 34 Minutes | 8 (5.9%) | 0 (0.0%) |
| 35 to 39 Minutes | 0 (0.0%) | 0 (0.0%) |
| 40 to 44 Minutes | 0 (0.0%) | 0 (0.0%) |
| 45 to 59 Minutes | 19 (14.0%) | 7 (15.6%) |
| 60 to 89 Minutes | 24 (17.6%) | 0 (0.0%) |
| 90 or more Minutes | 0 (0.0%) | 0 (0.0%) |
Time of Departure to Work by Sex in Stinson Beach
The most frequent times of departure to work in Stinson Beach are 8:00 AM to 8:29 AM (54, 39.7%) for males and 8:00 AM to 8:29 AM (25, 55.6%) for females.
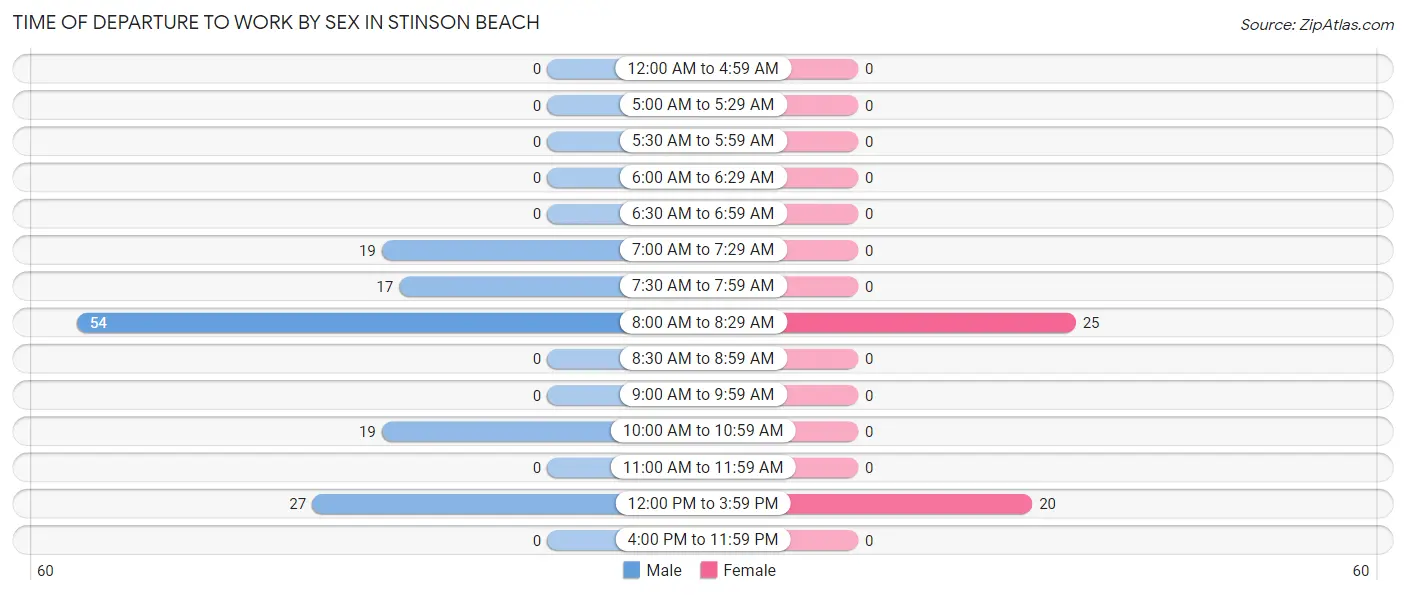
| Time of Departure | Male | Female |
| 12:00 AM to 4:59 AM | 0 (0.0%) | 0 (0.0%) |
| 5:00 AM to 5:29 AM | 0 (0.0%) | 0 (0.0%) |
| 5:30 AM to 5:59 AM | 0 (0.0%) | 0 (0.0%) |
| 6:00 AM to 6:29 AM | 0 (0.0%) | 0 (0.0%) |
| 6:30 AM to 6:59 AM | 0 (0.0%) | 0 (0.0%) |
| 7:00 AM to 7:29 AM | 19 (14.0%) | 0 (0.0%) |
| 7:30 AM to 7:59 AM | 17 (12.5%) | 0 (0.0%) |
| 8:00 AM to 8:29 AM | 54 (39.7%) | 25 (55.6%) |
| 8:30 AM to 8:59 AM | 0 (0.0%) | 0 (0.0%) |
| 9:00 AM to 9:59 AM | 0 (0.0%) | 0 (0.0%) |
| 10:00 AM to 10:59 AM | 19 (14.0%) | 0 (0.0%) |
| 11:00 AM to 11:59 AM | 0 (0.0%) | 0 (0.0%) |
| 12:00 PM to 3:59 PM | 27 (19.9%) | 20 (44.4%) |
| 4:00 PM to 11:59 PM | 0 (0.0%) | 0 (0.0%) |
| Total | 136 (100.0%) | 45 (100.0%) |
Housing Occupancy in Stinson Beach
Occupancy by Ownership in Stinson Beach
Of the total 224 dwellings in Stinson Beach, owner-occupied units account for 132 (58.9%), while renter-occupied units make up 92 (41.1%).
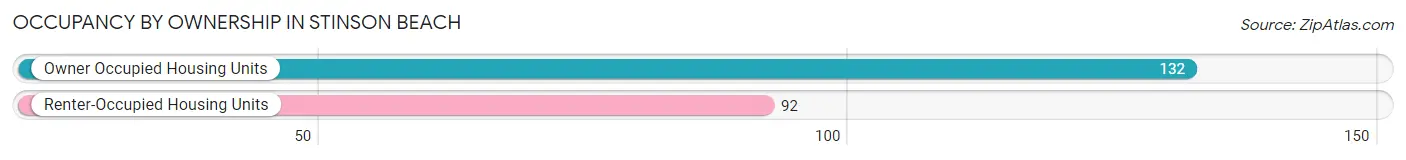
| Occupancy | # Housing Units | % Housing Units |
| Owner Occupied Housing Units | 132 | 58.9% |
| Renter-Occupied Housing Units | 92 | 41.1% |
| Total Occupied Housing Units | 224 | 100.0% |
Occupancy by Household Size in Stinson Beach
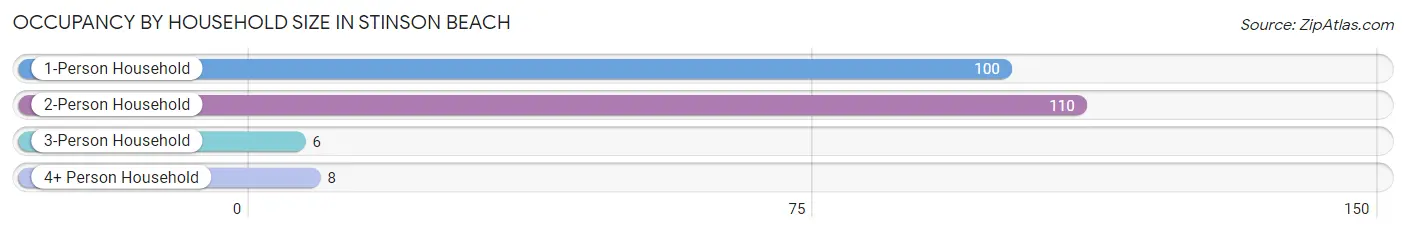
| Household Size | # Housing Units | % Housing Units |
| 1-Person Household | 100 | 44.6% |
| 2-Person Household | 110 | 49.1% |
| 3-Person Household | 6 | 2.7% |
| 4+ Person Household | 8 | 3.6% |
| Total Housing Units | 224 | 100.0% |
Occupancy by Ownership by Household Size in Stinson Beach
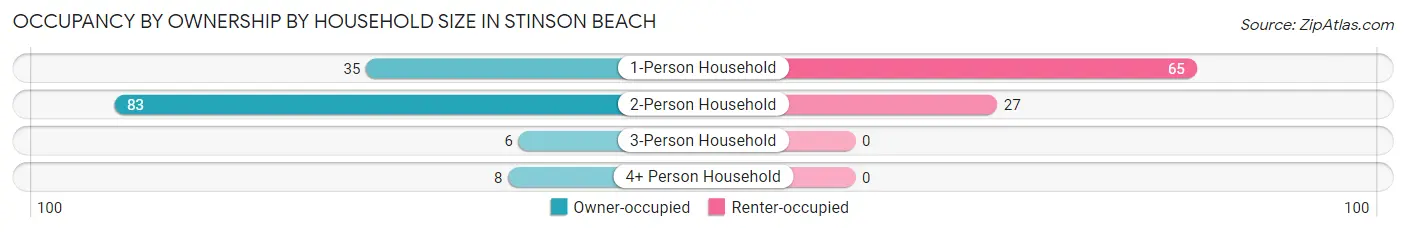
| Household Size | Owner-occupied | Renter-occupied |
| 1-Person Household | 35 (35.0%) | 65 (65.0%) |
| 2-Person Household | 83 (75.4%) | 27 (24.5%) |
| 3-Person Household | 6 (100.0%) | 0 (0.0%) |
| 4+ Person Household | 8 (100.0%) | 0 (0.0%) |
| Total Housing Units | 132 (58.9%) | 92 (41.1%) |
Occupancy by Educational Attainment in Stinson Beach
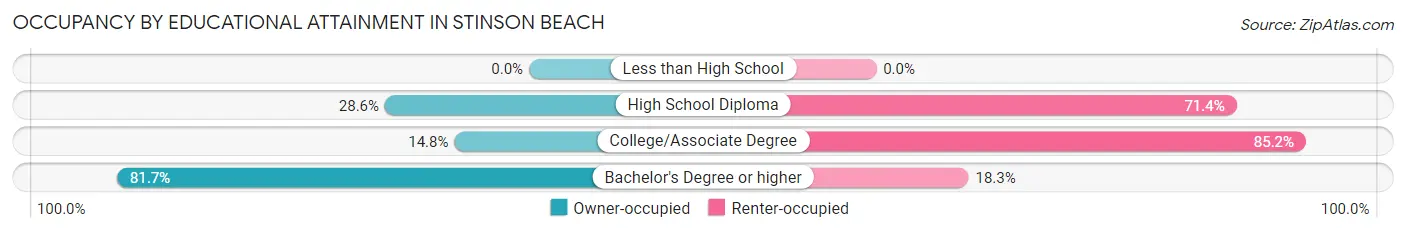
| Household Size | Owner-occupied | Renter-occupied |
| Less than High School | 0 (0.0%) | 0 (0.0%) |
| High School Diploma | 8 (28.6%) | 20 (71.4%) |
| College/Associate Degree | 8 (14.8%) | 46 (85.2%) |
| Bachelor's Degree or higher | 116 (81.7%) | 26 (18.3%) |
Occupancy by Age of Householder in Stinson Beach
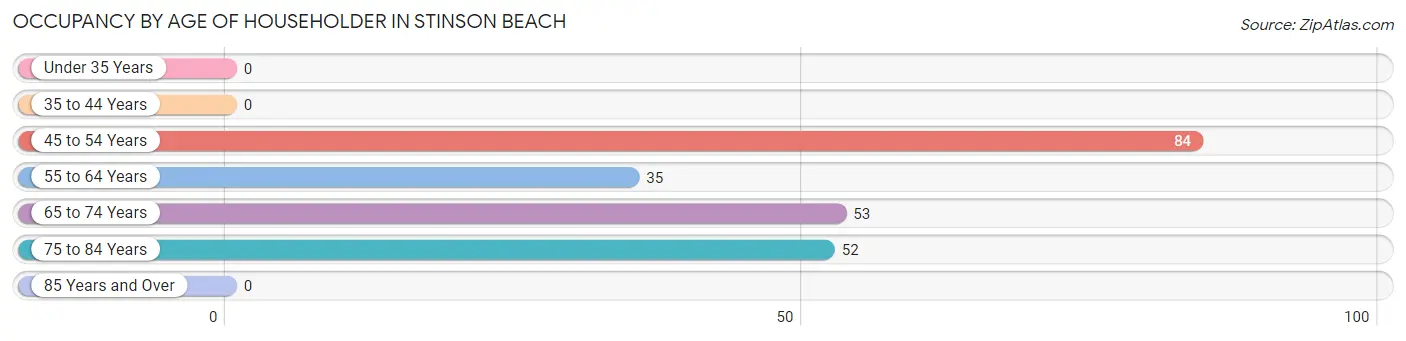
| Age Bracket | # Households | % Households |
| Under 35 Years | 0 | 0.0% |
| 35 to 44 Years | 0 | 0.0% |
| 45 to 54 Years | 84 | 37.5% |
| 55 to 64 Years | 35 | 15.6% |
| 65 to 74 Years | 53 | 23.7% |
| 75 to 84 Years | 52 | 23.2% |
| 85 Years and Over | 0 | 0.0% |
| Total | 224 | 100.0% |
Housing Finances in Stinson Beach
Median Income by Occupancy in Stinson Beach
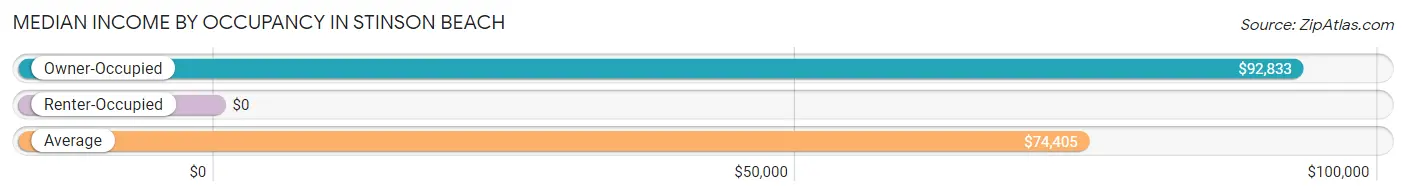
| Occupancy Type | # Households | Median Income |
| Owner-Occupied | 132 (58.9%) | $92,833 |
| Renter-Occupied | 92 (41.1%) | $0 |
| Average | 224 (100.0%) | $74,405 |
Occupancy by Householder Income Bracket in Stinson Beach
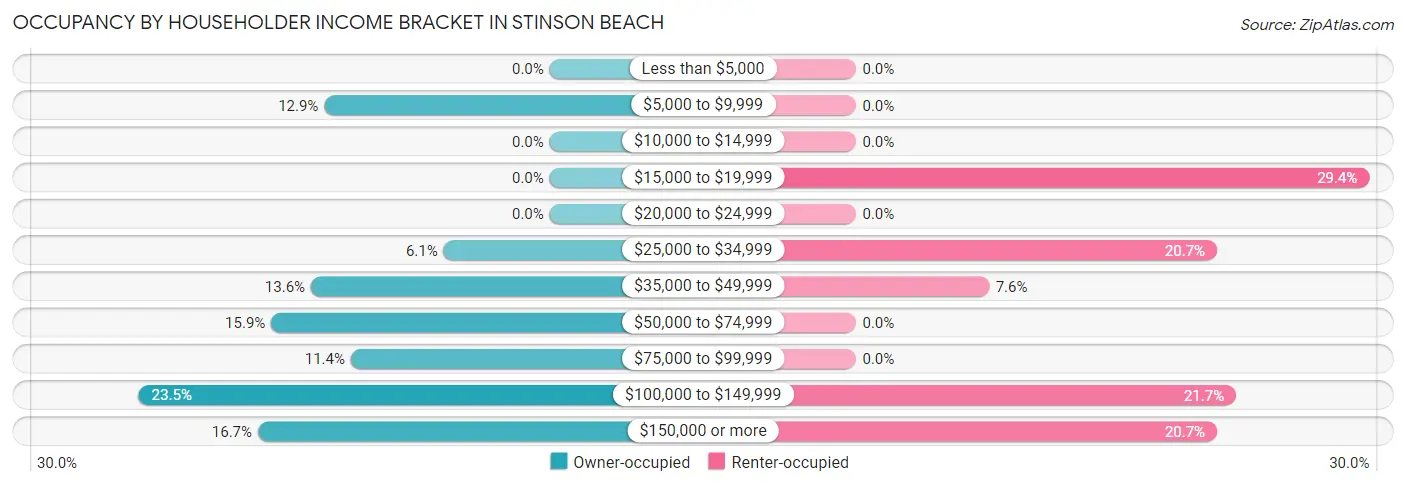
| Income Bracket | Owner-occupied | Renter-occupied |
| Less than $5,000 | 0 (0.0%) | 0 (0.0%) |
| $5,000 to $9,999 | 17 (12.9%) | 0 (0.0%) |
| $10,000 to $14,999 | 0 (0.0%) | 0 (0.0%) |
| $15,000 to $19,999 | 0 (0.0%) | 27 (29.3%) |
| $20,000 to $24,999 | 0 (0.0%) | 0 (0.0%) |
| $25,000 to $34,999 | 8 (6.1%) | 19 (20.6%) |
| $35,000 to $49,999 | 18 (13.6%) | 7 (7.6%) |
| $50,000 to $74,999 | 21 (15.9%) | 0 (0.0%) |
| $75,000 to $99,999 | 15 (11.4%) | 0 (0.0%) |
| $100,000 to $149,999 | 31 (23.5%) | 20 (21.7%) |
| $150,000 or more | 22 (16.7%) | 19 (20.6%) |
| Total | 132 (100.0%) | 92 (100.0%) |
Monthly Housing Cost Tiers in Stinson Beach
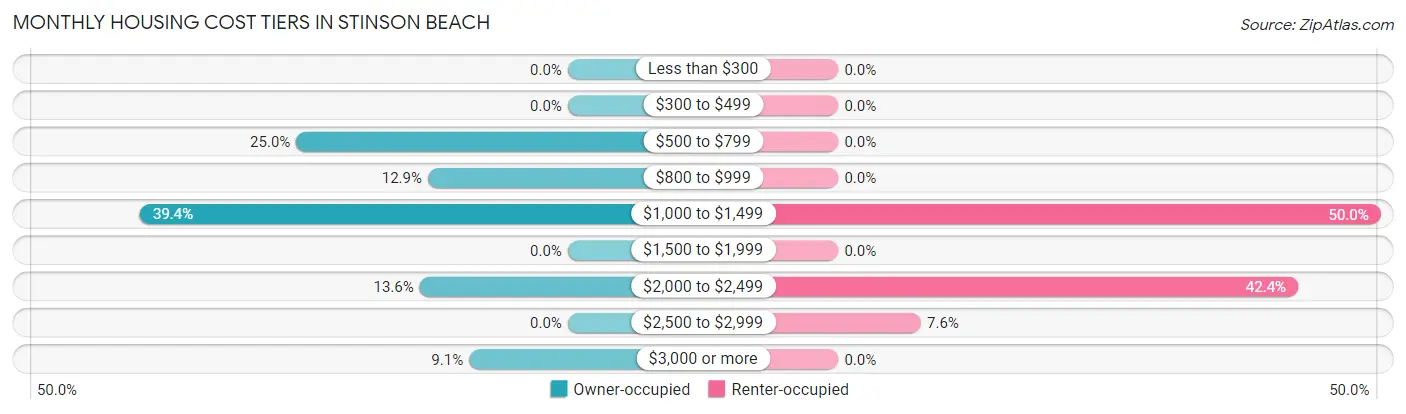
| Monthly Cost | Owner-occupied | Renter-occupied |
| Less than $300 | 0 (0.0%) | 0 (0.0%) |
| $300 to $499 | 0 (0.0%) | 0 (0.0%) |
| $500 to $799 | 33 (25.0%) | 0 (0.0%) |
| $800 to $999 | 17 (12.9%) | 0 (0.0%) |
| $1,000 to $1,499 | 52 (39.4%) | 46 (50.0%) |
| $1,500 to $1,999 | 0 (0.0%) | 0 (0.0%) |
| $2,000 to $2,499 | 18 (13.6%) | 39 (42.4%) |
| $2,500 to $2,999 | 0 (0.0%) | 7 (7.6%) |
| $3,000 or more | 12 (9.1%) | 0 (0.0%) |
| Total | 132 (100.0%) | 92 (100.0%) |
Physical Housing Characteristics in Stinson Beach
Housing Structures in Stinson Beach
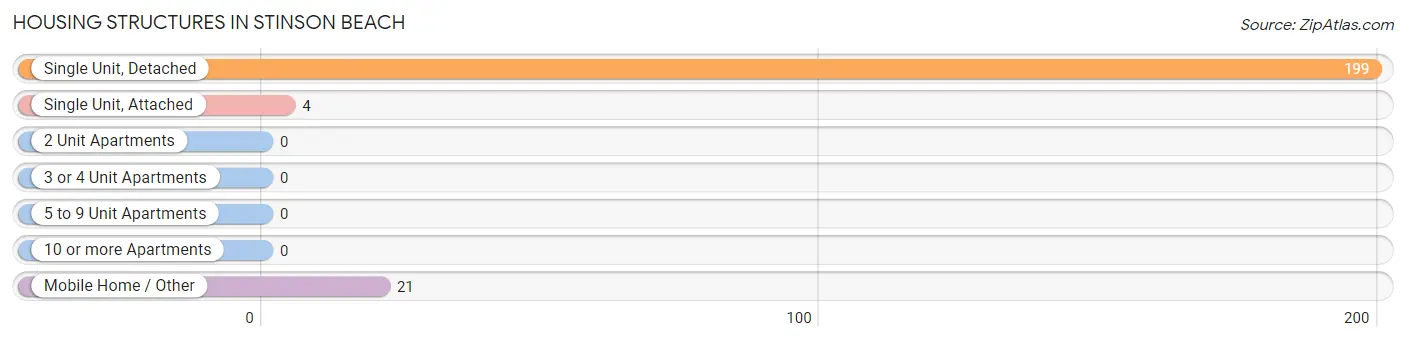
| Structure Type | # Housing Units | % Housing Units |
| Single Unit, Detached | 199 | 88.8% |
| Single Unit, Attached | 4 | 1.8% |
| 2 Unit Apartments | 0 | 0.0% |
| 3 or 4 Unit Apartments | 0 | 0.0% |
| 5 to 9 Unit Apartments | 0 | 0.0% |
| 10 or more Apartments | 0 | 0.0% |
| Mobile Home / Other | 21 | 9.4% |
| Total | 224 | 100.0% |
Housing Structures by Occupancy in Stinson Beach
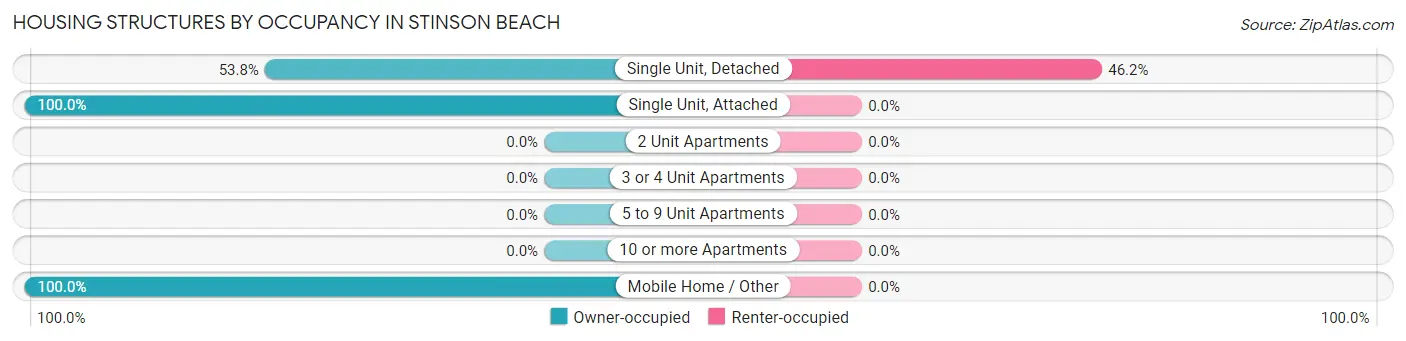
| Structure Type | Owner-occupied | Renter-occupied |
| Single Unit, Detached | 107 (53.8%) | 92 (46.2%) |
| Single Unit, Attached | 4 (100.0%) | 0 (0.0%) |
| 2 Unit Apartments | 0 (0.0%) | 0 (0.0%) |
| 3 or 4 Unit Apartments | 0 (0.0%) | 0 (0.0%) |
| 5 to 9 Unit Apartments | 0 (0.0%) | 0 (0.0%) |
| 10 or more Apartments | 0 (0.0%) | 0 (0.0%) |
| Mobile Home / Other | 21 (100.0%) | 0 (0.0%) |
| Total | 132 (58.9%) | 92 (41.1%) |
Housing Structures by Number of Rooms in Stinson Beach
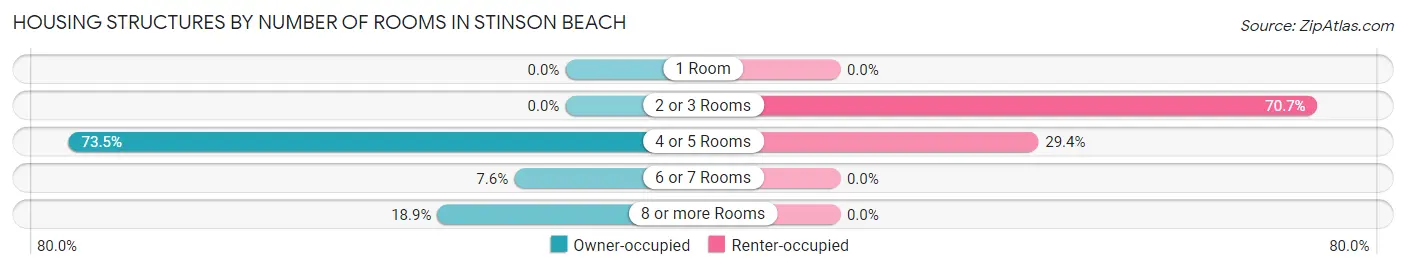
| Number of Rooms | Owner-occupied | Renter-occupied |
| 1 Room | 0 (0.0%) | 0 (0.0%) |
| 2 or 3 Rooms | 0 (0.0%) | 65 (70.7%) |
| 4 or 5 Rooms | 97 (73.5%) | 27 (29.3%) |
| 6 or 7 Rooms | 10 (7.6%) | 0 (0.0%) |
| 8 or more Rooms | 25 (18.9%) | 0 (0.0%) |
| Total | 132 (100.0%) | 92 (100.0%) |
Housing Structure by Heating Type in Stinson Beach
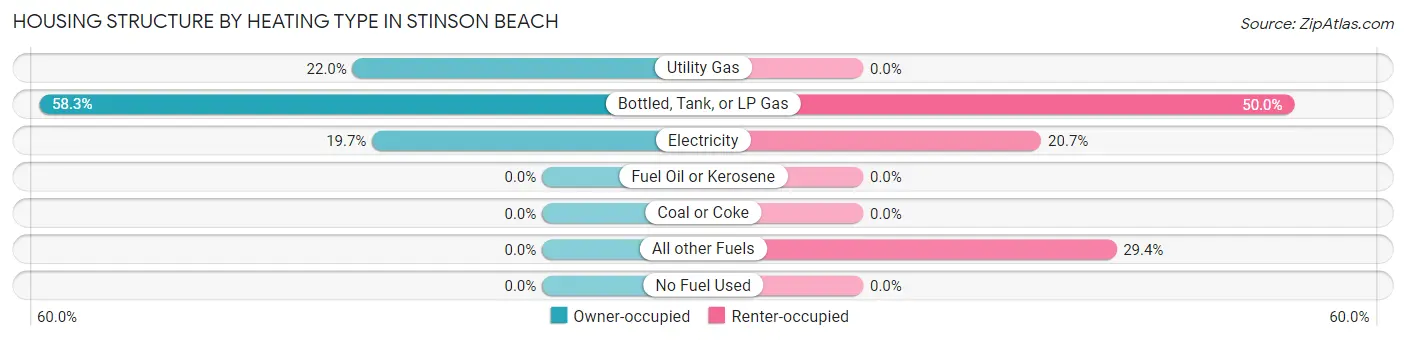
| Heating Type | Owner-occupied | Renter-occupied |
| Utility Gas | 29 (22.0%) | 0 (0.0%) |
| Bottled, Tank, or LP Gas | 77 (58.3%) | 46 (50.0%) |
| Electricity | 26 (19.7%) | 19 (20.6%) |
| Fuel Oil or Kerosene | 0 (0.0%) | 0 (0.0%) |
| Coal or Coke | 0 (0.0%) | 0 (0.0%) |
| All other Fuels | 0 (0.0%) | 27 (29.3%) |
| No Fuel Used | 0 (0.0%) | 0 (0.0%) |
| Total | 132 (100.0%) | 92 (100.0%) |
Household Vehicle Usage in Stinson Beach
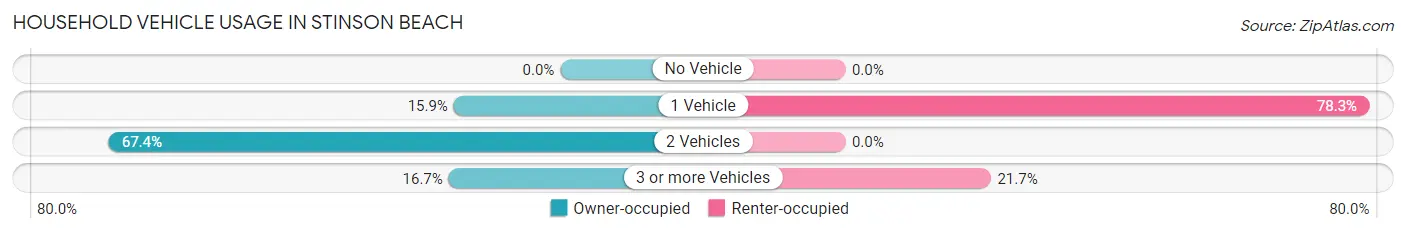
| Vehicles per Household | Owner-occupied | Renter-occupied |
| No Vehicle | 0 (0.0%) | 0 (0.0%) |
| 1 Vehicle | 21 (15.9%) | 72 (78.3%) |
| 2 Vehicles | 89 (67.4%) | 0 (0.0%) |
| 3 or more Vehicles | 22 (16.7%) | 20 (21.7%) |
| Total | 132 (100.0%) | 92 (100.0%) |
Real Estate & Mortgages in Stinson Beach
Real Estate and Mortgage Overview in Stinson Beach
| Characteristic | Without Mortgage | With Mortgage |
| Housing Units | 81 | 51 |
| Median Property Value | $1,756,900 | $0 |
| Median Household Income | - | - |
| Monthly Housing Costs | $844 | $12 |
| Real Estate Taxes | $2,810 | $0 |
Property Value by Mortgage Status in Stinson Beach
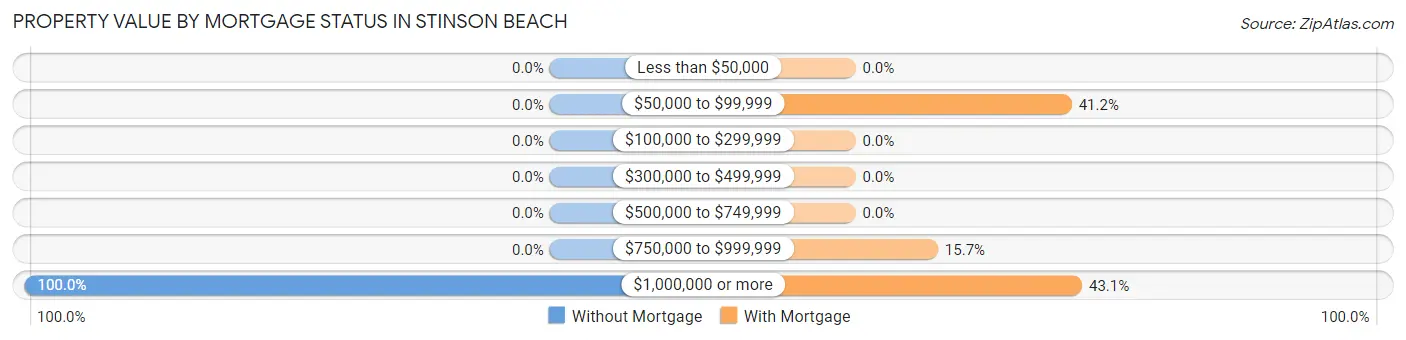
| Property Value | Without Mortgage | With Mortgage |
| Less than $50,000 | 0 (0.0%) | 0 (0.0%) |
| $50,000 to $99,999 | 0 (0.0%) | 21 (41.2%) |
| $100,000 to $299,999 | 0 (0.0%) | 0 (0.0%) |
| $300,000 to $499,999 | 0 (0.0%) | 0 (0.0%) |
| $500,000 to $749,999 | 0 (0.0%) | 0 (0.0%) |
| $750,000 to $999,999 | 0 (0.0%) | 8 (15.7%) |
| $1,000,000 or more | 81 (100.0%) | 22 (43.1%) |
| Total | 81 (100.0%) | 51 (100.0%) |
Household Income by Mortgage Status in Stinson Beach
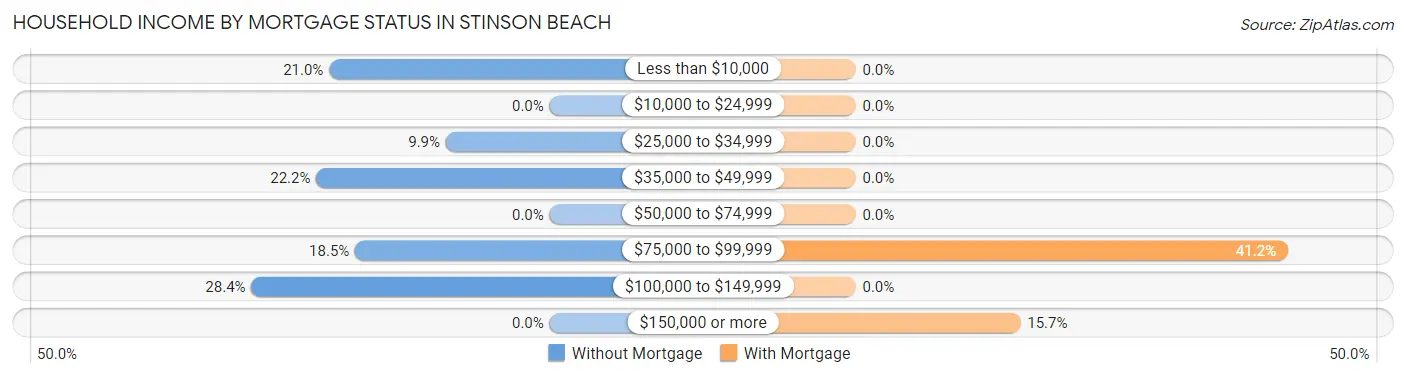
| Household Income | Without Mortgage | With Mortgage |
| Less than $10,000 | 17 (21.0%) | 0 (0.0%) |
| $10,000 to $24,999 | 0 (0.0%) | 0 (0.0%) |
| $25,000 to $34,999 | 8 (9.9%) | 0 (0.0%) |
| $35,000 to $49,999 | 18 (22.2%) | 0 (0.0%) |
| $50,000 to $74,999 | 0 (0.0%) | 0 (0.0%) |
| $75,000 to $99,999 | 15 (18.5%) | 21 (41.2%) |
| $100,000 to $149,999 | 23 (28.4%) | 0 (0.0%) |
| $150,000 or more | 0 (0.0%) | 8 (15.7%) |
| Total | 81 (100.0%) | 51 (100.0%) |
Property Value to Household Income Ratio in Stinson Beach
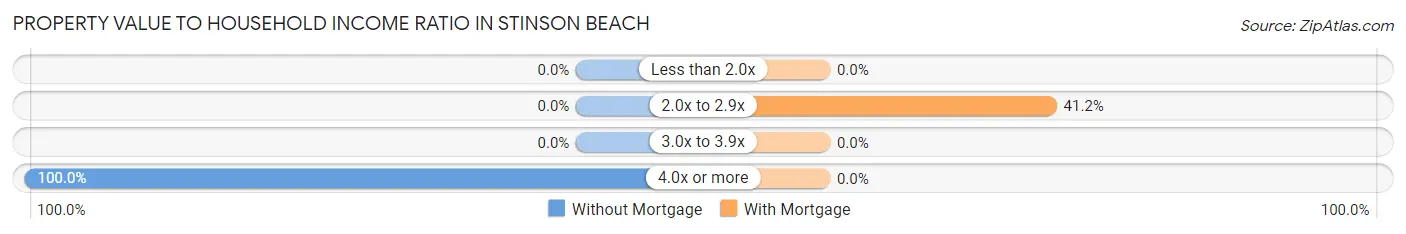
| Value-to-Income Ratio | Without Mortgage | With Mortgage |
| Less than 2.0x | 0 (0.0%) | 0 (0.0%) |
| 2.0x to 2.9x | 0 (0.0%) | 21 (41.2%) |
| 3.0x to 3.9x | 0 (0.0%) | 0 (0.0%) |
| 4.0x or more | 81 (100.0%) | 0 (0.0%) |
| Total | 81 (100.0%) | 51 (100.0%) |
Real Estate Taxes by Mortgage Status in Stinson Beach
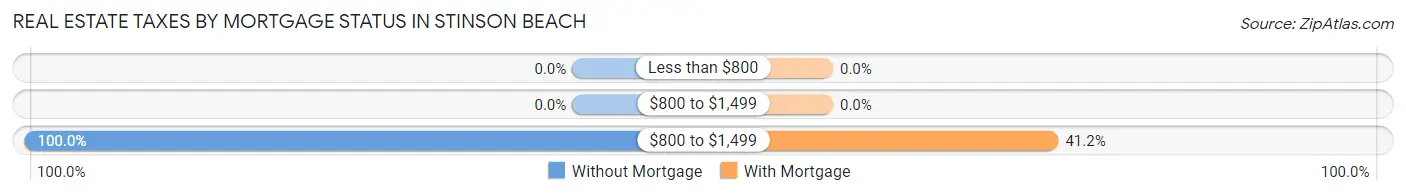
| Property Taxes | Without Mortgage | With Mortgage |
| Less than $800 | 0 (0.0%) | 0 (0.0%) |
| $800 to $1,499 | 0 (0.0%) | 0 (0.0%) |
| $800 to $1,499 | 81 (100.0%) | 21 (41.2%) |
| Total | 81 (100.0%) | 51 (100.0%) |
Health & Disability in Stinson Beach
Health Insurance Coverage by Age in Stinson Beach
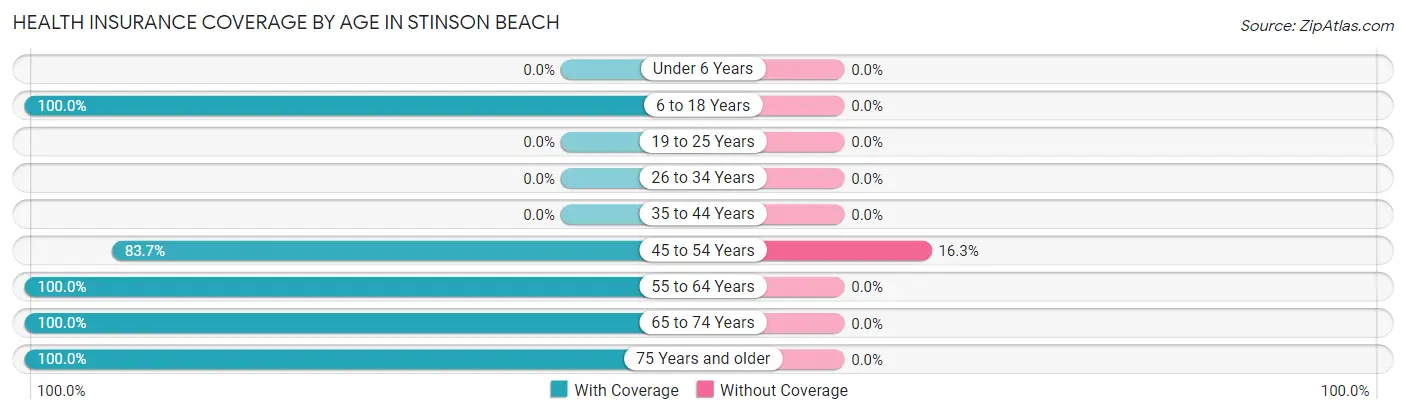
| Age Bracket | With Coverage | Without Coverage |
| Under 6 Years | 0 (0.0%) | 0 (0.0%) |
| 6 to 18 Years | 7 (100.0%) | 0 (0.0%) |
| 19 to 25 Years | 0 (0.0%) | 0 (0.0%) |
| 26 to 34 Years | 0 (0.0%) | 0 (0.0%) |
| 35 to 44 Years | 0 (0.0%) | 0 (0.0%) |
| 45 to 54 Years | 103 (83.7%) | 20 (16.3%) |
| 55 to 64 Years | 59 (100.0%) | 0 (0.0%) |
| 65 to 74 Years | 83 (100.0%) | 0 (0.0%) |
| 75 Years and older | 99 (100.0%) | 0 (0.0%) |
| Total | 351 (94.6%) | 20 (5.4%) |
Health Insurance Coverage by Citizenship Status in Stinson Beach
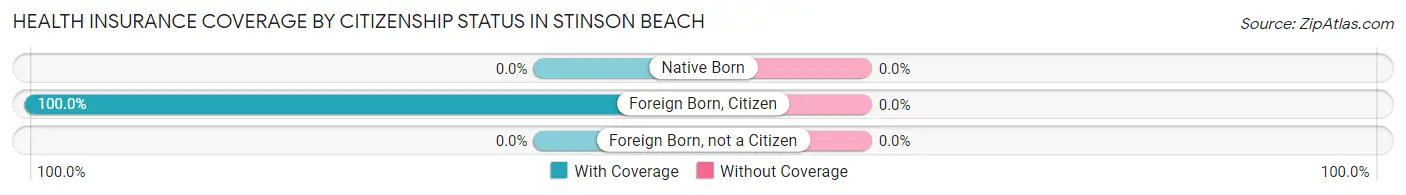
| Citizenship Status | With Coverage | Without Coverage |
| Native Born | 0 (0.0%) | 0 (0.0%) |
| Foreign Born, Citizen | 7 (100.0%) | 0 (0.0%) |
| Foreign Born, not a Citizen | 0 (0.0%) | 0 (0.0%) |
Health Insurance Coverage by Household Income in Stinson Beach
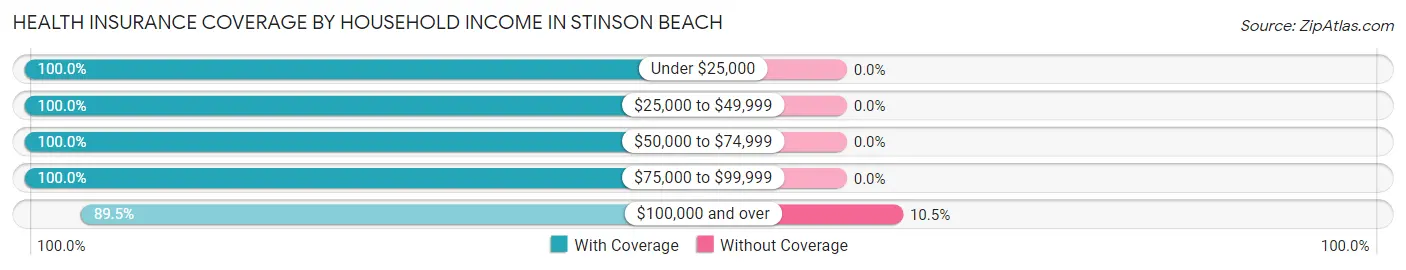
| Household Income | With Coverage | Without Coverage |
| Under $25,000 | 44 (100.0%) | 0 (0.0%) |
| $25,000 to $49,999 | 67 (100.0%) | 0 (0.0%) |
| $50,000 to $74,999 | 40 (100.0%) | 0 (0.0%) |
| $75,000 to $99,999 | 30 (100.0%) | 0 (0.0%) |
| $100,000 and over | 170 (89.5%) | 20 (10.5%) |
Public vs Private Health Insurance Coverage by Age in Stinson Beach
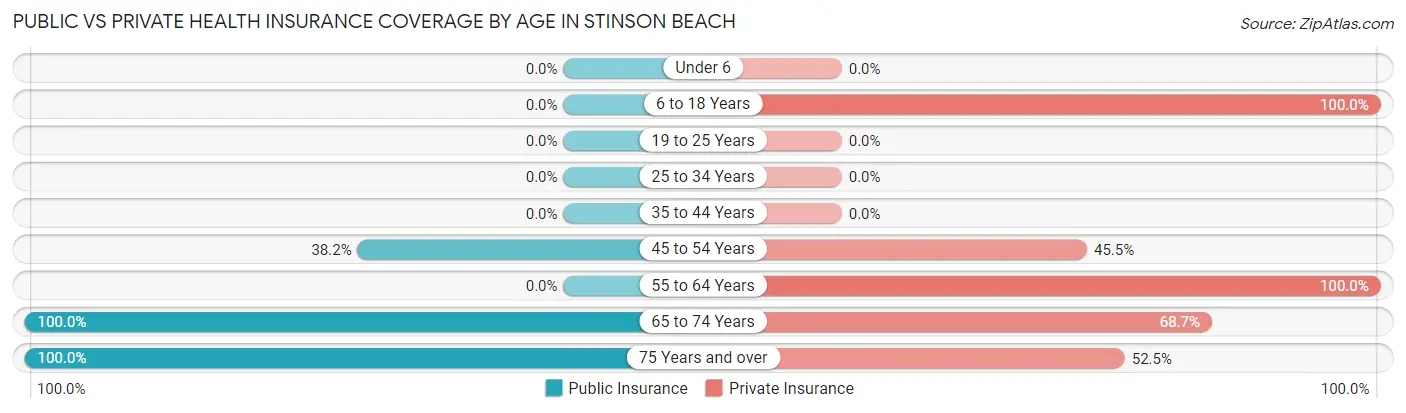
| Age Bracket | Public Insurance | Private Insurance |
| Under 6 | 0 (0.0%) | 0 (0.0%) |
| 6 to 18 Years | 0 (0.0%) | 7 (100.0%) |
| 19 to 25 Years | 0 (0.0%) | 0 (0.0%) |
| 25 to 34 Years | 0 (0.0%) | 0 (0.0%) |
| 35 to 44 Years | 0 (0.0%) | 0 (0.0%) |
| 45 to 54 Years | 47 (38.2%) | 56 (45.5%) |
| 55 to 64 Years | 0 (0.0%) | 59 (100.0%) |
| 65 to 74 Years | 83 (100.0%) | 57 (68.7%) |
| 75 Years and over | 99 (100.0%) | 52 (52.5%) |
| Total | 229 (61.7%) | 231 (62.3%) |
Disability Status by Sex by Age in Stinson Beach
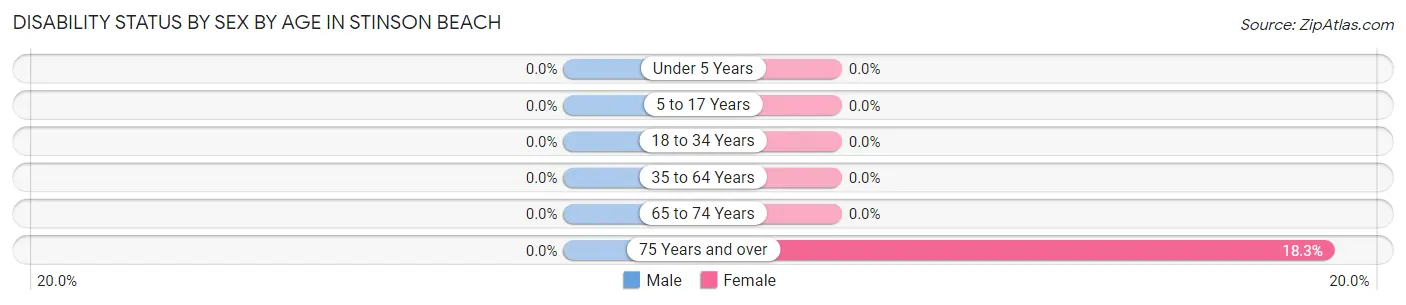
| Age Bracket | Male | Female |
| Under 5 Years | 0 (0.0%) | 0 (0.0%) |
| 5 to 17 Years | 0 (0.0%) | 0 (0.0%) |
| 18 to 34 Years | 0 (0.0%) | 0 (0.0%) |
| 35 to 64 Years | 0 (0.0%) | 0 (0.0%) |
| 65 to 74 Years | 0 (0.0%) | 0 (0.0%) |
| 75 Years and over | 0 (0.0%) | 15 (18.3%) |
Disability Class by Sex by Age in Stinson Beach
Disability Class: Hearing Difficulty
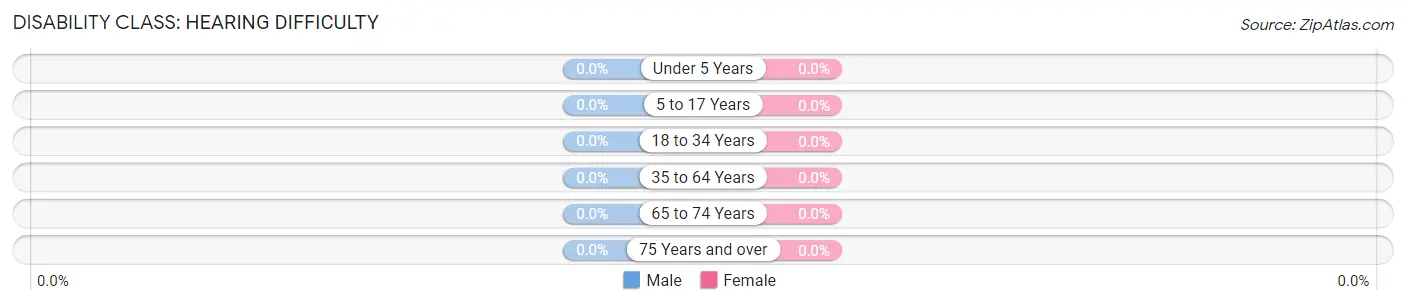
| Age Bracket | Male | Female |
| Under 5 Years | 0 (0.0%) | 0 (0.0%) |
| 5 to 17 Years | 0 (0.0%) | 0 (0.0%) |
| 18 to 34 Years | 0 (0.0%) | 0 (0.0%) |
| 35 to 64 Years | 0 (0.0%) | 0 (0.0%) |
| 65 to 74 Years | 0 (0.0%) | 0 (0.0%) |
| 75 Years and over | 0 (0.0%) | 0 (0.0%) |
Disability Class: Vision Difficulty
| Age Bracket | Male | Female |
| Under 5 Years | 0 (0.0%) | 0 (0.0%) |
| 5 to 17 Years | 0 (0.0%) | 0 (0.0%) |
| 18 to 34 Years | 0 (0.0%) | 0 (0.0%) |
| 35 to 64 Years | 0 (0.0%) | 0 (0.0%) |
| 65 to 74 Years | 0 (0.0%) | 0 (0.0%) |
| 75 Years and over | 0 (0.0%) | 0 (0.0%) |
Disability Class: Cognitive Difficulty
| Age Bracket | Male | Female |
| 5 to 17 Years | 0 (0.0%) | 0 (0.0%) |
| 18 to 34 Years | 0 (0.0%) | 0 (0.0%) |
| 35 to 64 Years | 0 (0.0%) | 0 (0.0%) |
| 65 to 74 Years | 0 (0.0%) | 0 (0.0%) |
| 75 Years and over | 0 (0.0%) | 0 (0.0%) |
Disability Class: Ambulatory Difficulty
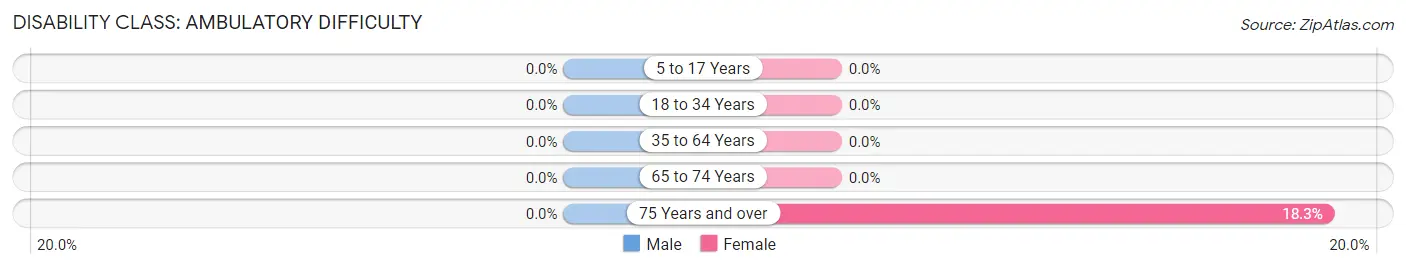
| Age Bracket | Male | Female |
| 5 to 17 Years | 0 (0.0%) | 0 (0.0%) |
| 18 to 34 Years | 0 (0.0%) | 0 (0.0%) |
| 35 to 64 Years | 0 (0.0%) | 0 (0.0%) |
| 65 to 74 Years | 0 (0.0%) | 0 (0.0%) |
| 75 Years and over | 0 (0.0%) | 15 (18.3%) |
Disability Class: Self-Care Difficulty
| Age Bracket | Male | Female |
| 5 to 17 Years | 0 (0.0%) | 0 (0.0%) |
| 18 to 34 Years | 0 (0.0%) | 0 (0.0%) |
| 35 to 64 Years | 0 (0.0%) | 0 (0.0%) |
| 65 to 74 Years | 0 (0.0%) | 0 (0.0%) |
| 75 Years and over | 0 (0.0%) | 0 (0.0%) |
Technology Access in Stinson Beach
Computing Device Access in Stinson Beach
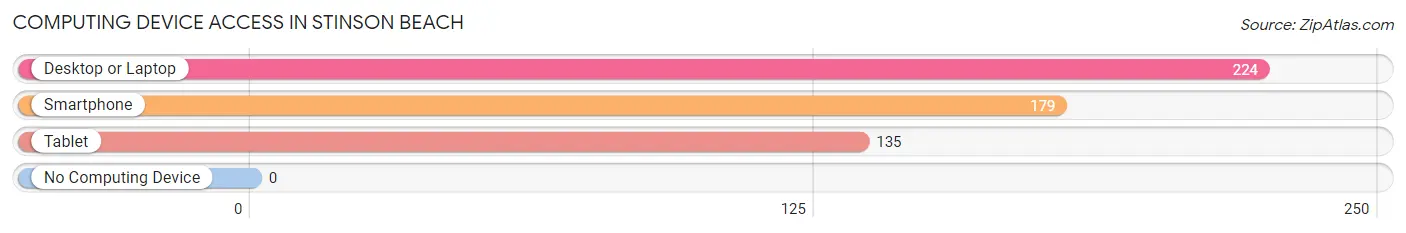
| Device Type | # Households | % Households |
| Desktop or Laptop | 224 | 100.0% |
| Smartphone | 179 | 79.9% |
| Tablet | 135 | 60.3% |
| No Computing Device | 0 | 0.0% |
| Total | 224 | 100.0% |
Internet Access in Stinson Beach
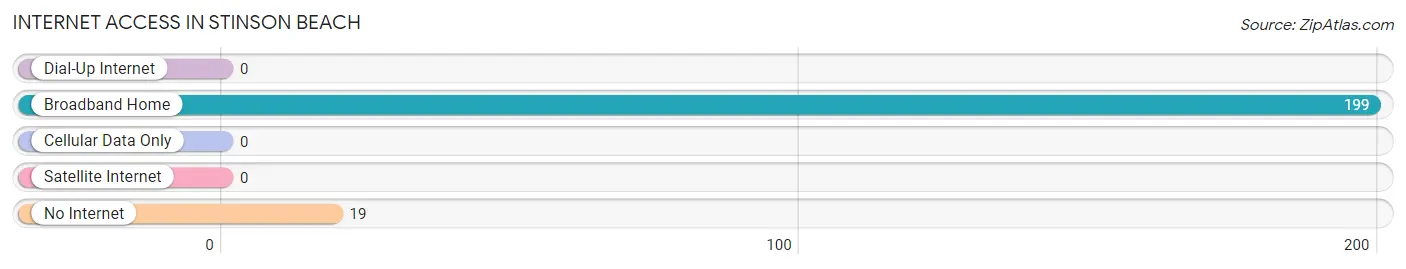
| Internet Type | # Households | % Households |
| Dial-Up Internet | 0 | 0.0% |
| Broadband Home | 199 | 88.8% |
| Cellular Data Only | 0 | 0.0% |
| Satellite Internet | 0 | 0.0% |
| No Internet | 19 | 8.5% |
| Total | 224 | 100.0% |
Stinson Beach Summary
Stinson Beach is a small unincorporated community located in Marin County, California, United States. It is situated on the Pacific Coast, approximately 25 miles northwest of San Francisco. The community is located on the northern shore of Bolinas Lagoon, and is bordered by the Golden Gate National Recreation Area to the south and the Point Reyes National Seashore to the north. Stinson Beach is a popular destination for beachgoers, hikers, and nature lovers.
History
The area that is now Stinson Beach has been inhabited by Native Americans for thousands of years. The first Europeans to explore the area were Spanish explorers in the late 1700s. The area was later settled by ranchers in the mid-1800s. In the late 1800s, the area was developed as a resort destination, and the first hotel was built in 1875. The area was named after the Stinson family, who owned a large ranch in the area.
In the early 1900s, the area became a popular destination for vacationers from San Francisco. The Stinson Beach Hotel was built in 1912, and the area was incorporated as a town in 1916. The town was later annexed by Marin County in 1922.
Geography
Stinson Beach is located on the northern shore of Bolinas Lagoon, approximately 25 miles northwest of San Francisco. The community is bordered by the Golden Gate National Recreation Area to the south and the Point Reyes National Seashore to the north. The area is characterized by rolling hills, redwood forests, and sandy beaches. The climate is mild and temperate, with average temperatures ranging from the mid-50s to the mid-70s.
Economy
Stinson Beach is a popular tourist destination, and the local economy is largely driven by tourism. The area is home to several hotels, restaurants, and shops. The town is also home to a number of art galleries, and is a popular destination for artists and art enthusiasts.
Demographics
As of the 2010 census, the population of Stinson Beach was 632. The racial makeup of the town was 94.3% White, 0.8% African American, 0.3% Native American, 0.8% Asian, 0.3% Pacific Islander, 0.8% from other races, and 2.5% from two or more races. The median household income was $90,000, and the median family income was $105,000. The per capita income was $45,000.
Conclusion
Stinson Beach is a small unincorporated community located in Marin County, California, United States. It is situated on the Pacific Coast, approximately 25 miles northwest of San Francisco. The area is characterized by rolling hills, redwood forests, and sandy beaches. The local economy is largely driven by tourism, and the area is home to several hotels, restaurants, and shops. As of the 2010 census, the population of Stinson Beach was 632. The median household income was $90,000, and the median family income was $105,000.
Common Questions
What is Per Capita Income in Stinson Beach?
Per Capita income in Stinson Beach is $62,004.
What is the Median Family Income in Stinson Beach?
Median Family Income in Stinson Beach is $74,286.
What is the Median Household income in Stinson Beach?
Median Household Income in Stinson Beach is $74,405.
What is Inequality or Gini Index in Stinson Beach?
Inequality or Gini Index in Stinson Beach is 0.47.
What is the Total Population of Stinson Beach?
Total Population of Stinson Beach is 371.
What is the Total Male Population of Stinson Beach?
Total Male Population of Stinson Beach is 226.
What is the Total Female Population of Stinson Beach?
Total Female Population of Stinson Beach is 145.
What is the Ratio of Males per 100 Females in Stinson Beach?
There are 155.86 Males per 100 Females in Stinson Beach.
What is the Ratio of Females per 100 Males in Stinson Beach?
There are 64.16 Females per 100 Males in Stinson Beach.
What is the Median Population Age in Stinson Beach?
Median Population Age in Stinson Beach is 63.8 Years.
What is the Average Family Size in Stinson Beach
Average Family Size in Stinson Beach is 2.2 People.
What is the Average Household Size in Stinson Beach
Average Household Size in Stinson Beach is 1.7 People.
How Large is the Labor Force in Stinson Beach?
There are 208 People in the Labor Forcein in Stinson Beach.
What is the Percentage of People in the Labor Force in Stinson Beach?
57.1% of People are in the Labor Force in Stinson Beach.