Thermalito, CA Map & Demographics
Thermalito Map
Thermalito Overview
$28,802
PER CAPITA INCOME
$51,509
AVG FAMILY INCOME
$48,013
AVG HOUSEHOLD INCOME
34.6%
WAGE / INCOME GAP [ % ]
65.4¢/ $1
WAGE / INCOME GAP [ $ ]
$7,104
FAMILY INCOME DEFICIT
0.47
INEQUALITY / GINI INDEX
6,790
TOTAL POPULATION
3,337
MALE POPULATION
3,453
FEMALE POPULATION
96.64
MALES / 100 FEMALES
103.48
FEMALES / 100 MALES
37.4
MEDIAN AGE
3.8
AVG FAMILY SIZE
2.8
AVG HOUSEHOLD SIZE
2,747
LABOR FORCE [ PEOPLE ]
50.8%
PERCENT IN LABOR FORCE
8.0%
UNEMPLOYMENT RATE
Income in Thermalito
Income Overview in Thermalito
Per Capita Income in Thermalito is $28,802, while median incomes of families and households are $51,509 and $48,013 respectively.
| Characteristic | Number | Measure |
| Per Capita Income | 6,790 | $28,802 |
| Median Family Income | 1,433 | $51,509 |
| Mean Family Income | 1,433 | $79,226 |
| Median Household Income | 2,381 | $48,013 |
| Mean Household Income | 2,381 | $78,264 |
| Income Deficit | 1,433 | $7,104 |
| Wage / Income Gap (%) | 6,790 | 34.58% |
| Wage / Income Gap ($) | 6,790 | 65.42¢ per $1 |
| Gini / Inequality Index | 6,790 | 0.47 |
Earnings by Sex in Thermalito
Average Earnings in Thermalito are $33,883, $40,000 for men and $26,170 for women, a difference of 34.6%.
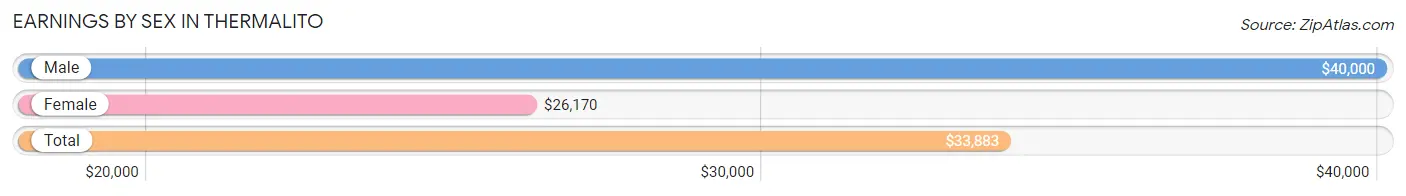
| Sex | Number | Average Earnings |
| Male | 1,628 (56.4%) | $40,000 |
| Female | 1,260 (43.6%) | $26,170 |
| Total | 2,888 (100.0%) | $33,883 |
Earnings by Sex by Income Bracket in Thermalito
The most common earnings brackets in Thermalito are $100,000+ for men (213 | 13.1%) and $25,000 to $29,999 for women (155 | 12.3%).
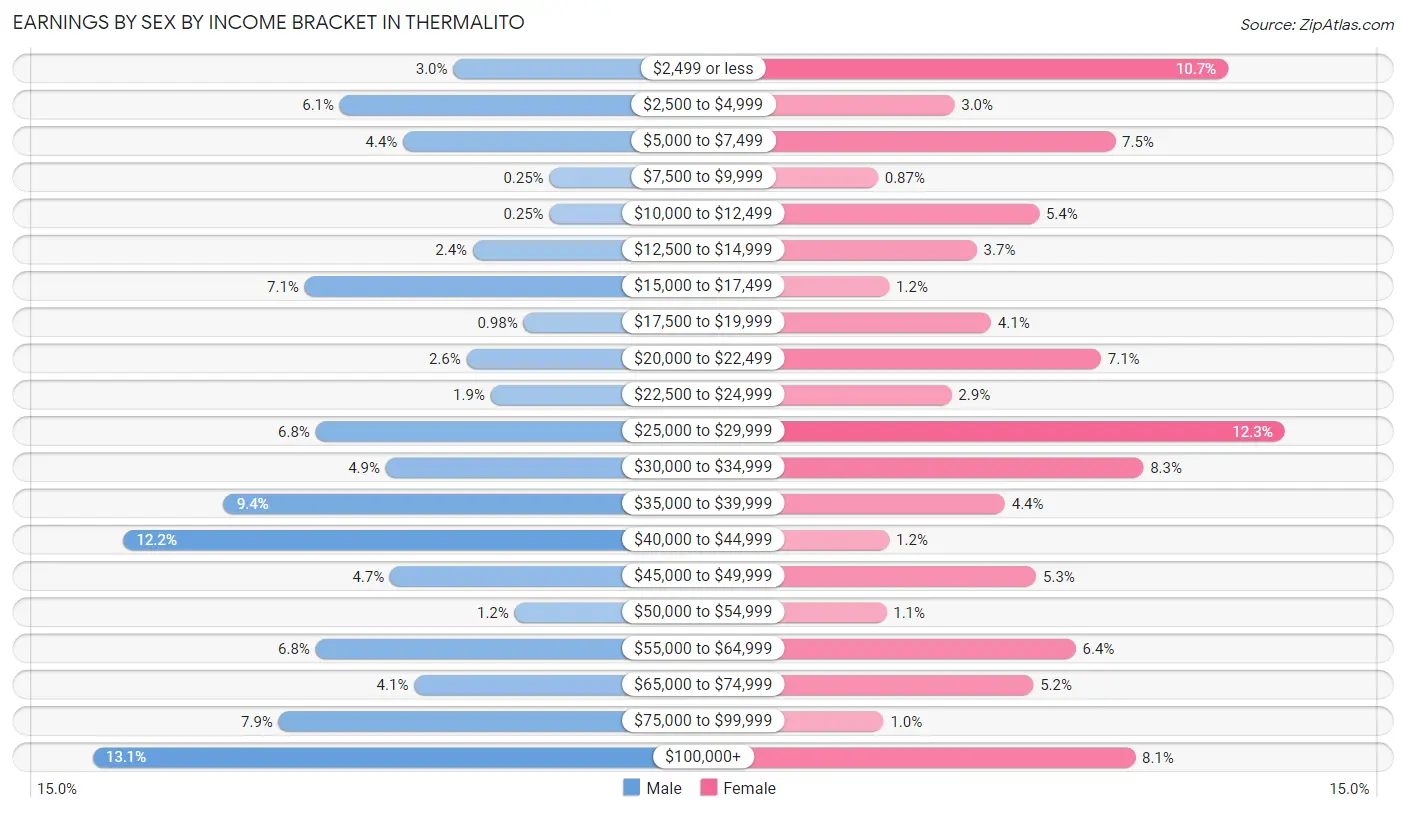
| Income | Male | Female |
| $2,499 or less | 48 (2.9%) | 135 (10.7%) |
| $2,500 to $4,999 | 100 (6.1%) | 38 (3.0%) |
| $5,000 to $7,499 | 71 (4.4%) | 95 (7.5%) |
| $7,500 to $9,999 | 4 (0.3%) | 11 (0.9%) |
| $10,000 to $12,499 | 4 (0.3%) | 68 (5.4%) |
| $12,500 to $14,999 | 39 (2.4%) | 46 (3.6%) |
| $15,000 to $17,499 | 116 (7.1%) | 15 (1.2%) |
| $17,500 to $19,999 | 16 (1.0%) | 51 (4.1%) |
| $20,000 to $22,499 | 42 (2.6%) | 90 (7.1%) |
| $22,500 to $24,999 | 31 (1.9%) | 37 (2.9%) |
| $25,000 to $29,999 | 111 (6.8%) | 155 (12.3%) |
| $30,000 to $34,999 | 79 (4.9%) | 105 (8.3%) |
| $35,000 to $39,999 | 153 (9.4%) | 56 (4.4%) |
| $40,000 to $44,999 | 199 (12.2%) | 15 (1.2%) |
| $45,000 to $49,999 | 77 (4.7%) | 67 (5.3%) |
| $50,000 to $54,999 | 20 (1.2%) | 14 (1.1%) |
| $55,000 to $64,999 | 111 (6.8%) | 81 (6.4%) |
| $65,000 to $74,999 | 66 (4.1%) | 66 (5.2%) |
| $75,000 to $99,999 | 128 (7.9%) | 13 (1.0%) |
| $100,000+ | 213 (13.1%) | 102 (8.1%) |
| Total | 1,628 (100.0%) | 1,260 (100.0%) |
Earnings by Sex by Educational Attainment in Thermalito
Average earnings in Thermalito are $43,305 for men and $28,586 for women, a difference of 34.0%. Men with an educational attainment of bachelor's degree enjoy the highest average annual earnings of $120,556, while those with less than high school education earn the least with $34,783. Women with an educational attainment of college or associate's degree earn the most with the average annual earnings of $35,000, while those with less than high school education have the smallest earnings of $18,182.
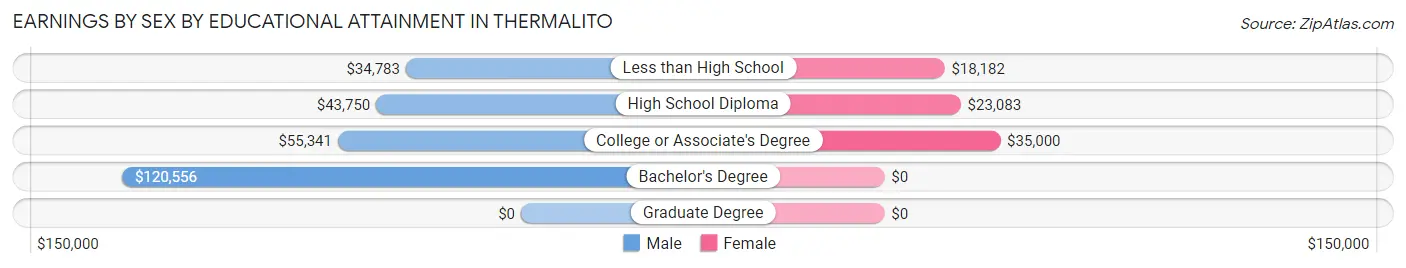
| Educational Attainment | Male Income | Female Income |
| Less than High School | $34,783 | $18,182 |
| High School Diploma | $43,750 | $23,083 |
| College or Associate's Degree | $55,341 | $35,000 |
| Bachelor's Degree | $120,556 | $0 |
| Graduate Degree | - | - |
| Total | $43,305 | $28,586 |
Family Income in Thermalito
Family Income Brackets in Thermalito
According to the Thermalito family income data, there are 322 families falling into the $35,000 to $49,999 income range, which is the most common income bracket and makes up 22.5% of all families. Conversely, the less than $10,000 income bracket is the least frequent group with only 19 families (1.3%) belonging to this category.
| Income Bracket | # Families | % Families |
| Less than $10,000 | 19 | 1.3% |
| $10,000 to $14,999 | 56 | 3.9% |
| $15,000 to $24,999 | 105 | 7.3% |
| $25,000 to $34,999 | 130 | 9.1% |
| $35,000 to $49,999 | 322 | 22.5% |
| $50,000 to $74,999 | 246 | 17.2% |
| $75,000 to $99,999 | 128 | 8.9% |
| $100,000 to $149,999 | 201 | 14.0% |
| $150,000 to $199,999 | 163 | 11.4% |
| $200,000+ | 64 | 4.5% |
Family Income by Famaliy Size in Thermalito
3-person families (312 | 21.8%) account for the highest median family income in Thermalito with $51,771 per family, while 2-person families (589 | 41.1%) have the highest median income of $24,610 per family member.
| Income Bracket | # Families | Median Income |
| 2-Person Families | 589 (41.1%) | $49,219 |
| 3-Person Families | 312 (21.8%) | $51,771 |
| 4-Person Families | 301 (21.0%) | $0 |
| 5-Person Families | 117 (8.2%) | $0 |
| 6-Person Families | 39 (2.7%) | $0 |
| 7+ Person Families | 75 (5.2%) | $51,494 |
| Total | 1,433 (100.0%) | $51,509 |
Family Income by Number of Earners in Thermalito
The median family income in Thermalito is $51,509, with families comprising 3+ earners (197) having the highest median family income of $190,031, while families with no earners (389) have the lowest median family income of $36,394, accounting for 13.8% and 27.2% of families, respectively.
| Number of Earners | # Families | Median Income |
| No Earners | 389 (27.2%) | $36,394 |
| 1 Earner | 450 (31.4%) | $83,864 |
| 2 Earners | 397 (27.7%) | $60,272 |
| 3+ Earners | 197 (13.8%) | $190,031 |
| Total | 1,433 (100.0%) | $51,509 |
Household Income in Thermalito
Household Income Brackets in Thermalito
With 490 households falling in the category, the $35,000 to $49,999 income range is the most frequent in Thermalito, accounting for 20.6% of all households. In contrast, only 43 households (1.8%) fall into the less than $10,000 income bracket, making it the least populous group.
| Income Bracket | # Households | % Households |
| Less than $10,000 | 43 | 1.8% |
| $10,000 to $14,999 | 57 | 2.4% |
| $15,000 to $24,999 | 324 | 13.6% |
| $25,000 to $34,999 | 321 | 13.5% |
| $35,000 to $49,999 | 490 | 20.6% |
| $50,000 to $74,999 | 386 | 16.2% |
| $75,000 to $99,999 | 155 | 6.5% |
| $100,000 to $149,999 | 281 | 11.8% |
| $150,000 to $199,999 | 176 | 7.4% |
| $200,000+ | 145 | 6.1% |
Household Income by Householder Age in Thermalito
The median household income in Thermalito is $48,013, with the highest median household income of $52,331 found in the 25 to 44 years age bracket for the primary householder. A total of 600 households (25.2%) fall into this category. Meanwhile, the 15 to 24 years age bracket for the primary householder has the lowest median household income of $0, with 130 households (5.5%) in this group.
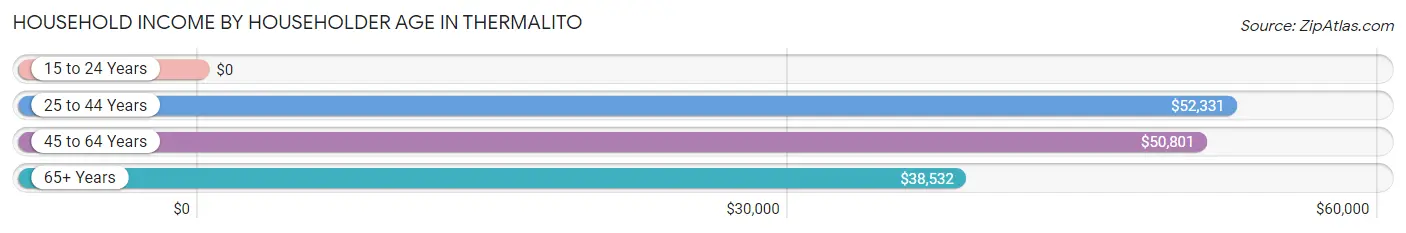
| Income Bracket | # Households | Median Income |
| 15 to 24 Years | 130 (5.5%) | $0 |
| 25 to 44 Years | 600 (25.2%) | $52,331 |
| 45 to 64 Years | 883 (37.1%) | $50,801 |
| 65+ Years | 768 (32.3%) | $38,532 |
| Total | 2,381 (100.0%) | $48,013 |
Poverty in Thermalito
Income Below Poverty by Sex and Age in Thermalito
With 19.8% poverty level for males and 24.5% for females among the residents of Thermalito, under 5 year old males and 5 year old females are the most vulnerable to poverty, with 102 males (54.5%) and 35 females (68.6%) in their respective age groups living below the poverty level.
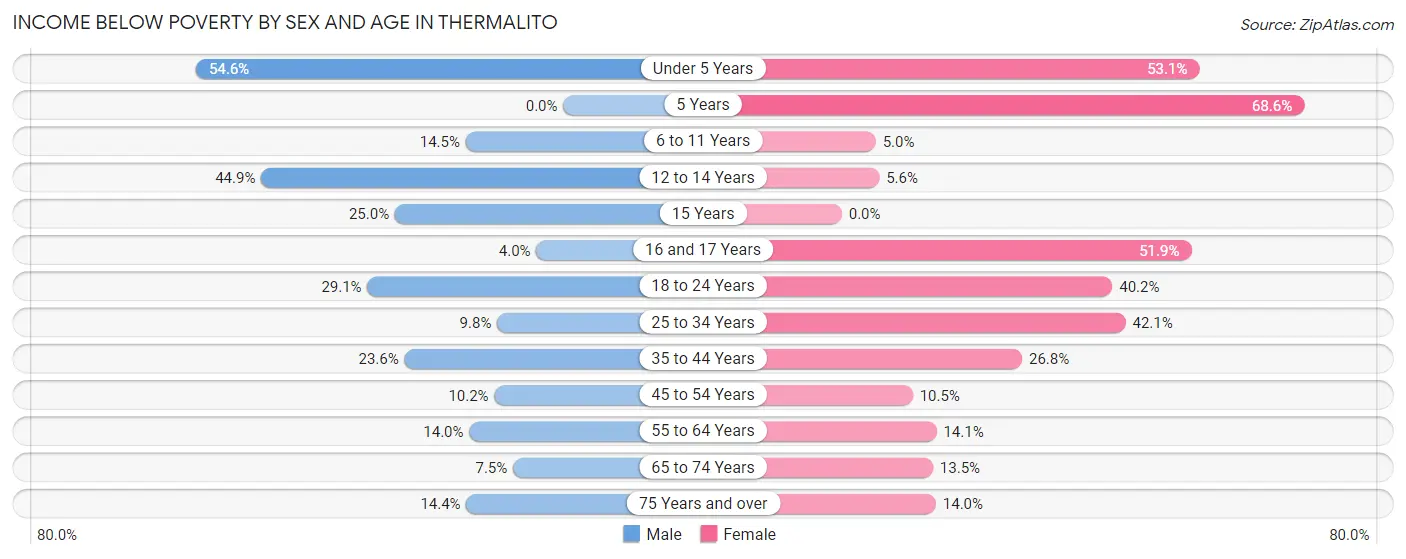
| Age Bracket | Male | Female |
| Under 5 Years | 102 (54.5%) | 147 (53.1%) |
| 5 Years | 0 (0.0%) | 35 (68.6%) |
| 6 to 11 Years | 10 (14.5%) | 19 (5.0%) |
| 12 to 14 Years | 96 (44.9%) | 6 (5.6%) |
| 15 Years | 15 (25.0%) | 0 (0.0%) |
| 16 and 17 Years | 6 (4.0%) | 69 (51.9%) |
| 18 to 24 Years | 144 (29.1%) | 186 (40.2%) |
| 25 to 34 Years | 32 (9.8%) | 99 (42.1%) |
| 35 to 44 Years | 79 (23.6%) | 102 (26.8%) |
| 45 to 54 Years | 48 (10.2%) | 34 (10.5%) |
| 55 to 64 Years | 73 (14.0%) | 61 (14.1%) |
| 65 to 74 Years | 17 (7.5%) | 51 (13.5%) |
| 75 Years and over | 38 (14.4%) | 38 (14.0%) |
| Total | 660 (19.8%) | 847 (24.5%) |
Income Above Poverty by Sex and Age in Thermalito
According to the poverty statistics in Thermalito, males aged 5 years and females aged 15 years are the age groups that are most secure financially, with 100.0% of males and 100.0% of females in these age groups living above the poverty line.
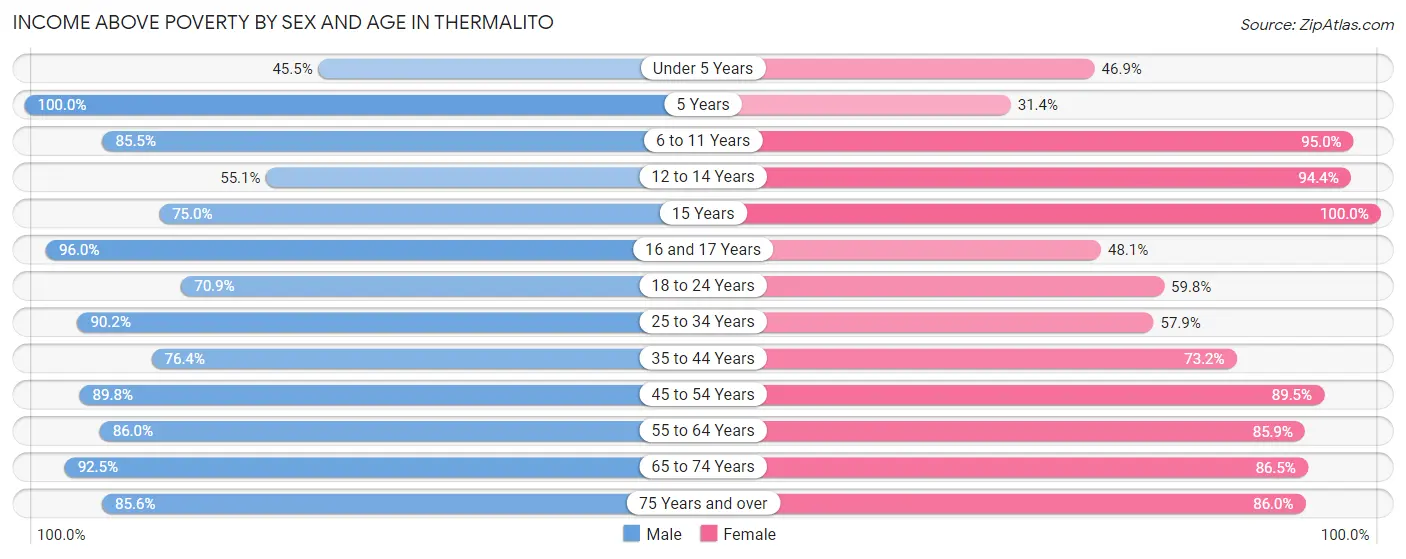
| Age Bracket | Male | Female |
| Under 5 Years | 85 (45.5%) | 130 (46.9%) |
| 5 Years | 17 (100.0%) | 16 (31.4%) |
| 6 to 11 Years | 59 (85.5%) | 358 (95.0%) |
| 12 to 14 Years | 118 (55.1%) | 102 (94.4%) |
| 15 Years | 45 (75.0%) | 22 (100.0%) |
| 16 and 17 Years | 144 (96.0%) | 64 (48.1%) |
| 18 to 24 Years | 351 (70.9%) | 277 (59.8%) |
| 25 to 34 Years | 294 (90.2%) | 136 (57.9%) |
| 35 to 44 Years | 256 (76.4%) | 279 (73.2%) |
| 45 to 54 Years | 421 (89.8%) | 289 (89.5%) |
| 55 to 64 Years | 450 (86.0%) | 373 (85.9%) |
| 65 to 74 Years | 211 (92.5%) | 326 (86.5%) |
| 75 Years and over | 226 (85.6%) | 234 (86.0%) |
| Total | 2,677 (80.2%) | 2,606 (75.5%) |
Income Below Poverty Among Married-Couple Families in Thermalito
The poverty statistics for married-couple families in Thermalito show that 10.2% or 103 of the total 1,006 families live below the poverty line. Families with 3 or 4 children have the highest poverty rate of 49.0%, comprising of 49 families. On the other hand, families with 1 or 2 children have the lowest poverty rate of 3.5%, which includes 8 families.
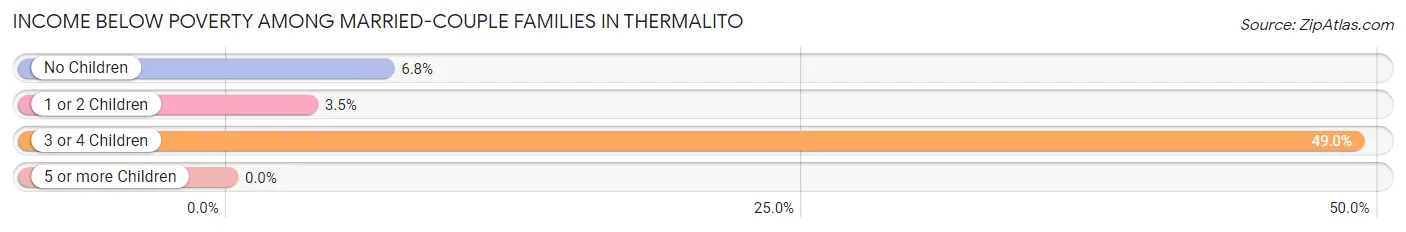
| Children | Above Poverty | Below Poverty |
| No Children | 630 (93.2%) | 46 (6.8%) |
| 1 or 2 Children | 222 (96.5%) | 8 (3.5%) |
| 3 or 4 Children | 51 (51.0%) | 49 (49.0%) |
| 5 or more Children | 0 (0.0%) | 0 (0.0%) |
| Total | 903 (89.8%) | 103 (10.2%) |
Income Below Poverty Among Single-Parent Households in Thermalito
According to the poverty data in Thermalito, 19.7% or 35 single-father households and 34.1% or 85 single-mother households are living below the poverty line. Among single-father households, those with 5 or more children have the highest poverty rate, with 5 households (62.5%) experiencing poverty. Likewise, among single-mother households, those with 3 or 4 children have the highest poverty rate, with 47 households (45.2%) falling below the poverty line.
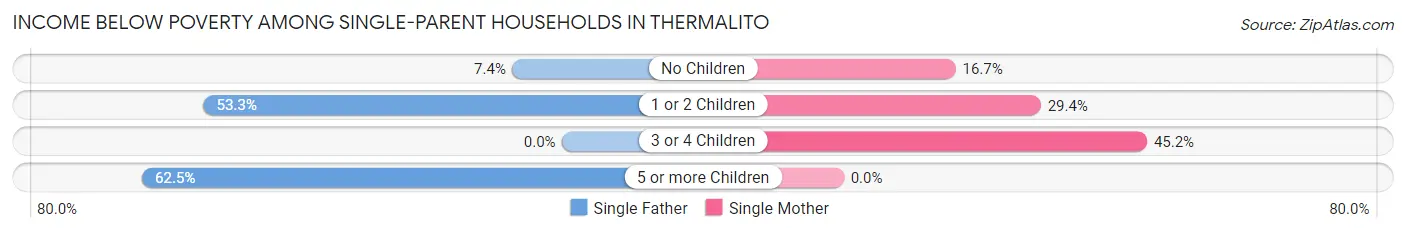
| Children | Single Father | Single Mother |
| No Children | 6 (7.4%) | 6 (16.7%) |
| 1 or 2 Children | 24 (53.3%) | 32 (29.4%) |
| 3 or 4 Children | 0 (0.0%) | 47 (45.2%) |
| 5 or more Children | 5 (62.5%) | 0 (0.0%) |
| Total | 35 (19.7%) | 85 (34.1%) |
Income Below Poverty Among Married-Couple vs Single-Parent Households in Thermalito
The poverty data for Thermalito shows that 103 of the married-couple family households (10.2%) and 120 of the single-parent households (28.1%) are living below the poverty level. Within the married-couple family households, those with 3 or 4 children have the highest poverty rate, with 49 households (49.0%) falling below the poverty line. Among the single-parent households, those with 5 or more children have the highest poverty rate, with 5 household (62.5%) living below poverty.
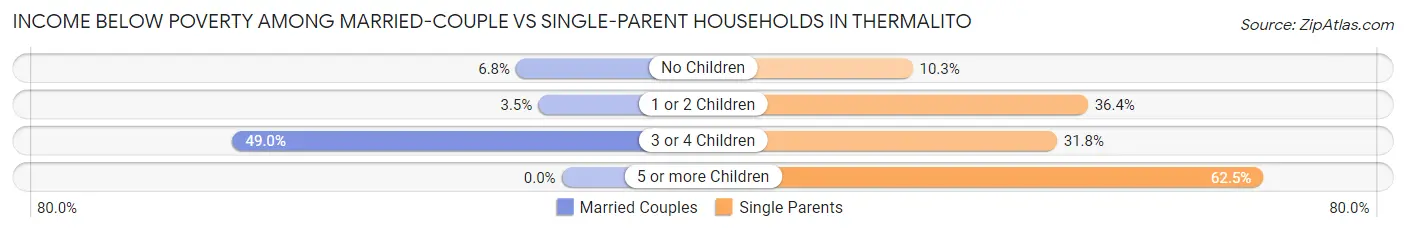
| Children | Married-Couple Families | Single-Parent Households |
| No Children | 46 (6.8%) | 12 (10.3%) |
| 1 or 2 Children | 8 (3.5%) | 56 (36.4%) |
| 3 or 4 Children | 49 (49.0%) | 47 (31.8%) |
| 5 or more Children | 0 (0.0%) | 5 (62.5%) |
| Total | 103 (10.2%) | 120 (28.1%) |
Race in Thermalito
The most populous races in Thermalito are White / Caucasian (4,556 | 67.1%), Asian (1,317 | 19.4%), and Hispanic or Latino (1,219 | 17.9%).
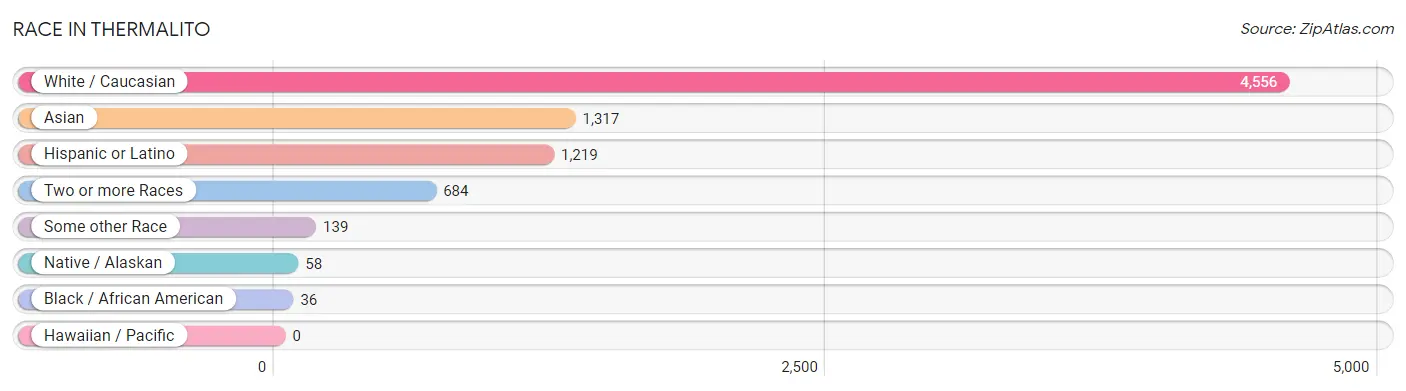
| Race | # Population | % Population |
| Asian | 1,317 | 19.4% |
| Black / African American | 36 | 0.5% |
| Hawaiian / Pacific | 0 | 0.0% |
| Hispanic or Latino | 1,219 | 17.9% |
| Native / Alaskan | 58 | 0.9% |
| White / Caucasian | 4,556 | 67.1% |
| Two or more Races | 684 | 10.1% |
| Some other Race | 139 | 2.1% |
| Total | 6,790 | 100.0% |
Ancestry in Thermalito
The most populous ancestries reported in Thermalito are Bangladeshi (1,119 | 16.5%), Mexican (1,049 | 15.4%), Irish (1,012 | 14.9%), American (951 | 14.0%), and German (744 | 11.0%), together accounting for 71.8% of all Thermalito residents.
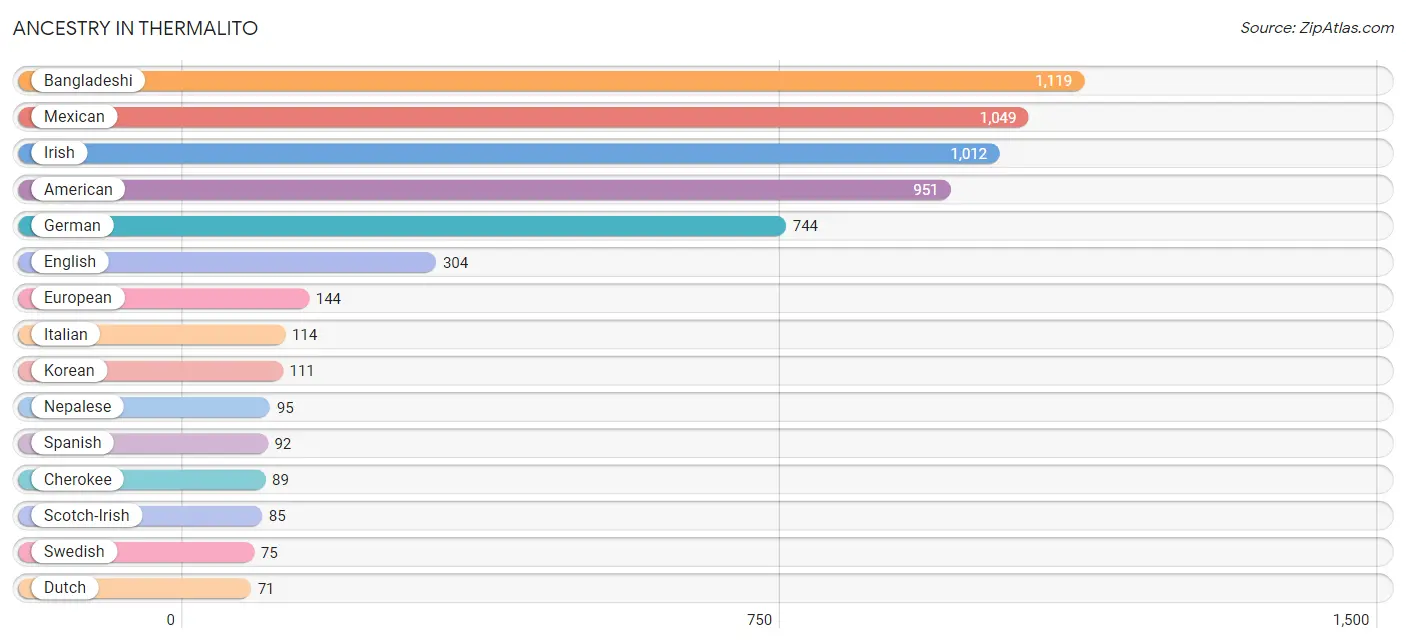
| Ancestry | # Population | % Population |
| Albanian | 6 | 0.1% |
| American | 951 | 14.0% |
| Bangladeshi | 1,119 | 16.5% |
| Bhutanese | 9 | 0.1% |
| Blackfeet | 48 | 0.7% |
| British | 24 | 0.4% |
| Burmese | 4 | 0.1% |
| Canadian | 7 | 0.1% |
| Cherokee | 89 | 1.3% |
| Creek | 7 | 0.1% |
| Croatian | 61 | 0.9% |
| Czech | 23 | 0.3% |
| Czechoslovakian | 7 | 0.1% |
| Danish | 19 | 0.3% |
| Dutch | 71 | 1.1% |
| Eastern European | 6 | 0.1% |
| English | 304 | 4.5% |
| European | 144 | 2.1% |
| French | 32 | 0.5% |
| German | 744 | 11.0% |
| German Russian | 26 | 0.4% |
| Greek | 26 | 0.4% |
| Indian (Asian) | 10 | 0.2% |
| Irish | 1,012 | 14.9% |
| Italian | 114 | 1.7% |
| Korean | 111 | 1.6% |
| Lithuanian | 7 | 0.1% |
| Malaysian | 1 | 0.0% |
| Mexican | 1,049 | 15.4% |
| Mexican American Indian | 19 | 0.3% |
| Nepalese | 95 | 1.4% |
| Norwegian | 38 | 0.6% |
| Pakistani | 30 | 0.4% |
| Polish | 20 | 0.3% |
| Portuguese | 26 | 0.4% |
| Puerto Rican | 28 | 0.4% |
| Samoan | 4 | 0.1% |
| Scandinavian | 41 | 0.6% |
| Scotch-Irish | 85 | 1.3% |
| Scottish | 52 | 0.8% |
| Spaniard | 42 | 0.6% |
| Spanish | 92 | 1.3% |
| Sri Lankan | 10 | 0.2% |
| Swedish | 75 | 1.1% |
| Swiss | 3 | 0.0% |
| Thai | 3 | 0.0% |
| Welsh | 54 | 0.8% |
| Yaqui | 55 | 0.8% | View All 48 Rows |
Immigrants in Thermalito
The most numerous immigrant groups reported in Thermalito came from Asia (374 | 5.5%), South Eastern Asia (370 | 5.4%), Latin America (331 | 4.9%), Central America (301 | 4.4%), and Mexico (272 | 4.0%), together accounting for 24.3% of all Thermalito residents.
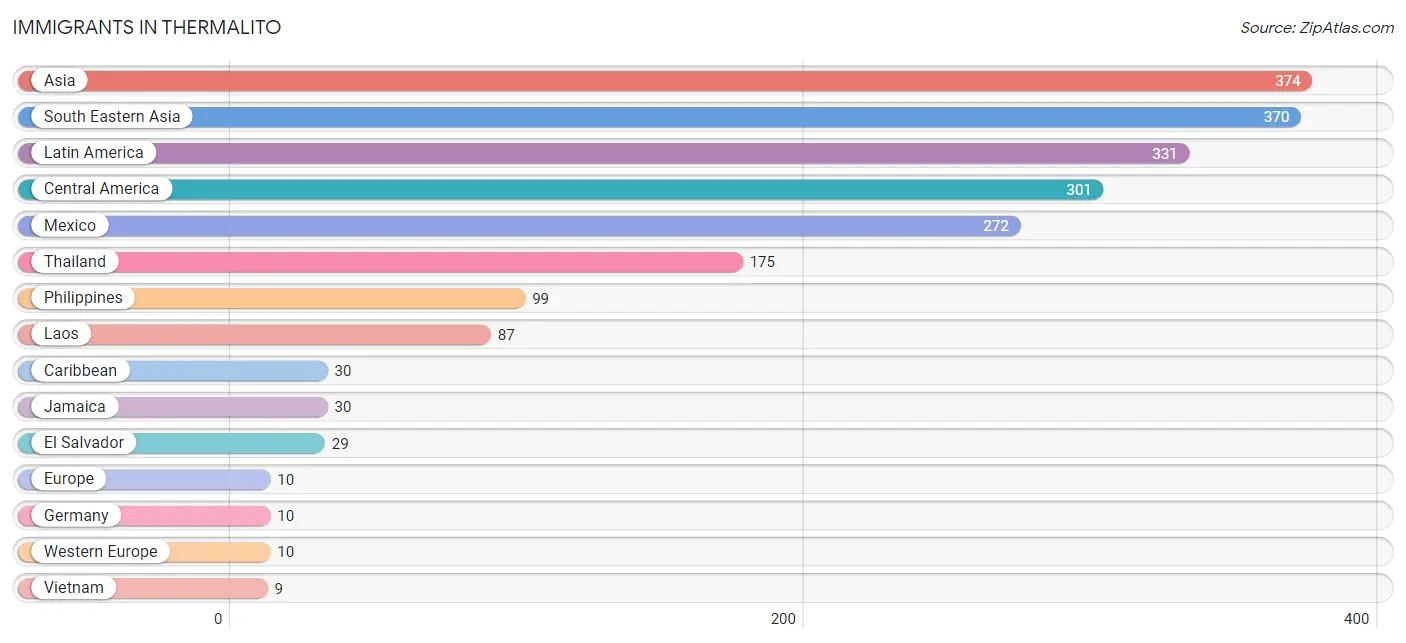
| Immigration Origin | # Population | % Population |
| Asia | 374 | 5.5% |
| Canada | 1 | 0.0% |
| Caribbean | 30 | 0.4% |
| Central America | 301 | 4.4% |
| Eastern Asia | 4 | 0.1% |
| El Salvador | 29 | 0.4% |
| Europe | 10 | 0.2% |
| Germany | 10 | 0.2% |
| Jamaica | 30 | 0.4% |
| Korea | 4 | 0.1% |
| Laos | 87 | 1.3% |
| Latin America | 331 | 4.9% |
| Mexico | 272 | 4.0% |
| Philippines | 99 | 1.5% |
| South Eastern Asia | 370 | 5.4% |
| Thailand | 175 | 2.6% |
| Vietnam | 9 | 0.1% |
| Western Europe | 10 | 0.2% | View All 18 Rows |
Sex and Age in Thermalito
Sex and Age in Thermalito
The most populous age groups in Thermalito are 15 to 19 Years (390 | 11.7%) for men and 20 to 24 Years (387 | 11.2%) for women.
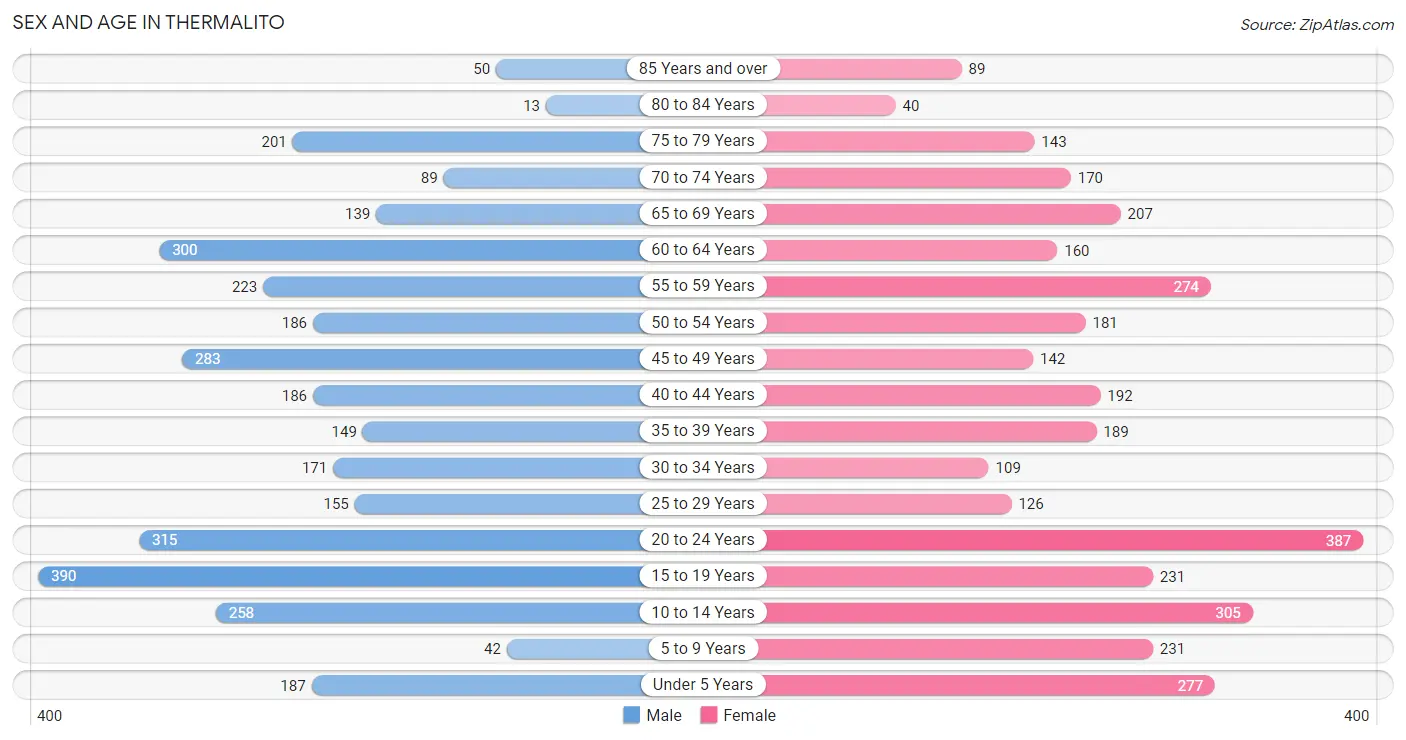
| Age Bracket | Male | Female |
| Under 5 Years | 187 (5.6%) | 277 (8.0%) |
| 5 to 9 Years | 42 (1.3%) | 231 (6.7%) |
| 10 to 14 Years | 258 (7.7%) | 305 (8.8%) |
| 15 to 19 Years | 390 (11.7%) | 231 (6.7%) |
| 20 to 24 Years | 315 (9.4%) | 387 (11.2%) |
| 25 to 29 Years | 155 (4.6%) | 126 (3.6%) |
| 30 to 34 Years | 171 (5.1%) | 109 (3.2%) |
| 35 to 39 Years | 149 (4.5%) | 189 (5.5%) |
| 40 to 44 Years | 186 (5.6%) | 192 (5.6%) |
| 45 to 49 Years | 283 (8.5%) | 142 (4.1%) |
| 50 to 54 Years | 186 (5.6%) | 181 (5.2%) |
| 55 to 59 Years | 223 (6.7%) | 274 (7.9%) |
| 60 to 64 Years | 300 (9.0%) | 160 (4.6%) |
| 65 to 69 Years | 139 (4.2%) | 207 (6.0%) |
| 70 to 74 Years | 89 (2.7%) | 170 (4.9%) |
| 75 to 79 Years | 201 (6.0%) | 143 (4.1%) |
| 80 to 84 Years | 13 (0.4%) | 40 (1.2%) |
| 85 Years and over | 50 (1.5%) | 89 (2.6%) |
| Total | 3,337 (100.0%) | 3,453 (100.0%) |
Families and Households in Thermalito
Median Family Size in Thermalito
The median family size in Thermalito is 3.75 persons per family, with single female/mother families (249 | 17.4%) accounting for the largest median family size of 4.27 persons per family. On the other hand, single male/father families (178 | 12.4%) represent the smallest median family size with 3.37 persons per family.
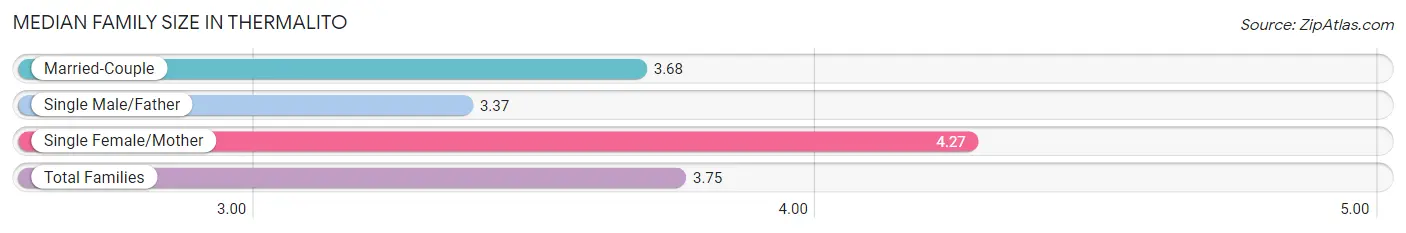
| Family Type | # Families | Family Size |
| Married-Couple | 1,006 (70.2%) | 3.68 |
| Single Male/Father | 178 (12.4%) | 3.37 |
| Single Female/Mother | 249 (17.4%) | 4.27 |
| Total Families | 1,433 (100.0%) | 3.75 |
Median Household Size in Thermalito
The median household size in Thermalito is 2.84 persons per household, with single female/mother households (249 | 10.5%) accounting for the largest median household size of 4.79 persons per household. non-family households (948 | 39.8%) represent the smallest median household size with 1.23 persons per household.
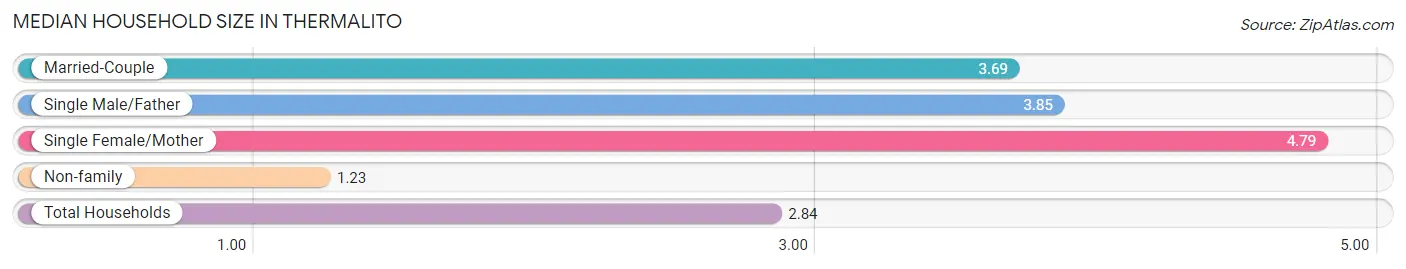
| Household Type | # Households | Household Size |
| Married-Couple | 1,006 (42.2%) | 3.69 |
| Single Male/Father | 178 (7.5%) | 3.85 |
| Single Female/Mother | 249 (10.5%) | 4.79 |
| Non-family | 948 (39.8%) | 1.23 |
| Total Households | 2,381 (100.0%) | 2.84 |
Household Size by Marriage Status in Thermalito
Out of a total of 2,381 households in Thermalito, 1,433 (60.2%) are family households, while 948 (39.8%) are nonfamily households. The most numerous type of family households are 2-person households, comprising 527, and the most common type of nonfamily households are 1-person households, comprising 781.
| Household Size | Family Households | Nonfamily Households |
| 1-Person Households | - | 781 (32.8%) |
| 2-Person Households | 527 (22.1%) | 146 (6.1%) |
| 3-Person Households | 293 (12.3%) | 21 (0.9%) |
| 4-Person Households | 313 (13.2%) | 0 (0.0%) |
| 5-Person Households | 170 (7.1%) | 0 (0.0%) |
| 6-Person Households | 55 (2.3%) | 0 (0.0%) |
| 7+ Person Households | 75 (3.2%) | 0 (0.0%) |
| Total | 1,433 (60.2%) | 948 (39.8%) |
Female Fertility in Thermalito
Fertility by Age in Thermalito
Average fertility rate in Thermalito is 33.0 births per 1,000 women. Women in the age bracket of 20 to 34 years have the highest fertility rate with 76.0 births per 1,000 women. Women in the age bracket of 20 to 34 years acount for 100.0% of all women with births.
| Age Bracket | Women with Births | Births / 1,000 Women |
| 15 to 19 years | 0 (0.0%) | 0.0 |
| 20 to 34 years | 47 (100.0%) | 76.0 |
| 35 to 50 years | 0 (0.0%) | 0.0 |
| Total | 47 (100.0%) | 33.0 |
Fertility by Age by Marriage Status in Thermalito
42.6% of women with births (47) in Thermalito are married. The highest percentage of unmarried women with births falls into 20 to 34 years age bracket with 57.5% of them unmarried at the time of birth, while the lowest percentage of unmarried women with births belong to 20 to 34 years age bracket with 57.5% of them unmarried.
| Age Bracket | Married | Unmarried |
| 15 to 19 years | 0 (0.0%) | 0 (0.0%) |
| 20 to 34 years | 20 (42.5%) | 27 (57.5%) |
| 35 to 50 years | 0 (0.0%) | 0 (0.0%) |
| Total | 20 (42.5%) | 27 (57.5%) |
Fertility by Education in Thermalito
| Educational Attainment | Women with Births | Births / 1,000 Women |
| Less than High School | 0 (0.0%) | 0.0 |
| High School Diploma | 20 (42.5%) | 39.0 |
| College or Associate's Degree | 27 (57.5%) | 57.0 |
| Bachelor's Degree | 0 (0.0%) | 0.0 |
| Graduate Degree | 0 (0.0%) | 0.0 |
| Total | 47 (100.0%) | 33.0 |
Fertility by Education by Marriage Status in Thermalito
57.5% of women with births in Thermalito are unmarried. Women with the educational attainment of high school diploma are most likely to be married with 100.0% of them married at childbirth, while women with the educational attainment of college or associate's degree are least likely to be married with 100.0% of them unmarried at childbirth.
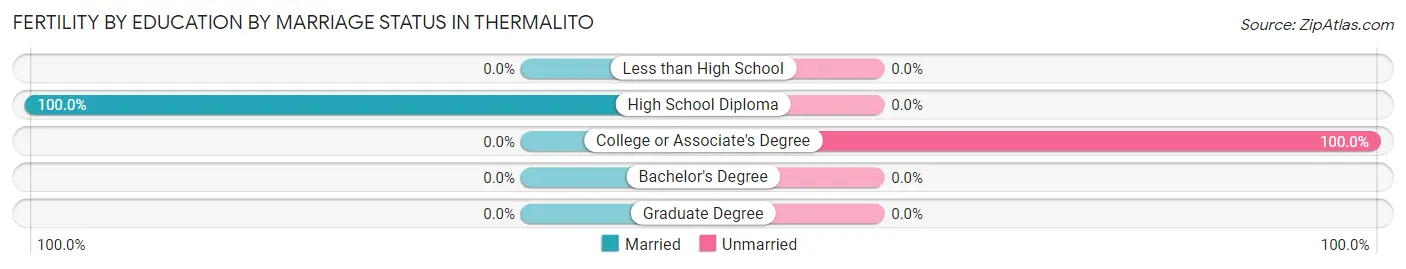
| Educational Attainment | Married | Unmarried |
| Less than High School | 0 (0.0%) | 0 (0.0%) |
| High School Diploma | 20 (100.0%) | 0 (0.0%) |
| College or Associate's Degree | 0 (0.0%) | 27 (100.0%) |
| Bachelor's Degree | 0 (0.0%) | 0 (0.0%) |
| Graduate Degree | 0 (0.0%) | 0 (0.0%) |
| Total | 20 (42.5%) | 27 (57.5%) |
Employment Characteristics in Thermalito
Employment by Class of Employer in Thermalito
Among the 2,423 employed individuals in Thermalito, private company employees (1,673 | 69.1%), not-for-profit organizations (306 | 12.6%), and local government employees (206 | 8.5%) make up the most common classes of employment.
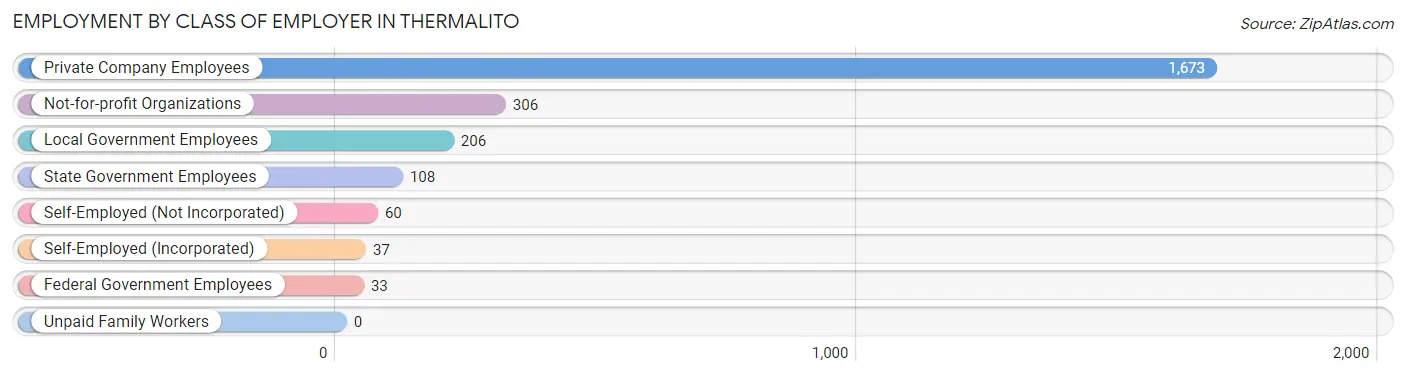
| Employer Class | # Employees | % Employees |
| Private Company Employees | 1,673 | 69.1% |
| Self-Employed (Incorporated) | 37 | 1.5% |
| Self-Employed (Not Incorporated) | 60 | 2.5% |
| Not-for-profit Organizations | 306 | 12.6% |
| Local Government Employees | 206 | 8.5% |
| State Government Employees | 108 | 4.5% |
| Federal Government Employees | 33 | 1.4% |
| Unpaid Family Workers | 0 | 0.0% |
| Total | 2,423 | 100.0% |
Employment Status by Age in Thermalito
According to the labor force statistics for Thermalito, out of the total population over 16 years of age (5,408), 50.8% or 2,747 individuals are in the labor force, with 8.0% or 220 of them unemployed. The age group with the highest labor force participation rate is 35 to 44 years, with 93.2% or 667 individuals in the labor force. Within the labor force, the 60 to 64 years age range has the highest percentage of unemployed individuals, with 30.7% or 47 of them being unemployed.
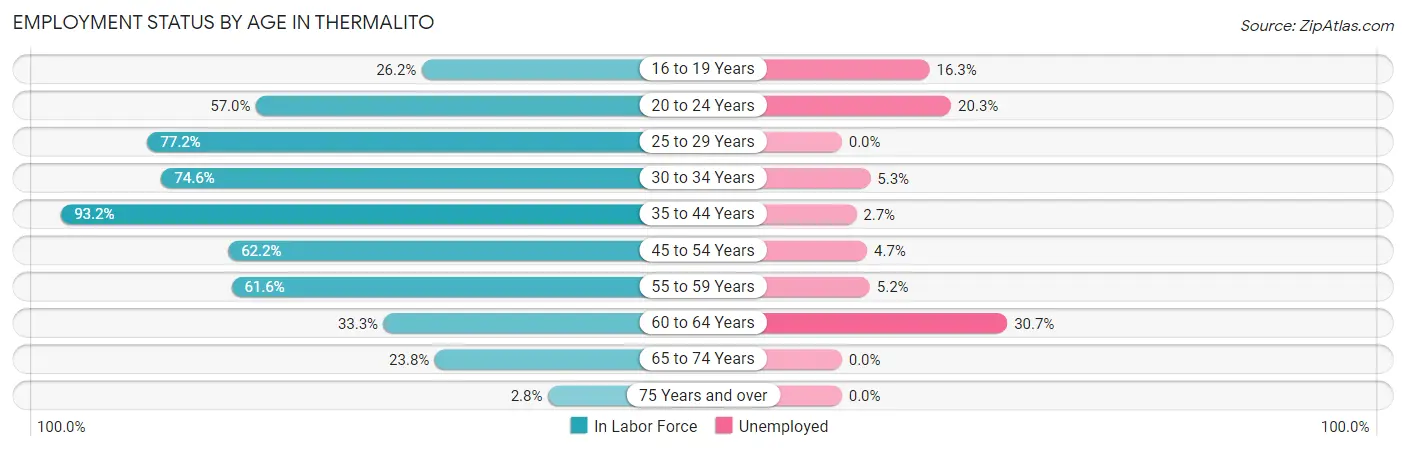
| Age Bracket | In Labor Force | Unemployed |
| 16 to 19 Years | 141 (26.2%) | 23 (16.3%) |
| 20 to 24 Years | 400 (57.0%) | 81 (20.3%) |
| 25 to 29 Years | 217 (77.2%) | 0 (0.0%) |
| 30 to 34 Years | 209 (74.6%) | 11 (5.3%) |
| 35 to 44 Years | 667 (93.2%) | 18 (2.7%) |
| 45 to 54 Years | 493 (62.2%) | 23 (4.7%) |
| 55 to 59 Years | 306 (61.6%) | 16 (5.2%) |
| 60 to 64 Years | 153 (33.3%) | 47 (30.7%) |
| 65 to 74 Years | 144 (23.8%) | 0 (0.0%) |
| 75 Years and over | 15 (2.8%) | 0 (0.0%) |
| Total | 2,747 (50.8%) | 220 (8.0%) |
Employment Status by Educational Attainment in Thermalito
According to labor force statistics for Thermalito, 67.6% of individuals (2,046) out of the total population between 25 and 64 years of age (3,026) are in the labor force, with 5.6% or 115 of them being unemployed. The group with the highest labor force participation rate are those with the educational attainment of bachelor's degree or higher, with 86.0% or 245 individuals in the labor force. Within the labor force, individuals with less than high school education have the highest percentage of unemployment, with 16.3% or 50 of them being unemployed.
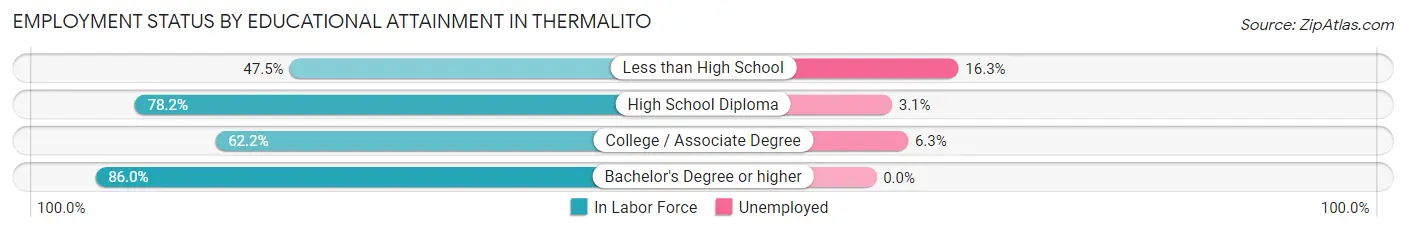
| Educational Attainment | In Labor Force | Unemployed |
| Less than High School | 306 (47.5%) | 105 (16.3%) |
| High School Diploma | 926 (78.2%) | 37 (3.1%) |
| College / Associate Degree | 568 (62.2%) | 58 (6.3%) |
| Bachelor's Degree or higher | 245 (86.0%) | 0 (0.0%) |
| Total | 2,046 (67.6%) | 169 (5.6%) |
Employment Occupations by Sex in Thermalito
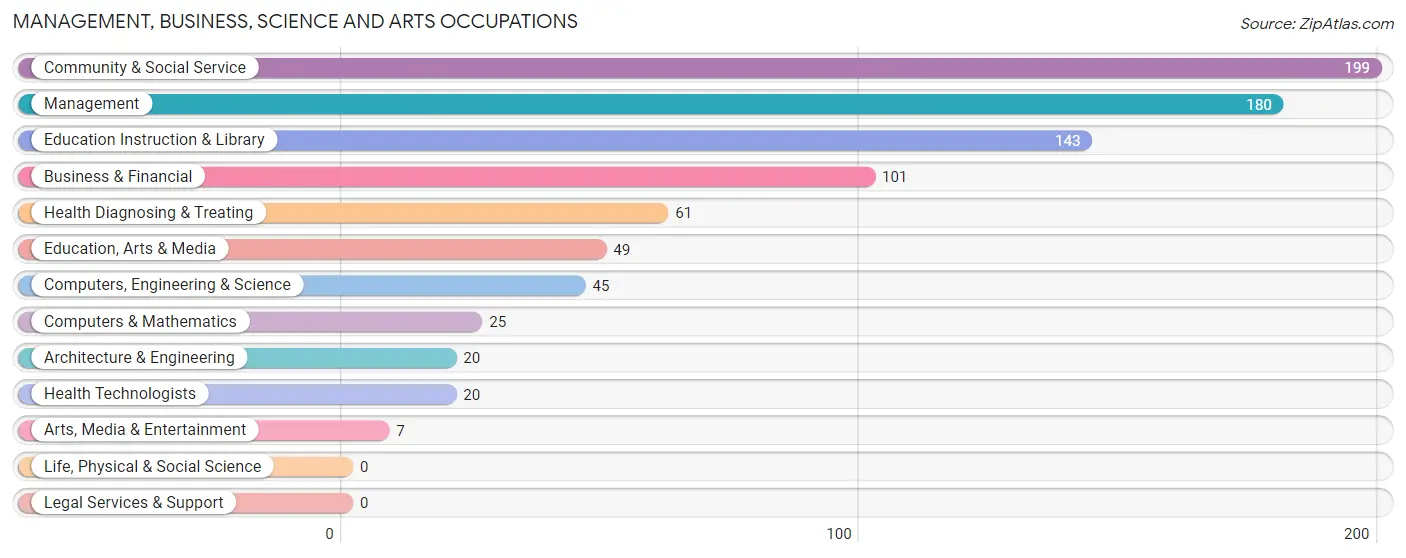
Management, Business, Science and Arts Occupations
The most common Management, Business, Science and Arts occupations in Thermalito are Community & Social Service (199 | 7.9%), Management (180 | 7.1%), Education Instruction & Library (143 | 5.7%), Business & Financial (101 | 4.0%), and Health Diagnosing & Treating (61 | 2.4%).
Management, Business, Science and Arts Occupations by Sex
Within the Management, Business, Science and Arts occupations in Thermalito, the most male-oriented occupations are Computers & Mathematics (100.0%), Arts, Media & Entertainment (100.0%), and Management (57.8%), while the most female-oriented occupations are Architecture & Engineering (100.0%), Health Diagnosing & Treating (95.1%), and Education Instruction & Library (93.0%).
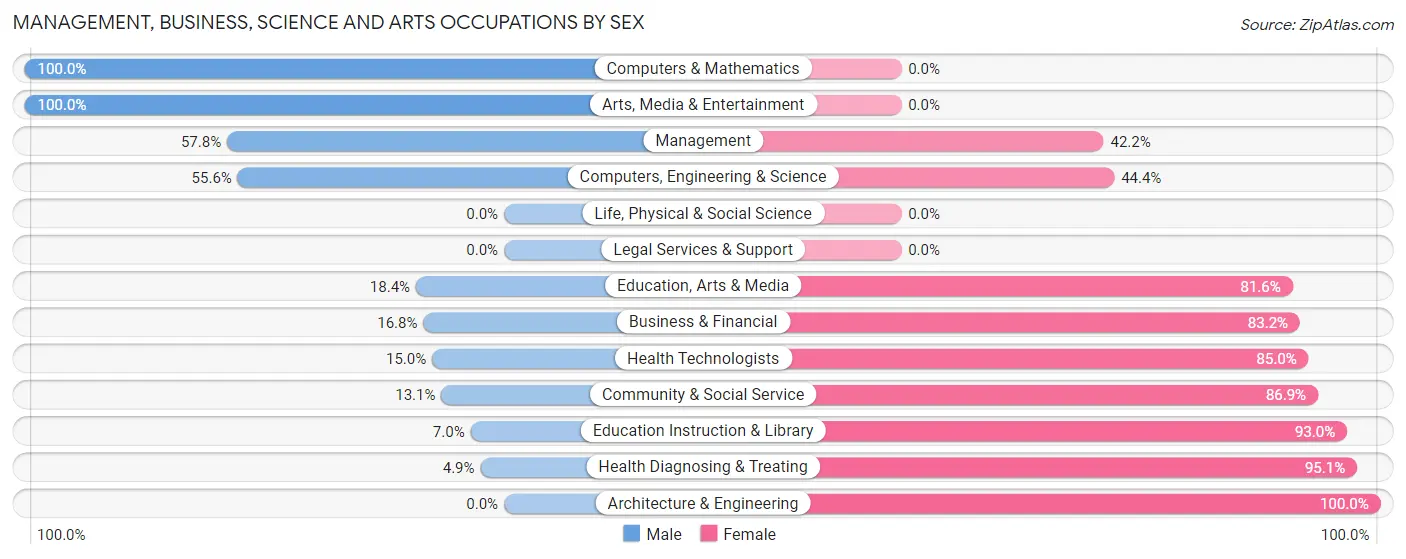
| Occupation | Male | Female |
| Management | 104 (57.8%) | 76 (42.2%) |
| Business & Financial | 17 (16.8%) | 84 (83.2%) |
| Computers, Engineering & Science | 25 (55.6%) | 20 (44.4%) |
| Computers & Mathematics | 25 (100.0%) | 0 (0.0%) |
| Architecture & Engineering | 0 (0.0%) | 20 (100.0%) |
| Life, Physical & Social Science | 0 (0.0%) | 0 (0.0%) |
| Community & Social Service | 26 (13.1%) | 173 (86.9%) |
| Education, Arts & Media | 9 (18.4%) | 40 (81.6%) |
| Legal Services & Support | 0 (0.0%) | 0 (0.0%) |
| Education Instruction & Library | 10 (7.0%) | 133 (93.0%) |
| Arts, Media & Entertainment | 7 (100.0%) | 0 (0.0%) |
| Health Diagnosing & Treating | 3 (4.9%) | 58 (95.1%) |
| Health Technologists | 3 (15.0%) | 17 (85.0%) |
| Total (Category) | 175 (29.9%) | 411 (70.1%) |
| Total (Overall) | 1,323 (52.4%) | 1,203 (47.6%) |
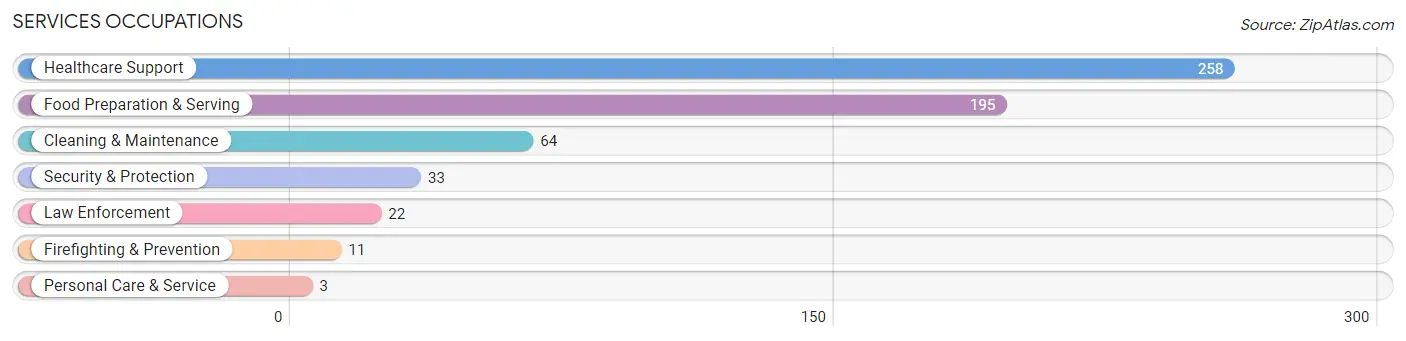
Services Occupations
The most common Services occupations in Thermalito are Healthcare Support (258 | 10.2%), Food Preparation & Serving (195 | 7.7%), Cleaning & Maintenance (64 | 2.5%), Security & Protection (33 | 1.3%), and Law Enforcement (22 | 0.9%).
Services Occupations by Sex
Within the Services occupations in Thermalito, the most male-oriented occupations are Law Enforcement (100.0%), Cleaning & Maintenance (70.3%), and Security & Protection (66.7%), while the most female-oriented occupations are Firefighting & Prevention (100.0%), Personal Care & Service (100.0%), and Healthcare Support (86.4%).
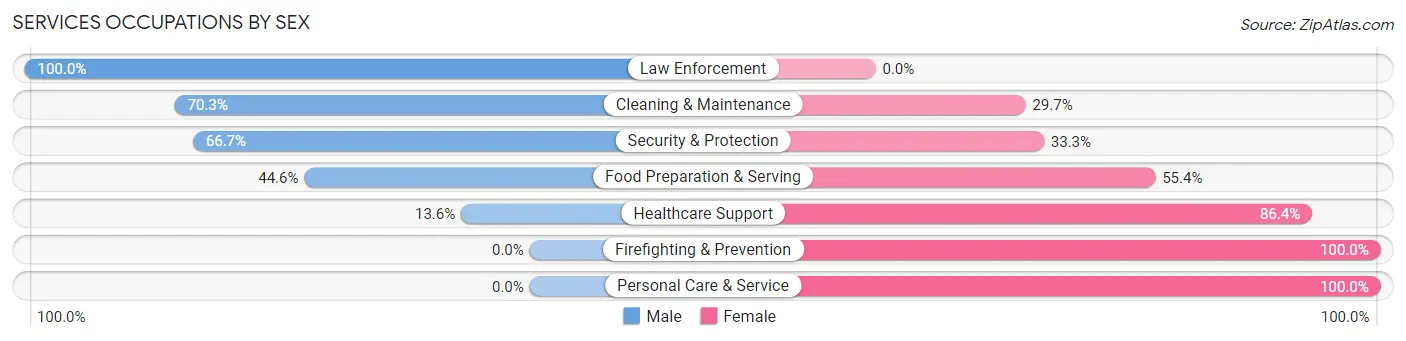
| Occupation | Male | Female |
| Healthcare Support | 35 (13.6%) | 223 (86.4%) |
| Security & Protection | 22 (66.7%) | 11 (33.3%) |
| Firefighting & Prevention | 0 (0.0%) | 11 (100.0%) |
| Law Enforcement | 22 (100.0%) | 0 (0.0%) |
| Food Preparation & Serving | 87 (44.6%) | 108 (55.4%) |
| Cleaning & Maintenance | 45 (70.3%) | 19 (29.7%) |
| Personal Care & Service | 0 (0.0%) | 3 (100.0%) |
| Total (Category) | 189 (34.2%) | 364 (65.8%) |
| Total (Overall) | 1,323 (52.4%) | 1,203 (47.6%) |
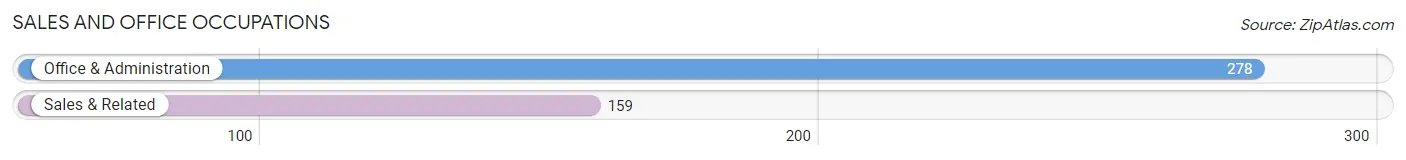
Sales and Office Occupations
The most common Sales and Office occupations in Thermalito are Office & Administration (278 | 11.0%), and Sales & Related (159 | 6.3%).
Sales and Office Occupations by Sex
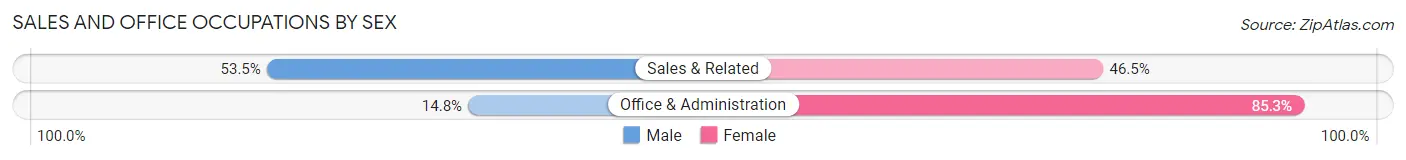
| Occupation | Male | Female |
| Sales & Related | 85 (53.5%) | 74 (46.5%) |
| Office & Administration | 41 (14.7%) | 237 (85.3%) |
| Total (Category) | 126 (28.8%) | 311 (71.2%) |
| Total (Overall) | 1,323 (52.4%) | 1,203 (47.6%) |
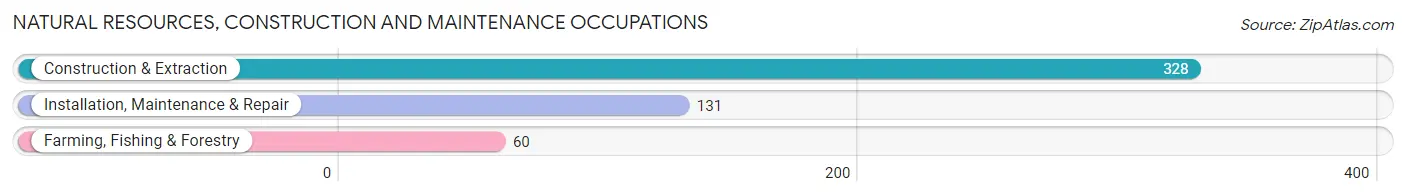
Natural Resources, Construction and Maintenance Occupations
The most common Natural Resources, Construction and Maintenance occupations in Thermalito are Construction & Extraction (328 | 13.0%), Installation, Maintenance & Repair (131 | 5.2%), and Farming, Fishing & Forestry (60 | 2.4%).
Natural Resources, Construction and Maintenance Occupations by Sex
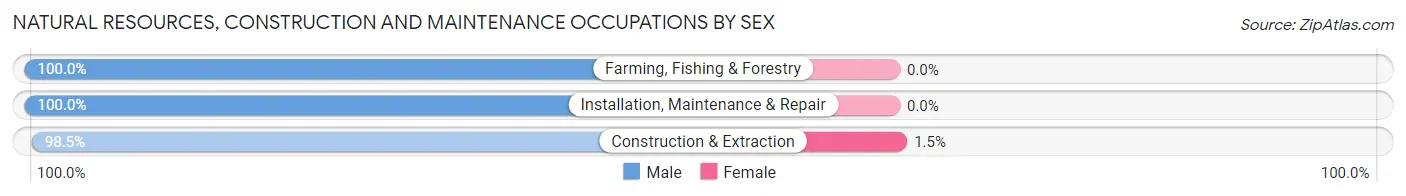
| Occupation | Male | Female |
| Farming, Fishing & Forestry | 60 (100.0%) | 0 (0.0%) |
| Construction & Extraction | 323 (98.5%) | 5 (1.5%) |
| Installation, Maintenance & Repair | 131 (100.0%) | 0 (0.0%) |
| Total (Category) | 514 (99.0%) | 5 (1.0%) |
| Total (Overall) | 1,323 (52.4%) | 1,203 (47.6%) |
Production, Transportation and Moving Occupations
The most common Production, Transportation and Moving occupations in Thermalito are Production (163 | 6.5%), Material Moving (139 | 5.5%), and Transportation (129 | 5.1%).
Production, Transportation and Moving Occupations by Sex
| Occupation | Male | Female |
| Production | 135 (82.8%) | 28 (17.2%) |
| Transportation | 114 (88.4%) | 15 (11.6%) |
| Material Moving | 70 (50.4%) | 69 (49.6%) |
| Total (Category) | 319 (74.0%) | 112 (26.0%) |
| Total (Overall) | 1,323 (52.4%) | 1,203 (47.6%) |
Employment Industries by Sex in Thermalito
Employment Industries in Thermalito
The major employment industries in Thermalito include Manufacturing (352 | 13.9%), Health Care & Social Assistance (349 | 13.8%), Construction (322 | 12.8%), Retail Trade (220 | 8.7%), and Educational Services (182 | 7.2%).
Employment Industries by Sex in Thermalito
The Thermalito industries that see more men than women are Agriculture, Fishing & Hunting (100.0%), Mining, Quarrying, & Extraction (100.0%), and Utilities (100.0%), whereas the industries that tend to have a higher number of women are Wholesale Trade (100.0%), Enterprise Management (100.0%), and Educational Services (89.6%).
| Industry | Male | Female |
| Agriculture, Fishing & Hunting | 72 (100.0%) | 0 (0.0%) |
| Mining, Quarrying, & Extraction | 10 (100.0%) | 0 (0.0%) |
| Construction | 305 (94.7%) | 17 (5.3%) |
| Manufacturing | 235 (66.8%) | 117 (33.2%) |
| Wholesale Trade | 0 (0.0%) | 22 (100.0%) |
| Retail Trade | 165 (75.0%) | 55 (25.0%) |
| Transportation & Warehousing | 35 (76.1%) | 11 (23.9%) |
| Utilities | 15 (100.0%) | 0 (0.0%) |
| Information | 4 (16.7%) | 20 (83.3%) |
| Finance & Insurance | 14 (31.1%) | 31 (68.9%) |
| Real Estate, Rental & Leasing | 43 (81.1%) | 10 (18.9%) |
| Professional & Scientific | 15 (10.7%) | 125 (89.3%) |
| Enterprise Management | 0 (0.0%) | 21 (100.0%) |
| Administrative & Support | 131 (84.5%) | 24 (15.5%) |
| Educational Services | 19 (10.4%) | 163 (89.6%) |
| Health Care & Social Assistance | 63 (18.0%) | 286 (82.0%) |
| Arts, Entertainment & Recreation | 54 (32.3%) | 113 (67.7%) |
| Accommodation & Food Services | 61 (43.0%) | 81 (57.0%) |
| Public Administration | 47 (40.2%) | 70 (59.8%) |
| Total | 1,323 (52.4%) | 1,203 (47.6%) |
Education in Thermalito
School Enrollment in Thermalito
The most common levels of schooling among the 1,488 students in Thermalito are high school (368 | 24.7%), college / undergraduate (342 | 23.0%), and middle school (338 | 22.7%).
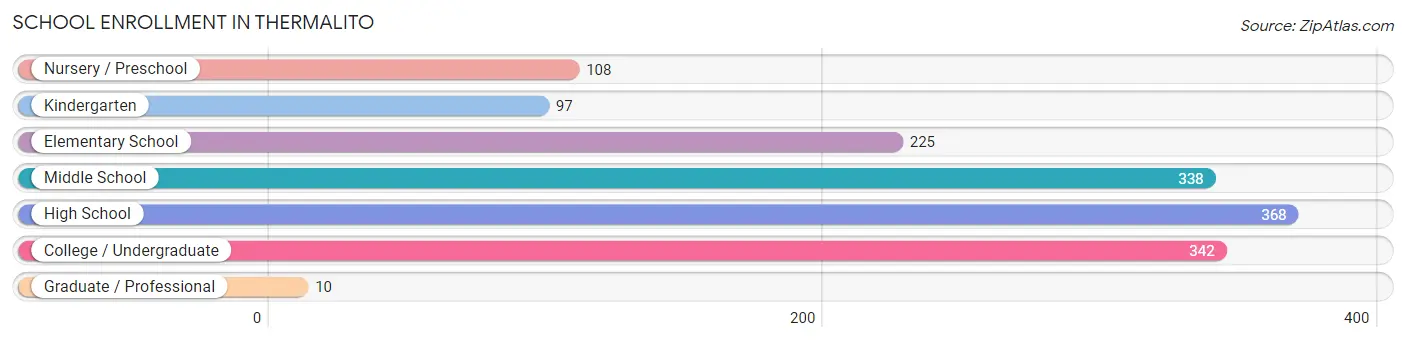
| School Level | # Students | % Students |
| Nursery / Preschool | 108 | 7.3% |
| Kindergarten | 97 | 6.5% |
| Elementary School | 225 | 15.1% |
| Middle School | 338 | 22.7% |
| High School | 368 | 24.7% |
| College / Undergraduate | 342 | 23.0% |
| Graduate / Professional | 10 | 0.7% |
| Total | 1,488 | 100.0% |
School Enrollment by Age by Funding Source in Thermalito
Out of a total of 1,488 students who are enrolled in schools in Thermalito, 36 (2.4%) attend a private institution, while the remaining 1,452 (97.6%) are enrolled in public schools. The age group of 35 years and over has the highest likelihood of being enrolled in private schools, with 10 (23.8% in the age bracket) enrolled. Conversely, the age group of 3 to 4 year olds has the lowest likelihood of being enrolled in a private school, with 95 (100.0% in the age bracket) attending a public institution.
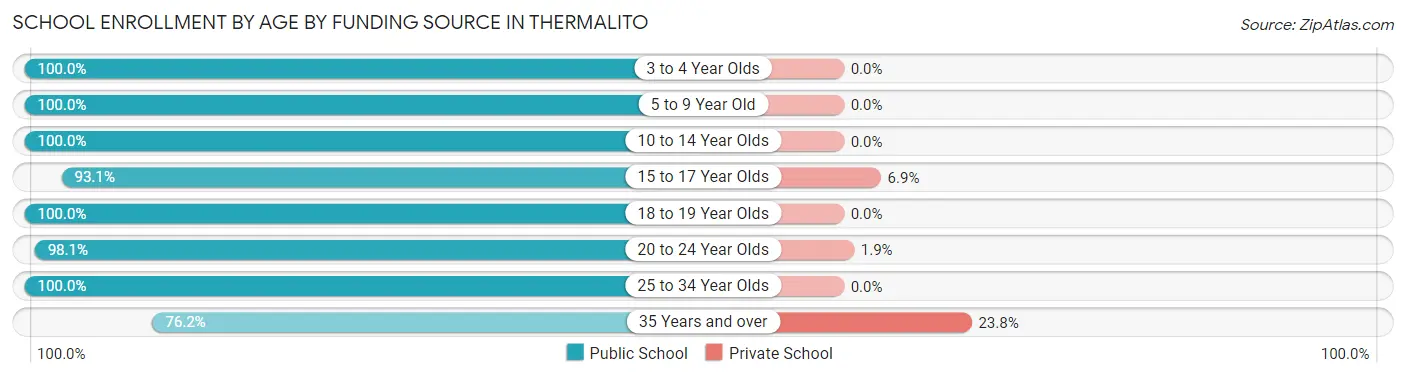
| Age Bracket | Public School | Private School |
| 3 to 4 Year Olds | 95 (100.0%) | 0 (0.0%) |
| 5 to 9 Year Old | 266 (100.0%) | 0 (0.0%) |
| 10 to 14 Year Olds | 462 (100.0%) | 0 (0.0%) |
| 15 to 17 Year Olds | 284 (93.1%) | 21 (6.9%) |
| 18 to 19 Year Olds | 97 (100.0%) | 0 (0.0%) |
| 20 to 24 Year Olds | 208 (98.1%) | 4 (1.9%) |
| 25 to 34 Year Olds | 9 (100.0%) | 0 (0.0%) |
| 35 Years and over | 32 (76.2%) | 10 (23.8%) |
| Total | 1,452 (97.6%) | 36 (2.4%) |
Educational Attainment by Field of Study in Thermalito
Business (103 | 26.1%), visual & performing arts (50 | 12.7%), education (44 | 11.2%), bio, nature & agricultural (34 | 8.6%), and social sciences (32 | 8.1%) are the most common fields of study among 394 individuals in Thermalito who have obtained a bachelor's degree or higher.
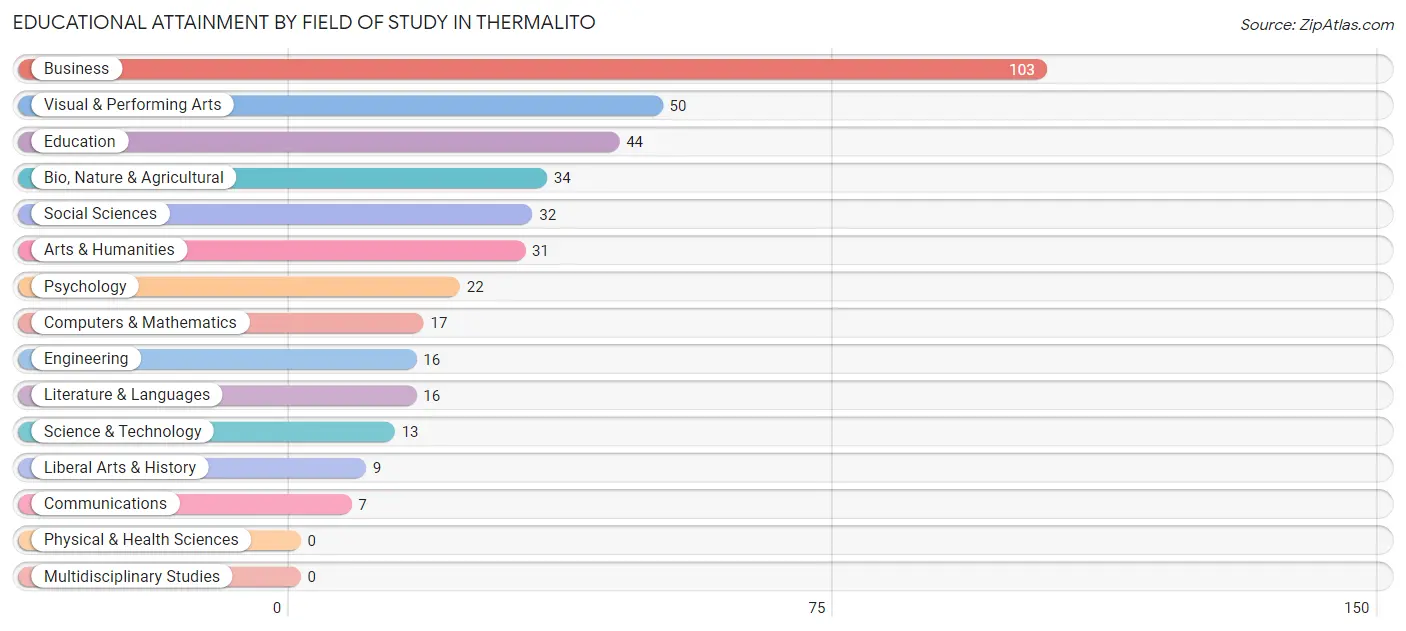
| Field of Study | # Graduates | % Graduates |
| Computers & Mathematics | 17 | 4.3% |
| Bio, Nature & Agricultural | 34 | 8.6% |
| Physical & Health Sciences | 0 | 0.0% |
| Psychology | 22 | 5.6% |
| Social Sciences | 32 | 8.1% |
| Engineering | 16 | 4.1% |
| Multidisciplinary Studies | 0 | 0.0% |
| Science & Technology | 13 | 3.3% |
| Business | 103 | 26.1% |
| Education | 44 | 11.2% |
| Literature & Languages | 16 | 4.1% |
| Liberal Arts & History | 9 | 2.3% |
| Visual & Performing Arts | 50 | 12.7% |
| Communications | 7 | 1.8% |
| Arts & Humanities | 31 | 7.9% |
| Total | 394 | 100.0% |
Transportation & Commute in Thermalito
Vehicle Availability by Sex in Thermalito
The most prevalent vehicle ownership categories in Thermalito are males with 3 vehicles (481, accounting for 38.1%) and females with 3 vehicles (481, making up 42.0%).
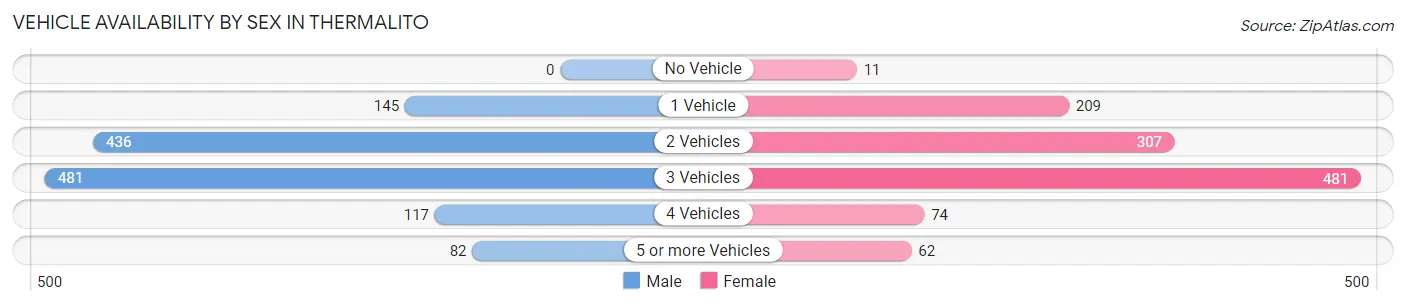
| Vehicles Available | Male | Female |
| No Vehicle | 0 (0.0%) | 11 (1.0%) |
| 1 Vehicle | 145 (11.5%) | 209 (18.3%) |
| 2 Vehicles | 436 (34.6%) | 307 (26.8%) |
| 3 Vehicles | 481 (38.1%) | 481 (42.0%) |
| 4 Vehicles | 117 (9.3%) | 74 (6.5%) |
| 5 or more Vehicles | 82 (6.5%) | 62 (5.4%) |
| Total | 1,261 (100.0%) | 1,144 (100.0%) |
Commute Time in Thermalito
The most frequently occuring commute durations in Thermalito are 10 to 14 minutes (665 commuters, 28.8%), 15 to 19 minutes (390 commuters, 16.9%), and 5 to 9 minutes (279 commuters, 12.1%).
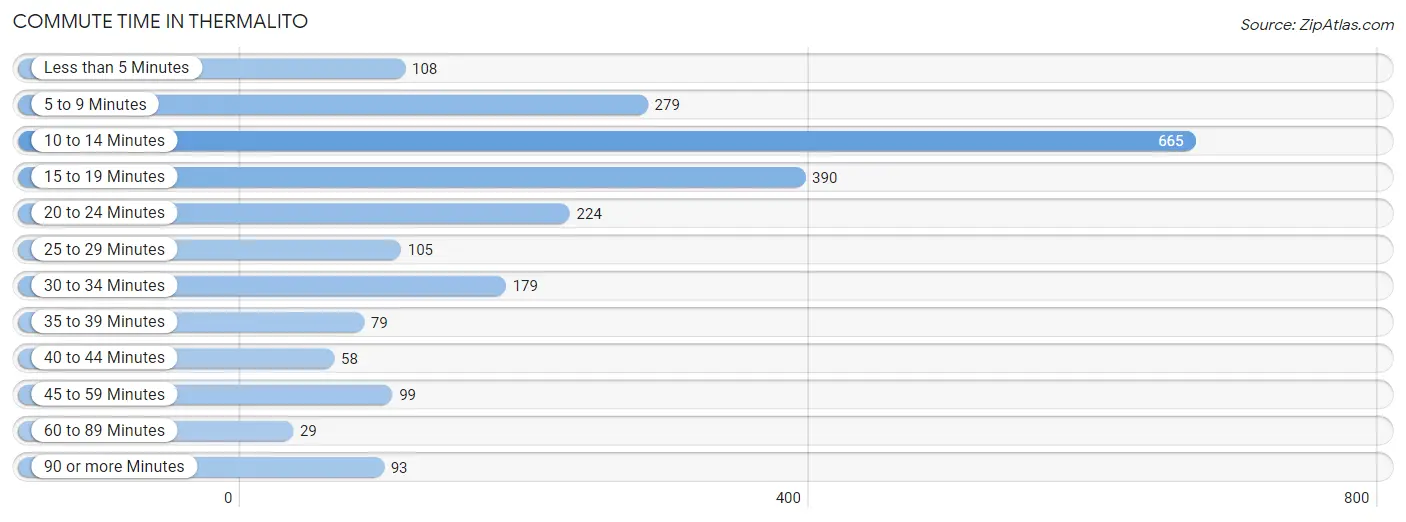
| Commute Time | # Commuters | % Commuters |
| Less than 5 Minutes | 108 | 4.7% |
| 5 to 9 Minutes | 279 | 12.1% |
| 10 to 14 Minutes | 665 | 28.8% |
| 15 to 19 Minutes | 390 | 16.9% |
| 20 to 24 Minutes | 224 | 9.7% |
| 25 to 29 Minutes | 105 | 4.5% |
| 30 to 34 Minutes | 179 | 7.8% |
| 35 to 39 Minutes | 79 | 3.4% |
| 40 to 44 Minutes | 58 | 2.5% |
| 45 to 59 Minutes | 99 | 4.3% |
| 60 to 89 Minutes | 29 | 1.3% |
| 90 or more Minutes | 93 | 4.0% |
Commute Time by Sex in Thermalito
The most common commute times in Thermalito are 10 to 14 minutes (284 commuters, 23.2%) for males and 10 to 14 minutes (381 commuters, 35.2%) for females.
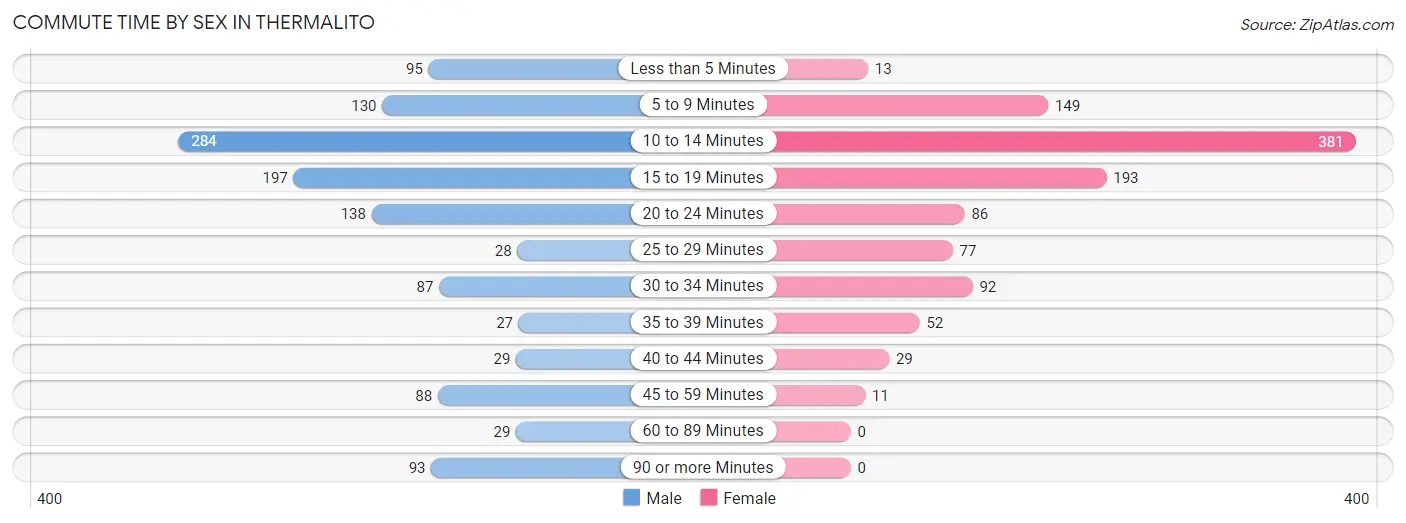
| Commute Time | Male | Female |
| Less than 5 Minutes | 95 (7.8%) | 13 (1.2%) |
| 5 to 9 Minutes | 130 (10.6%) | 149 (13.8%) |
| 10 to 14 Minutes | 284 (23.2%) | 381 (35.2%) |
| 15 to 19 Minutes | 197 (16.1%) | 193 (17.8%) |
| 20 to 24 Minutes | 138 (11.3%) | 86 (7.9%) |
| 25 to 29 Minutes | 28 (2.3%) | 77 (7.1%) |
| 30 to 34 Minutes | 87 (7.1%) | 92 (8.5%) |
| 35 to 39 Minutes | 27 (2.2%) | 52 (4.8%) |
| 40 to 44 Minutes | 29 (2.4%) | 29 (2.7%) |
| 45 to 59 Minutes | 88 (7.2%) | 11 (1.0%) |
| 60 to 89 Minutes | 29 (2.4%) | 0 (0.0%) |
| 90 or more Minutes | 93 (7.6%) | 0 (0.0%) |
Time of Departure to Work by Sex in Thermalito
The most frequent times of departure to work in Thermalito are 12:00 AM to 4:59 AM (285, 23.3%) for males and 8:00 AM to 8:29 AM (193, 17.8%) for females.
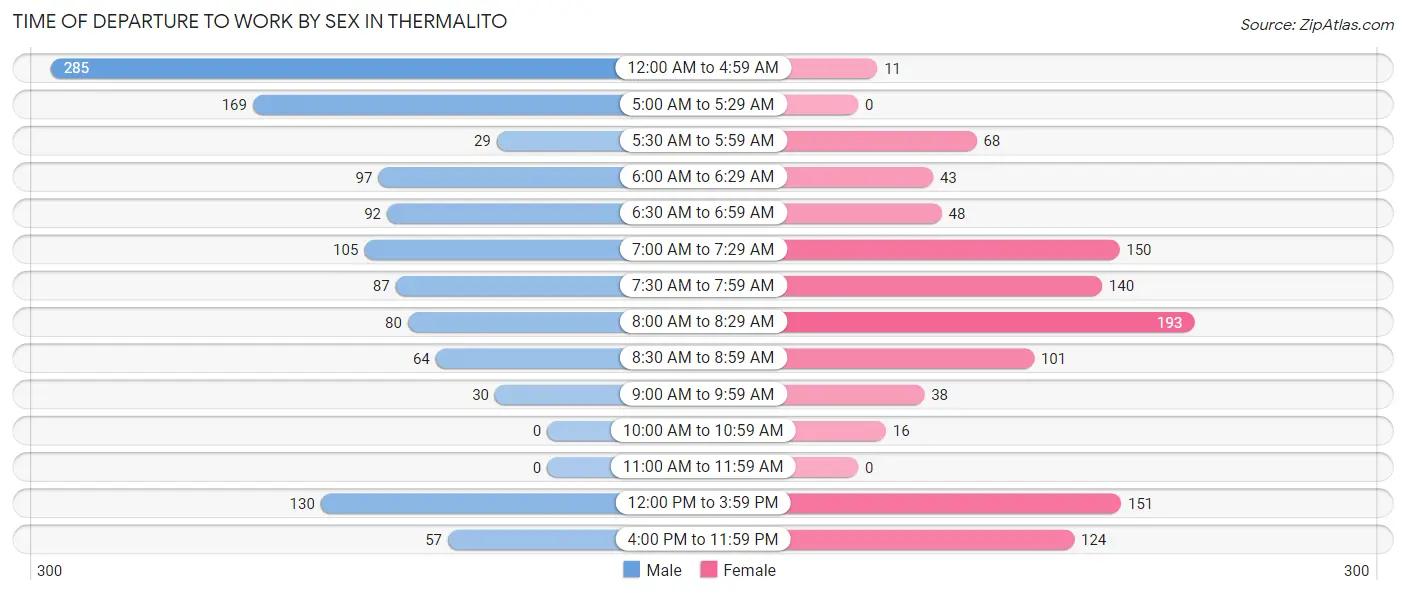
| Time of Departure | Male | Female |
| 12:00 AM to 4:59 AM | 285 (23.3%) | 11 (1.0%) |
| 5:00 AM to 5:29 AM | 169 (13.8%) | 0 (0.0%) |
| 5:30 AM to 5:59 AM | 29 (2.4%) | 68 (6.3%) |
| 6:00 AM to 6:29 AM | 97 (7.9%) | 43 (4.0%) |
| 6:30 AM to 6:59 AM | 92 (7.5%) | 48 (4.4%) |
| 7:00 AM to 7:29 AM | 105 (8.6%) | 150 (13.9%) |
| 7:30 AM to 7:59 AM | 87 (7.1%) | 140 (12.9%) |
| 8:00 AM to 8:29 AM | 80 (6.5%) | 193 (17.8%) |
| 8:30 AM to 8:59 AM | 64 (5.2%) | 101 (9.3%) |
| 9:00 AM to 9:59 AM | 30 (2.5%) | 38 (3.5%) |
| 10:00 AM to 10:59 AM | 0 (0.0%) | 16 (1.5%) |
| 11:00 AM to 11:59 AM | 0 (0.0%) | 0 (0.0%) |
| 12:00 PM to 3:59 PM | 130 (10.6%) | 151 (13.9%) |
| 4:00 PM to 11:59 PM | 57 (4.6%) | 124 (11.5%) |
| Total | 1,225 (100.0%) | 1,083 (100.0%) |
Housing Occupancy in Thermalito
Occupancy by Ownership in Thermalito
Of the total 2,381 dwellings in Thermalito, owner-occupied units account for 1,639 (68.8%), while renter-occupied units make up 742 (31.2%).
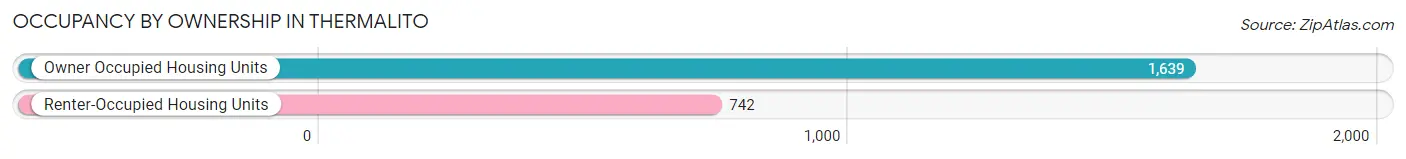
| Occupancy | # Housing Units | % Housing Units |
| Owner Occupied Housing Units | 1,639 | 68.8% |
| Renter-Occupied Housing Units | 742 | 31.2% |
| Total Occupied Housing Units | 2,381 | 100.0% |
Occupancy by Household Size in Thermalito
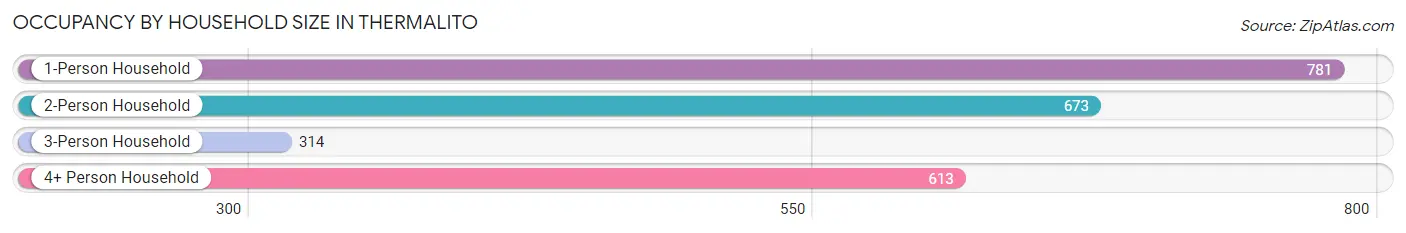
| Household Size | # Housing Units | % Housing Units |
| 1-Person Household | 781 | 32.8% |
| 2-Person Household | 673 | 28.3% |
| 3-Person Household | 314 | 13.2% |
| 4+ Person Household | 613 | 25.8% |
| Total Housing Units | 2,381 | 100.0% |
Occupancy by Ownership by Household Size in Thermalito

| Household Size | Owner-occupied | Renter-occupied |
| 1-Person Household | 462 (59.2%) | 319 (40.8%) |
| 2-Person Household | 540 (80.2%) | 133 (19.8%) |
| 3-Person Household | 254 (80.9%) | 60 (19.1%) |
| 4+ Person Household | 383 (62.5%) | 230 (37.5%) |
| Total Housing Units | 1,639 (68.8%) | 742 (31.2%) |
Occupancy by Educational Attainment in Thermalito
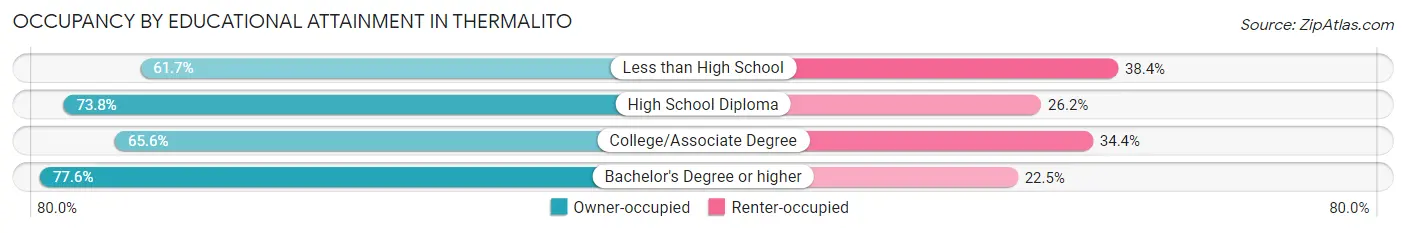
| Household Size | Owner-occupied | Renter-occupied |
| Less than High School | 291 (61.7%) | 181 (38.4%) |
| High School Diploma | 646 (73.8%) | 229 (26.2%) |
| College/Associate Degree | 550 (65.6%) | 288 (34.4%) |
| Bachelor's Degree or higher | 152 (77.5%) | 44 (22.5%) |
Occupancy by Age of Householder in Thermalito
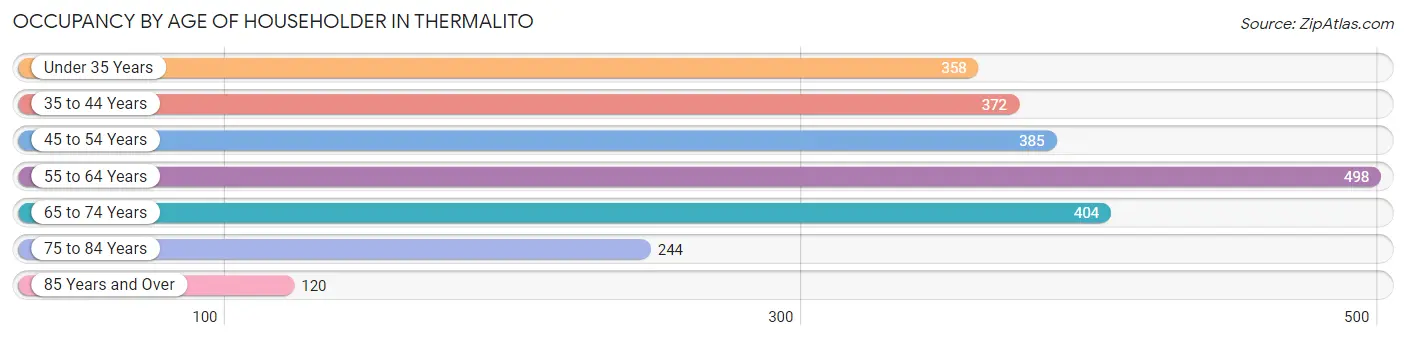
| Age Bracket | # Households | % Households |
| Under 35 Years | 358 | 15.0% |
| 35 to 44 Years | 372 | 15.6% |
| 45 to 54 Years | 385 | 16.2% |
| 55 to 64 Years | 498 | 20.9% |
| 65 to 74 Years | 404 | 17.0% |
| 75 to 84 Years | 244 | 10.2% |
| 85 Years and Over | 120 | 5.0% |
| Total | 2,381 | 100.0% |
Housing Finances in Thermalito
Median Income by Occupancy in Thermalito
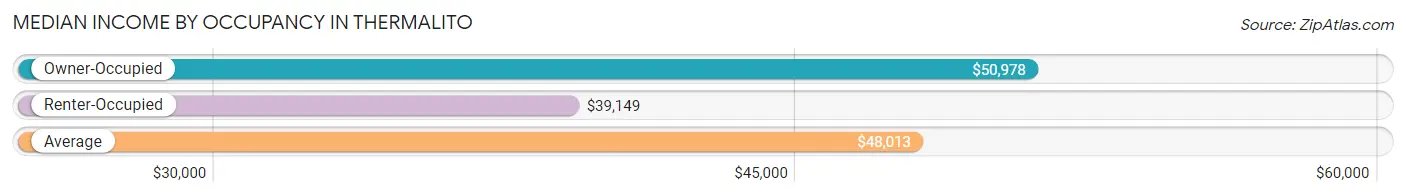
| Occupancy Type | # Households | Median Income |
| Owner-Occupied | 1,639 (68.8%) | $50,978 |
| Renter-Occupied | 742 (31.2%) | $39,149 |
| Average | 2,381 (100.0%) | $48,013 |
Occupancy by Householder Income Bracket in Thermalito
| Income Bracket | Owner-occupied | Renter-occupied |
| Less than $5,000 | 15 (0.9%) | 7 (0.9%) |
| $5,000 to $9,999 | 21 (1.3%) | 0 (0.0%) |
| $10,000 to $14,999 | 24 (1.5%) | 32 (4.3%) |
| $15,000 to $19,999 | 72 (4.4%) | 70 (9.4%) |
| $20,000 to $24,999 | 131 (8.0%) | 52 (7.0%) |
| $25,000 to $34,999 | 212 (12.9%) | 109 (14.7%) |
| $35,000 to $49,999 | 305 (18.6%) | 185 (24.9%) |
| $50,000 to $74,999 | 191 (11.7%) | 195 (26.3%) |
| $75,000 to $99,999 | 145 (8.8%) | 10 (1.3%) |
| $100,000 to $149,999 | 208 (12.7%) | 74 (10.0%) |
| $150,000 or more | 315 (19.2%) | 8 (1.1%) |
| Total | 1,639 (100.0%) | 742 (100.0%) |
Monthly Housing Cost Tiers in Thermalito
| Monthly Cost | Owner-occupied | Renter-occupied |
| Less than $300 | 155 (9.5%) | 0 (0.0%) |
| $300 to $499 | 321 (19.6%) | 15 (2.0%) |
| $500 to $799 | 282 (17.2%) | 140 (18.9%) |
| $800 to $999 | 162 (9.9%) | 172 (23.2%) |
| $1,000 to $1,499 | 359 (21.9%) | 234 (31.5%) |
| $1,500 to $1,999 | 303 (18.5%) | 106 (14.3%) |
| $2,000 to $2,499 | 40 (2.4%) | 22 (3.0%) |
| $2,500 to $2,999 | 6 (0.4%) | 0 (0.0%) |
| $3,000 or more | 11 (0.7%) | 0 (0.0%) |
| Total | 1,639 (100.0%) | 742 (100.0%) |
Physical Housing Characteristics in Thermalito
Housing Structures in Thermalito
| Structure Type | # Housing Units | % Housing Units |
| Single Unit, Detached | 1,744 | 73.3% |
| Single Unit, Attached | 86 | 3.6% |
| 2 Unit Apartments | 53 | 2.2% |
| 3 or 4 Unit Apartments | 10 | 0.4% |
| 5 to 9 Unit Apartments | 0 | 0.0% |
| 10 or more Apartments | 39 | 1.6% |
| Mobile Home / Other | 449 | 18.9% |
| Total | 2,381 | 100.0% |
Housing Structures by Occupancy in Thermalito
| Structure Type | Owner-occupied | Renter-occupied |
| Single Unit, Detached | 1,357 (77.8%) | 387 (22.2%) |
| Single Unit, Attached | 25 (29.1%) | 61 (70.9%) |
| 2 Unit Apartments | 0 (0.0%) | 53 (100.0%) |
| 3 or 4 Unit Apartments | 0 (0.0%) | 10 (100.0%) |
| 5 to 9 Unit Apartments | 0 (0.0%) | 0 (0.0%) |
| 10 or more Apartments | 0 (0.0%) | 39 (100.0%) |
| Mobile Home / Other | 257 (57.2%) | 192 (42.8%) |
| Total | 1,639 (68.8%) | 742 (31.2%) |
Housing Structures by Number of Rooms in Thermalito
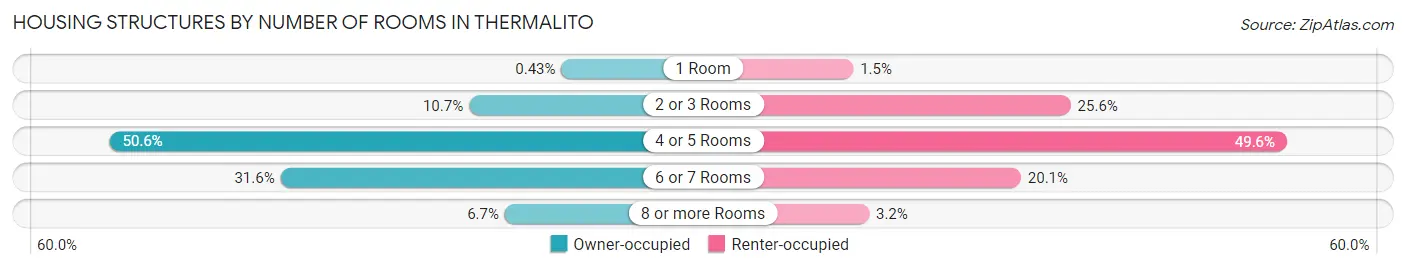
| Number of Rooms | Owner-occupied | Renter-occupied |
| 1 Room | 7 (0.4%) | 11 (1.5%) |
| 2 or 3 Rooms | 175 (10.7%) | 190 (25.6%) |
| 4 or 5 Rooms | 829 (50.6%) | 368 (49.6%) |
| 6 or 7 Rooms | 518 (31.6%) | 149 (20.1%) |
| 8 or more Rooms | 110 (6.7%) | 24 (3.2%) |
| Total | 1,639 (100.0%) | 742 (100.0%) |
Housing Structure by Heating Type in Thermalito
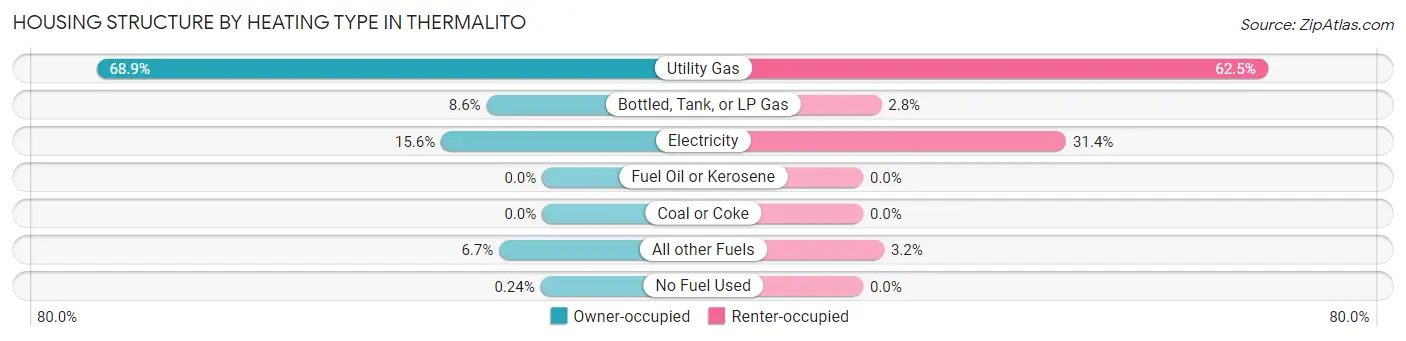
| Heating Type | Owner-occupied | Renter-occupied |
| Utility Gas | 1,129 (68.9%) | 464 (62.5%) |
| Bottled, Tank, or LP Gas | 141 (8.6%) | 21 (2.8%) |
| Electricity | 256 (15.6%) | 233 (31.4%) |
| Fuel Oil or Kerosene | 0 (0.0%) | 0 (0.0%) |
| Coal or Coke | 0 (0.0%) | 0 (0.0%) |
| All other Fuels | 109 (6.7%) | 24 (3.2%) |
| No Fuel Used | 4 (0.2%) | 0 (0.0%) |
| Total | 1,639 (100.0%) | 742 (100.0%) |
Household Vehicle Usage in Thermalito
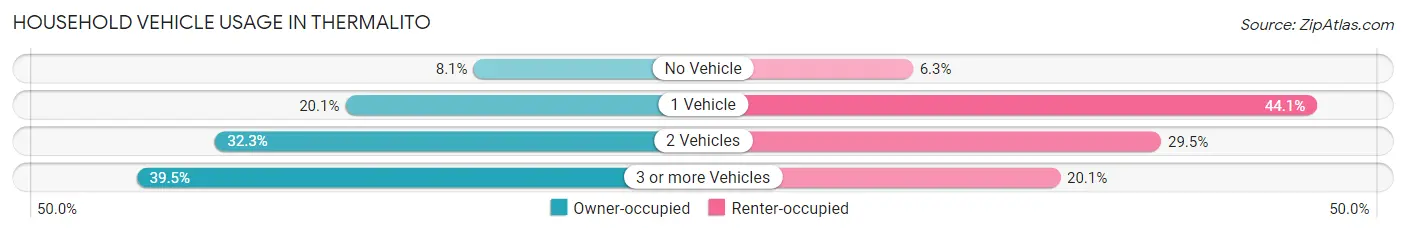
| Vehicles per Household | Owner-occupied | Renter-occupied |
| No Vehicle | 133 (8.1%) | 47 (6.3%) |
| 1 Vehicle | 329 (20.1%) | 327 (44.1%) |
| 2 Vehicles | 529 (32.3%) | 219 (29.5%) |
| 3 or more Vehicles | 648 (39.5%) | 149 (20.1%) |
| Total | 1,639 (100.0%) | 742 (100.0%) |
Real Estate & Mortgages in Thermalito
Real Estate and Mortgage Overview in Thermalito
| Characteristic | Without Mortgage | With Mortgage |
| Housing Units | 826 | 813 |
| Median Property Value | $172,000 | $254,500 |
| Median Household Income | $40,449 | $218 |
| Monthly Housing Costs | $468 | $11 |
| Real Estate Taxes | $900 | $52 |
Property Value by Mortgage Status in Thermalito
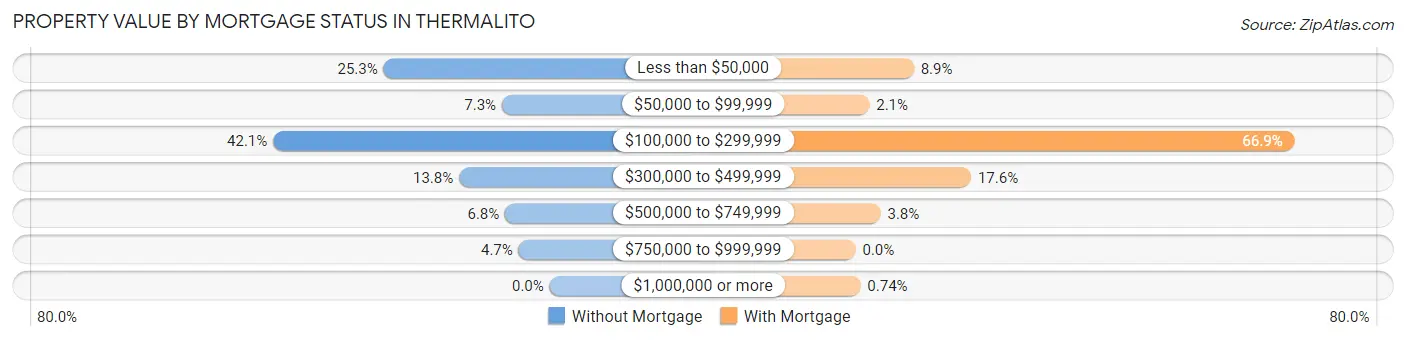
| Property Value | Without Mortgage | With Mortgage |
| Less than $50,000 | 209 (25.3%) | 72 (8.9%) |
| $50,000 to $99,999 | 60 (7.3%) | 17 (2.1%) |
| $100,000 to $299,999 | 348 (42.1%) | 544 (66.9%) |
| $300,000 to $499,999 | 114 (13.8%) | 143 (17.6%) |
| $500,000 to $749,999 | 56 (6.8%) | 31 (3.8%) |
| $750,000 to $999,999 | 39 (4.7%) | 0 (0.0%) |
| $1,000,000 or more | 0 (0.0%) | 6 (0.7%) |
| Total | 826 (100.0%) | 813 (100.0%) |
Household Income by Mortgage Status in Thermalito
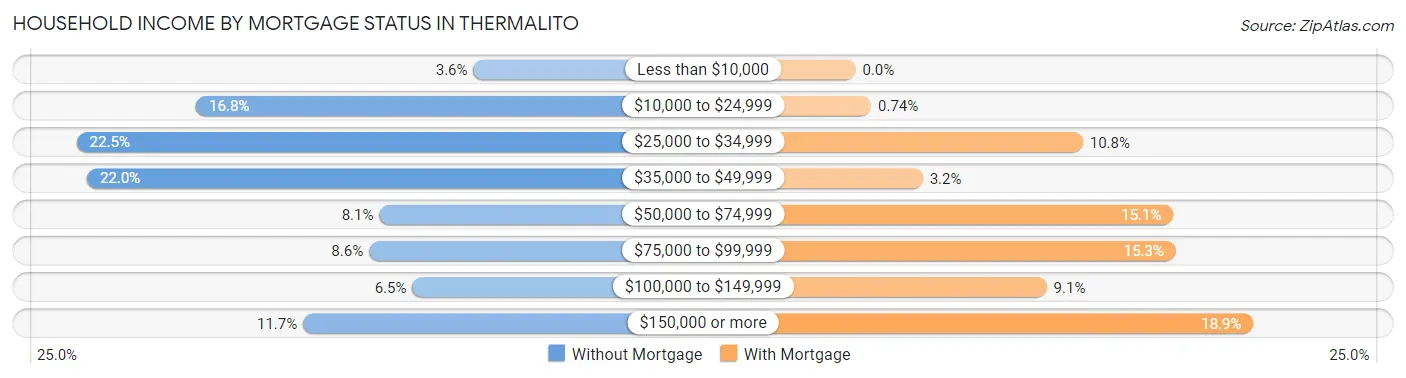
| Household Income | Without Mortgage | With Mortgage |
| Less than $10,000 | 30 (3.6%) | 0 (0.0%) |
| $10,000 to $24,999 | 139 (16.8%) | 6 (0.7%) |
| $25,000 to $34,999 | 186 (22.5%) | 88 (10.8%) |
| $35,000 to $49,999 | 182 (22.0%) | 26 (3.2%) |
| $50,000 to $74,999 | 67 (8.1%) | 123 (15.1%) |
| $75,000 to $99,999 | 71 (8.6%) | 124 (15.2%) |
| $100,000 to $149,999 | 54 (6.5%) | 74 (9.1%) |
| $150,000 or more | 97 (11.7%) | 154 (18.9%) |
| Total | 826 (100.0%) | 813 (100.0%) |
Property Value to Household Income Ratio in Thermalito
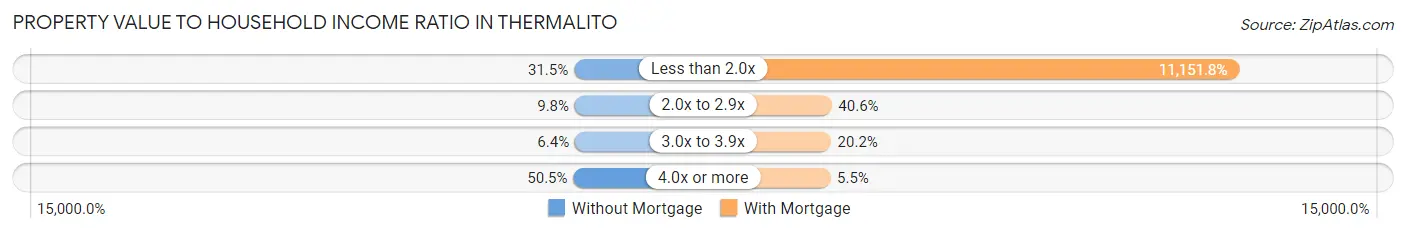
| Value-to-Income Ratio | Without Mortgage | With Mortgage |
| Less than 2.0x | 260 (31.5%) | 90,664 (11,151.8%) |
| 2.0x to 2.9x | 81 (9.8%) | 330 (40.6%) |
| 3.0x to 3.9x | 53 (6.4%) | 164 (20.2%) |
| 4.0x or more | 417 (50.5%) | 45 (5.5%) |
| Total | 826 (100.0%) | 813 (100.0%) |
Real Estate Taxes by Mortgage Status in Thermalito
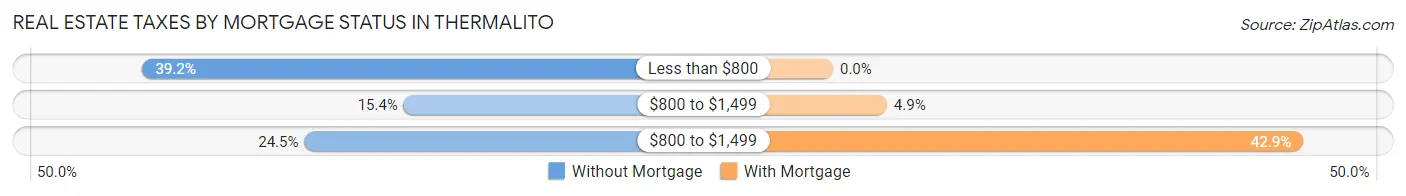
| Property Taxes | Without Mortgage | With Mortgage |
| Less than $800 | 324 (39.2%) | 0 (0.0%) |
| $800 to $1,499 | 127 (15.4%) | 40 (4.9%) |
| $800 to $1,499 | 202 (24.5%) | 349 (42.9%) |
| Total | 826 (100.0%) | 813 (100.0%) |
Health & Disability in Thermalito
Health Insurance Coverage by Age in Thermalito
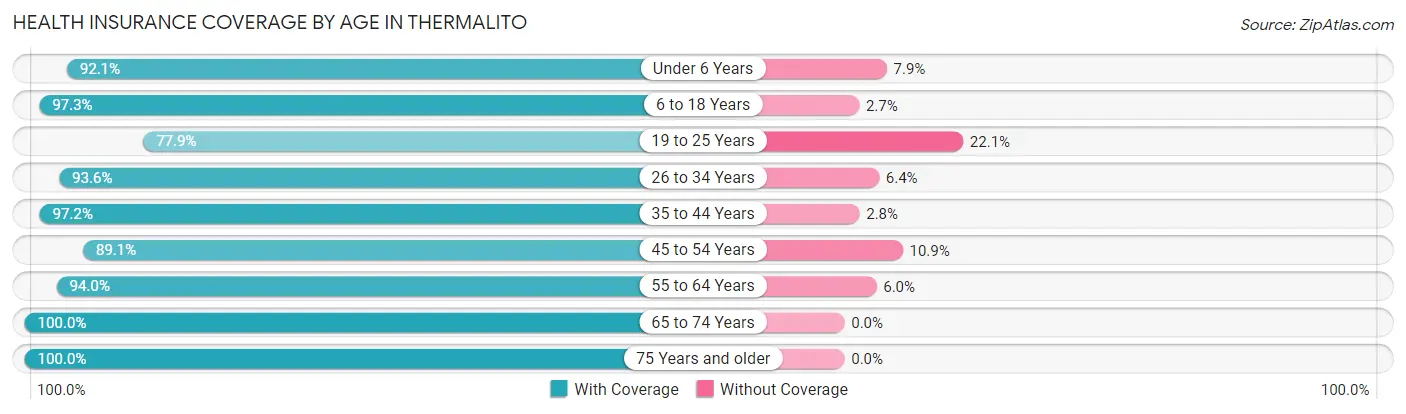
| Age Bracket | With Coverage | Without Coverage |
| Under 6 Years | 490 (92.1%) | 42 (7.9%) |
| 6 to 18 Years | 1,178 (97.3%) | 33 (2.7%) |
| 19 to 25 Years | 711 (77.9%) | 202 (22.1%) |
| 26 to 34 Years | 494 (93.6%) | 34 (6.4%) |
| 35 to 44 Years | 696 (97.2%) | 20 (2.8%) |
| 45 to 54 Years | 706 (89.1%) | 86 (10.9%) |
| 55 to 64 Years | 900 (94.0%) | 57 (6.0%) |
| 65 to 74 Years | 605 (100.0%) | 0 (0.0%) |
| 75 Years and older | 536 (100.0%) | 0 (0.0%) |
| Total | 6,316 (93.0%) | 474 (7.0%) |
Health Insurance Coverage by Citizenship Status in Thermalito
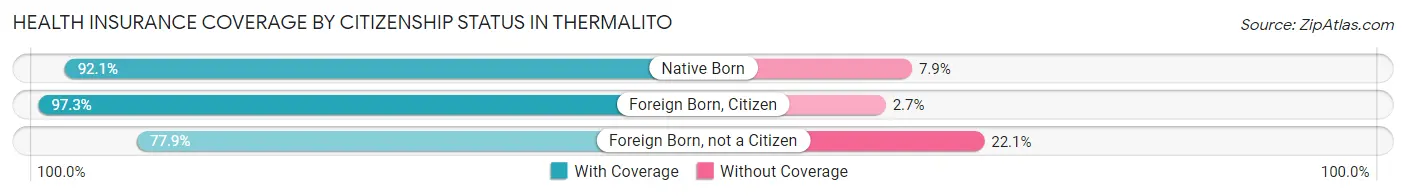
| Citizenship Status | With Coverage | Without Coverage |
| Native Born | 490 (92.1%) | 42 (7.9%) |
| Foreign Born, Citizen | 1,178 (97.3%) | 33 (2.7%) |
| Foreign Born, not a Citizen | 711 (77.9%) | 202 (22.1%) |
Health Insurance Coverage by Household Income in Thermalito
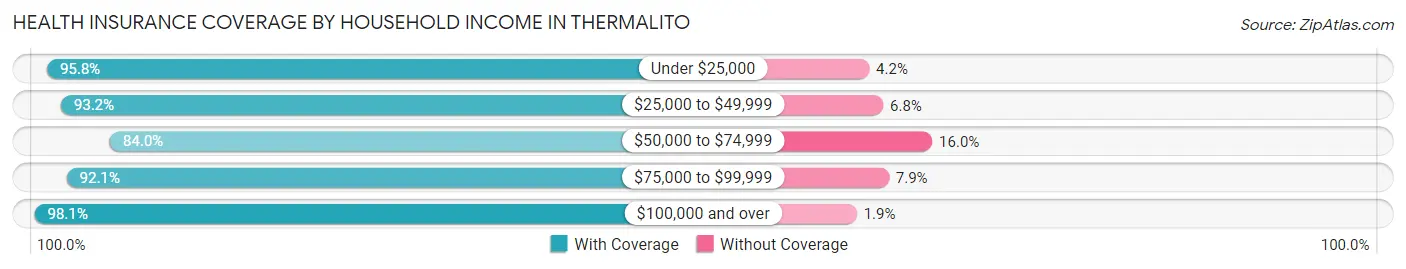
| Household Income | With Coverage | Without Coverage |
| Under $25,000 | 755 (95.8%) | 33 (4.2%) |
| $25,000 to $49,999 | 1,904 (93.2%) | 139 (6.8%) |
| $50,000 to $74,999 | 1,198 (84.0%) | 228 (16.0%) |
| $75,000 to $99,999 | 421 (92.1%) | 36 (7.9%) |
| $100,000 and over | 2,007 (98.1%) | 38 (1.9%) |
Public vs Private Health Insurance Coverage by Age in Thermalito
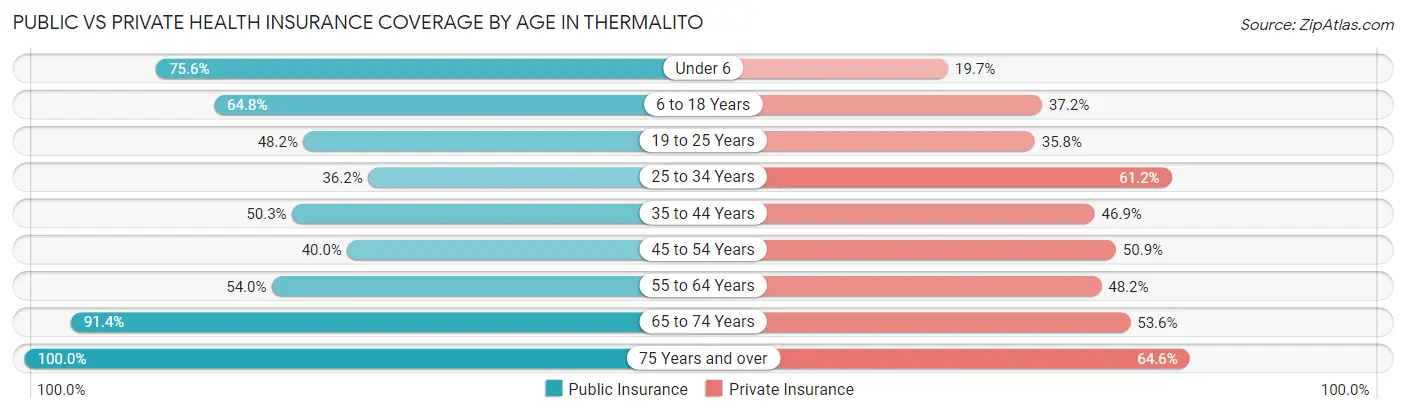
| Age Bracket | Public Insurance | Private Insurance |
| Under 6 | 402 (75.6%) | 105 (19.7%) |
| 6 to 18 Years | 785 (64.8%) | 450 (37.2%) |
| 19 to 25 Years | 440 (48.2%) | 327 (35.8%) |
| 25 to 34 Years | 191 (36.2%) | 323 (61.2%) |
| 35 to 44 Years | 360 (50.3%) | 336 (46.9%) |
| 45 to 54 Years | 317 (40.0%) | 403 (50.9%) |
| 55 to 64 Years | 517 (54.0%) | 461 (48.2%) |
| 65 to 74 Years | 553 (91.4%) | 324 (53.5%) |
| 75 Years and over | 536 (100.0%) | 346 (64.5%) |
| Total | 4,101 (60.4%) | 3,075 (45.3%) |
Disability Status by Sex by Age in Thermalito
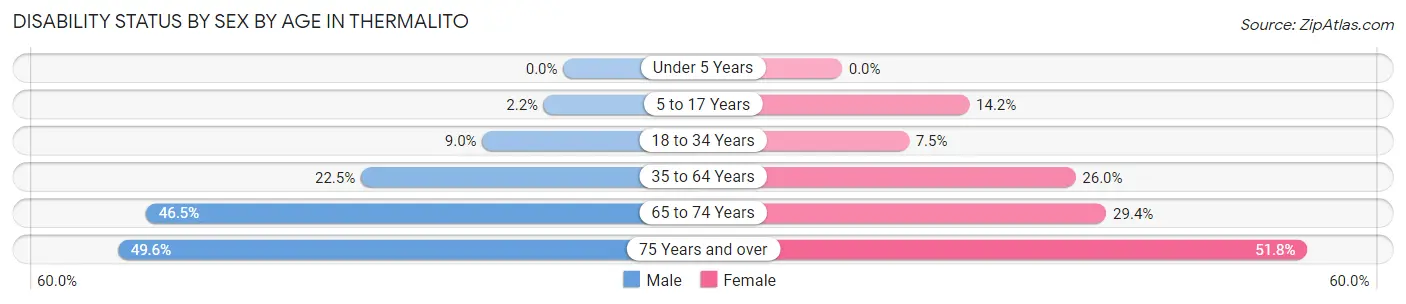
| Age Bracket | Male | Female |
| Under 5 Years | 0 (0.0%) | 0 (0.0%) |
| 5 to 17 Years | 11 (2.2%) | 98 (14.2%) |
| 18 to 34 Years | 74 (9.0%) | 52 (7.4%) |
| 35 to 64 Years | 299 (22.5%) | 296 (26.0%) |
| 65 to 74 Years | 106 (46.5%) | 111 (29.4%) |
| 75 Years and over | 131 (49.6%) | 141 (51.8%) |
Disability Class by Sex by Age in Thermalito
Disability Class: Hearing Difficulty
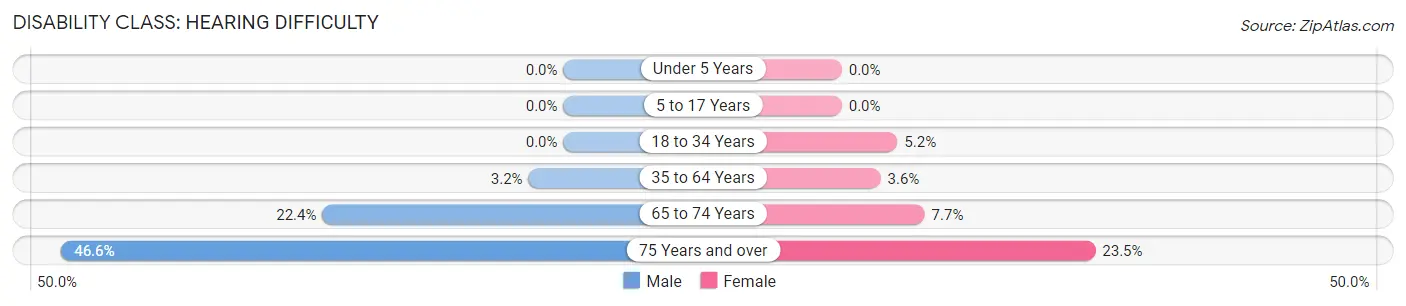
| Age Bracket | Male | Female |
| Under 5 Years | 0 (0.0%) | 0 (0.0%) |
| 5 to 17 Years | 0 (0.0%) | 0 (0.0%) |
| 18 to 34 Years | 0 (0.0%) | 36 (5.2%) |
| 35 to 64 Years | 43 (3.2%) | 41 (3.6%) |
| 65 to 74 Years | 51 (22.4%) | 29 (7.7%) |
| 75 Years and over | 123 (46.6%) | 64 (23.5%) |
Disability Class: Vision Difficulty
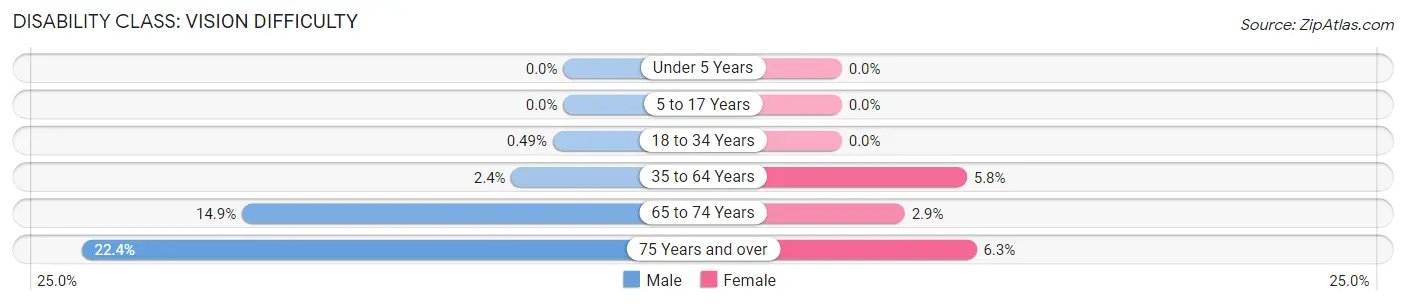
| Age Bracket | Male | Female |
| Under 5 Years | 0 (0.0%) | 0 (0.0%) |
| 5 to 17 Years | 0 (0.0%) | 0 (0.0%) |
| 18 to 34 Years | 4 (0.5%) | 0 (0.0%) |
| 35 to 64 Years | 32 (2.4%) | 66 (5.8%) |
| 65 to 74 Years | 34 (14.9%) | 11 (2.9%) |
| 75 Years and over | 59 (22.4%) | 17 (6.2%) |
Disability Class: Cognitive Difficulty
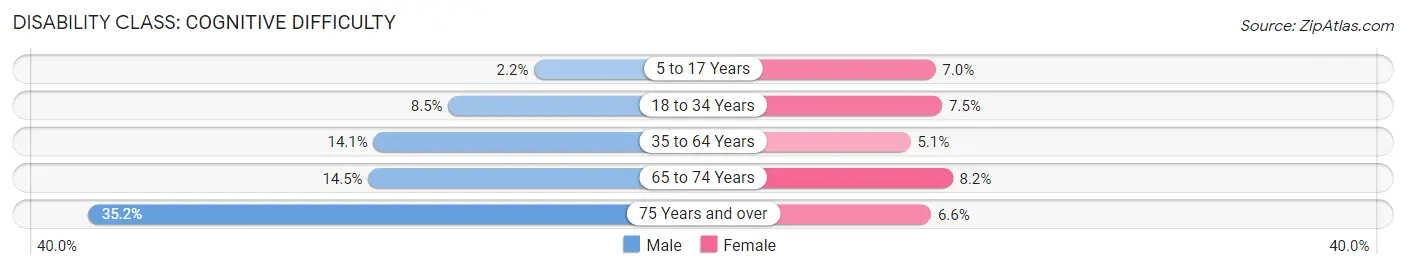
| Age Bracket | Male | Female |
| 5 to 17 Years | 11 (2.2%) | 48 (7.0%) |
| 18 to 34 Years | 70 (8.5%) | 52 (7.4%) |
| 35 to 64 Years | 187 (14.1%) | 58 (5.1%) |
| 65 to 74 Years | 33 (14.5%) | 31 (8.2%) |
| 75 Years and over | 93 (35.2%) | 18 (6.6%) |
Disability Class: Ambulatory Difficulty
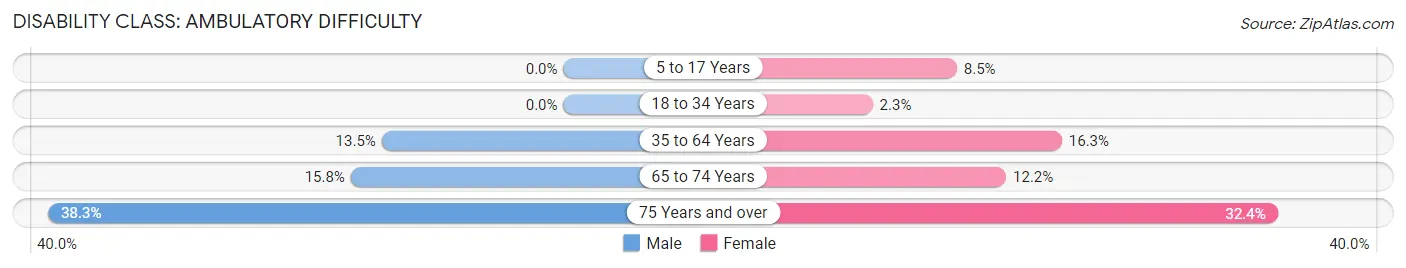
| Age Bracket | Male | Female |
| 5 to 17 Years | 0 (0.0%) | 59 (8.5%) |
| 18 to 34 Years | 0 (0.0%) | 16 (2.3%) |
| 35 to 64 Years | 179 (13.5%) | 186 (16.3%) |
| 65 to 74 Years | 36 (15.8%) | 46 (12.2%) |
| 75 Years and over | 101 (38.3%) | 88 (32.4%) |
Disability Class: Self-Care Difficulty
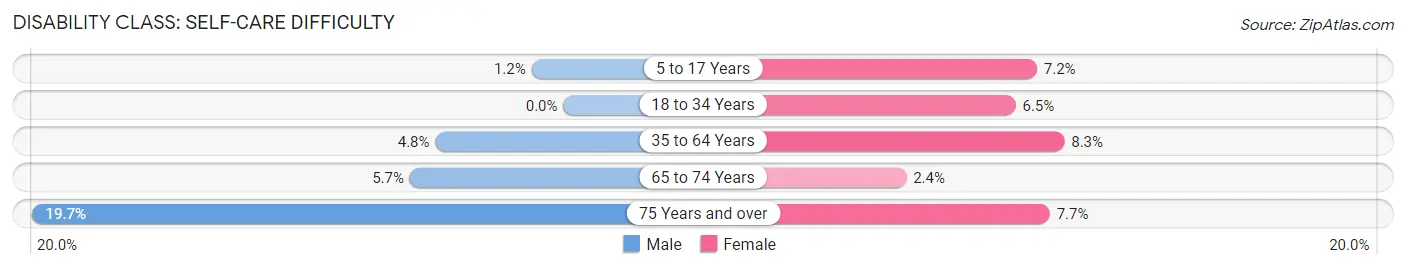
| Age Bracket | Male | Female |
| 5 to 17 Years | 6 (1.2%) | 50 (7.2%) |
| 18 to 34 Years | 0 (0.0%) | 45 (6.5%) |
| 35 to 64 Years | 63 (4.8%) | 94 (8.3%) |
| 65 to 74 Years | 13 (5.7%) | 9 (2.4%) |
| 75 Years and over | 52 (19.7%) | 21 (7.7%) |
Technology Access in Thermalito
Computing Device Access in Thermalito
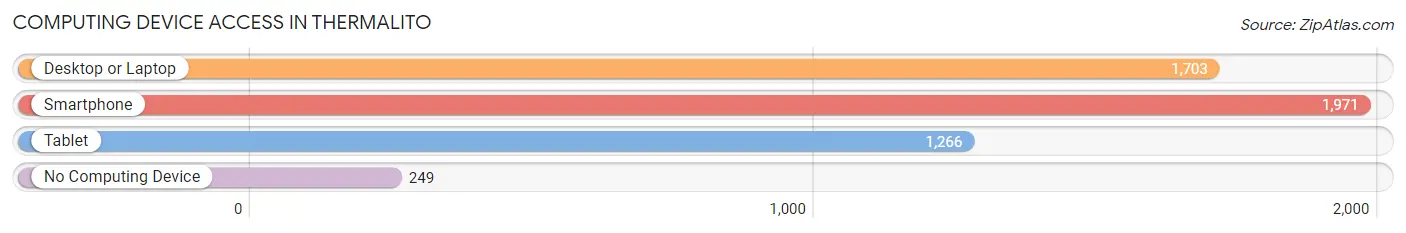
| Device Type | # Households | % Households |
| Desktop or Laptop | 1,703 | 71.5% |
| Smartphone | 1,971 | 82.8% |
| Tablet | 1,266 | 53.2% |
| No Computing Device | 249 | 10.5% |
| Total | 2,381 | 100.0% |
Internet Access in Thermalito
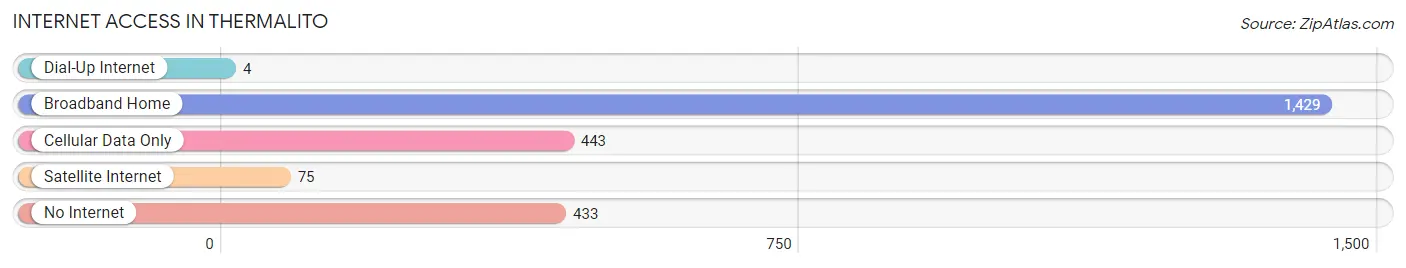
| Internet Type | # Households | % Households |
| Dial-Up Internet | 4 | 0.2% |
| Broadband Home | 1,429 | 60.0% |
| Cellular Data Only | 443 | 18.6% |
| Satellite Internet | 75 | 3.2% |
| No Internet | 433 | 18.2% |
| Total | 2,381 | 100.0% |
Thermalito Summary
Thermalito is a census-designated place located in Butte County, California. It is situated in the northern part of the state, about 10 miles north of the city of Oroville. The population of Thermalito was 5,945 at the 2010 census.
Geography
Thermalito is located at 39°35'17" North, 121°35'17" West (39.588, -121.588). It is situated in the northern part of the state, about 10 miles north of the city of Oroville. The town is located on the west side of the Feather River, and is bordered by the cities of Oroville and Palermo to the south, and the town of Gridley to the north.
The terrain of Thermalito is mostly flat, with some rolling hills. The town is located in the Central Valley region of California, and is part of the Sacramento Valley. The climate is generally mild, with hot summers and cool winters.
Economy
The economy of Thermalito is largely based on agriculture. The town is home to several large farms, which produce a variety of crops, including almonds, walnuts, tomatoes, and other fruits and vegetables. The town is also home to several wineries, which produce a variety of wines.
The town is also home to several small businesses, including restaurants, retail stores, and other services. The town is also home to a number of light industrial businesses, including a metal fabrication plant and a plastics manufacturing plant.
Demographics
As of the 2010 census, the population of Thermalito was 5,945. The racial makeup of the town was 75.3% White, 0.7% African American, 1.2% Native American, 0.7% Asian, 0.1% Pacific Islander, 17.7% from other races, and 4.3% from two or more races. Hispanic or Latino of any race were 33.2% of the population.
The median income for a household in Thermalito was $37,917, and the median income for a family was $45,917. The per capita income for the town was $17,917. About 17.7% of families and 22.3% of the population were below the poverty line, including 33.3% of those under age 18 and 8.3% of those age 65 or over.
Conclusion
Thermalito is a small town located in Butte County, California. It is situated in the northern part of the state, about 10 miles north of the city of Oroville. The town is home to several large farms, which produce a variety of crops, as well as several wineries and small businesses. The population of Thermalito was 5,945 at the 2010 census, and the town has a diverse racial makeup. The economy of Thermalito is largely based on agriculture, and the median income for a household in the town was $37,917.
Common Questions
What is Per Capita Income in Thermalito?
Per Capita income in Thermalito is $28,802.
What is the Median Family Income in Thermalito?
Median Family Income in Thermalito is $51,509.
What is the Median Household income in Thermalito?
Median Household Income in Thermalito is $48,013.
What is Income or Wage Gap in Thermalito?
Income or Wage Gap in Thermalito is 34.6%.
Women in Thermalito earn 65.4 cents for every dollar earned by a man.
What is Family Income Deficit in Thermalito?
Family Income Deficit in Thermalito is $7,104.
Families that are below poverty line in Thermalito earn $7,104 less on average than the poverty threshold level.
What is Inequality or Gini Index in Thermalito?
Inequality or Gini Index in Thermalito is 0.47.
What is the Total Population of Thermalito?
Total Population of Thermalito is 6,790.
What is the Total Male Population of Thermalito?
Total Male Population of Thermalito is 3,337.
What is the Total Female Population of Thermalito?
Total Female Population of Thermalito is 3,453.
What is the Ratio of Males per 100 Females in Thermalito?
There are 96.64 Males per 100 Females in Thermalito.
What is the Ratio of Females per 100 Males in Thermalito?
There are 103.48 Females per 100 Males in Thermalito.
What is the Median Population Age in Thermalito?
Median Population Age in Thermalito is 37.4 Years.
What is the Average Family Size in Thermalito
Average Family Size in Thermalito is 3.8 People.
What is the Average Household Size in Thermalito
Average Household Size in Thermalito is 2.8 People.
How Large is the Labor Force in Thermalito?
There are 2,747 People in the Labor Forcein in Thermalito.
What is the Percentage of People in the Labor Force in Thermalito?
50.8% of People are in the Labor Force in Thermalito.
What is the Unemployment Rate in Thermalito?
Unemployment Rate in Thermalito is 8.0%.