Penn Valley, CA Map & Demographics
Penn Valley Map
Penn Valley Overview
$34,638
PER CAPITA INCOME
$72,202
AVG FAMILY INCOME
$65,882
AVG HOUSEHOLD INCOME
23.5%
WAGE / INCOME GAP [ % ]
76.5¢/ $1
WAGE / INCOME GAP [ $ ]
0.38
INEQUALITY / GINI INDEX
1,188
TOTAL POPULATION
577
MALE POPULATION
611
FEMALE POPULATION
94.44
MALES / 100 FEMALES
105.89
FEMALES / 100 MALES
55.7
MEDIAN AGE
2.6
AVG FAMILY SIZE
2.5
AVG HOUSEHOLD SIZE
502
LABOR FORCE [ PEOPLE ]
47.7%
PERCENT IN LABOR FORCE
Penn Valley Zip Codes
Penn Valley Area Codes
Income in Penn Valley
Income Overview in Penn Valley
Per Capita Income in Penn Valley is $34,638, while median incomes of families and households are $72,202 and $65,882 respectively.
| Characteristic | Number | Measure |
| Per Capita Income | 1,188 | $34,638 |
| Median Family Income | 399 | $72,202 |
| Mean Family Income | 399 | $88,757 |
| Median Household Income | 478 | $65,882 |
| Mean Household Income | 478 | $84,339 |
| Income Deficit | 399 | $0 |
| Wage / Income Gap (%) | 1,188 | 23.51% |
| Wage / Income Gap ($) | 1,188 | 76.49¢ per $1 |
| Gini / Inequality Index | 1,188 | 0.38 |
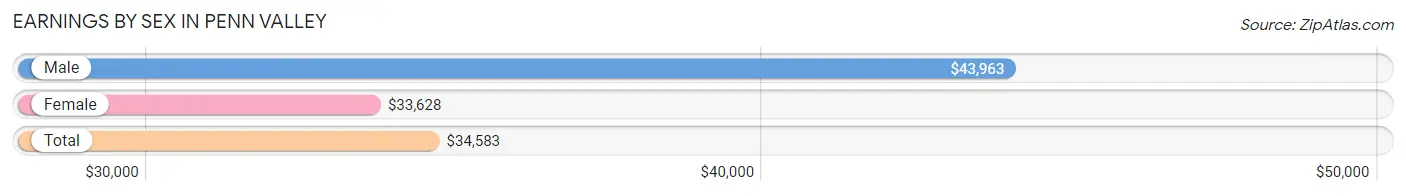
Earnings by Sex in Penn Valley
Average Earnings in Penn Valley are $34,583, $43,963 for men and $33,628 for women, a difference of 23.5%.
| Sex | Number | Average Earnings |
| Male | 269 (53.6%) | $43,963 |
| Female | 233 (46.4%) | $33,628 |
| Total | 502 (100.0%) | $34,583 |
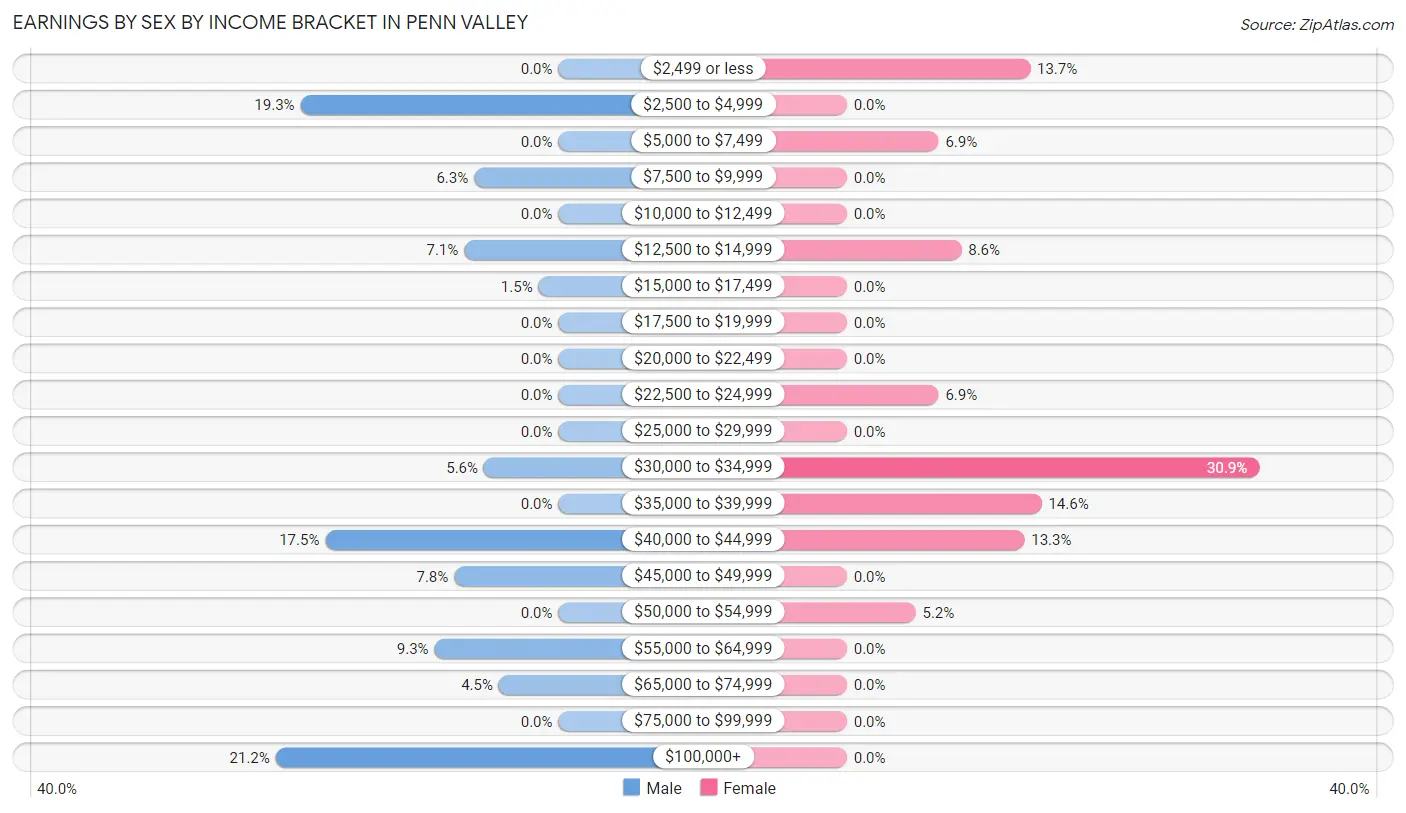
Earnings by Sex by Income Bracket in Penn Valley
The most common earnings brackets in Penn Valley are $100,000+ for men (57 | 21.2%) and $30,000 to $34,999 for women (72 | 30.9%).
| Income | Male | Female |
| $2,499 or less | 0 (0.0%) | 32 (13.7%) |
| $2,500 to $4,999 | 52 (19.3%) | 0 (0.0%) |
| $5,000 to $7,499 | 0 (0.0%) | 16 (6.9%) |
| $7,500 to $9,999 | 17 (6.3%) | 0 (0.0%) |
| $10,000 to $12,499 | 0 (0.0%) | 0 (0.0%) |
| $12,500 to $14,999 | 19 (7.1%) | 20 (8.6%) |
| $15,000 to $17,499 | 4 (1.5%) | 0 (0.0%) |
| $17,500 to $19,999 | 0 (0.0%) | 0 (0.0%) |
| $20,000 to $22,499 | 0 (0.0%) | 0 (0.0%) |
| $22,500 to $24,999 | 0 (0.0%) | 16 (6.9%) |
| $25,000 to $29,999 | 0 (0.0%) | 0 (0.0%) |
| $30,000 to $34,999 | 15 (5.6%) | 72 (30.9%) |
| $35,000 to $39,999 | 0 (0.0%) | 34 (14.6%) |
| $40,000 to $44,999 | 47 (17.5%) | 31 (13.3%) |
| $45,000 to $49,999 | 21 (7.8%) | 0 (0.0%) |
| $50,000 to $54,999 | 0 (0.0%) | 12 (5.1%) |
| $55,000 to $64,999 | 25 (9.3%) | 0 (0.0%) |
| $65,000 to $74,999 | 12 (4.5%) | 0 (0.0%) |
| $75,000 to $99,999 | 0 (0.0%) | 0 (0.0%) |
| $100,000+ | 57 (21.2%) | 0 (0.0%) |
| Total | 269 (100.0%) | 233 (100.0%) |
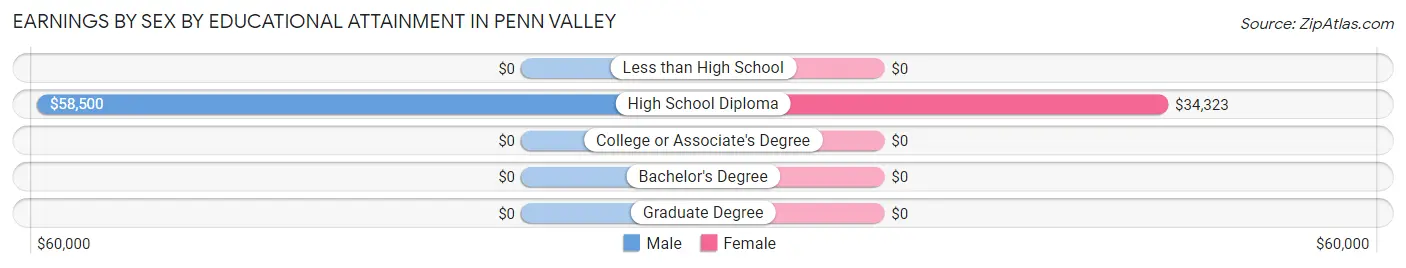
Earnings by Sex by Educational Attainment in Penn Valley
Average earnings in Penn Valley are $43,963 for men and $33,628 for women, a difference of 23.5%. Men with an educational attainment of high school diploma enjoy the highest average annual earnings of $58,500, while those with high school diploma education earn the least with $58,500. Women with an educational attainment of high school diploma earn the most with the average annual earnings of $34,323, while those with high school diploma education have the smallest earnings of $34,323.
| Educational Attainment | Male Income | Female Income |
| Less than High School | - | - |
| High School Diploma | $58,500 | $34,323 |
| College or Associate's Degree | - | - |
| Bachelor's Degree | - | - |
| Graduate Degree | - | - |
| Total | $43,963 | $33,628 |
Family Income in Penn Valley
Family Income Brackets in Penn Valley
According to the Penn Valley family income data, there are 140 families falling into the $75,000 to $99,999 income range, which is the most common income bracket and makes up 35.1% of all families.
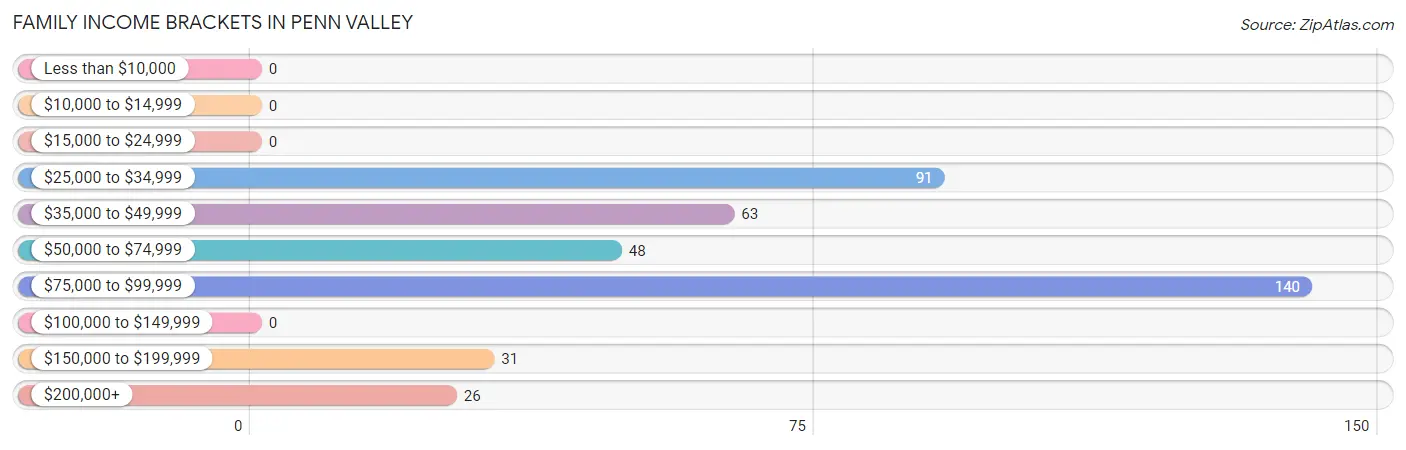
| Income Bracket | # Families | % Families |
| Less than $10,000 | 0 | 0.0% |
| $10,000 to $14,999 | 0 | 0.0% |
| $15,000 to $24,999 | 0 | 0.0% |
| $25,000 to $34,999 | 91 | 22.8% |
| $35,000 to $49,999 | 63 | 15.8% |
| $50,000 to $74,999 | 48 | 12.0% |
| $75,000 to $99,999 | 140 | 35.1% |
| $100,000 to $149,999 | 0 | 0.0% |
| $150,000 to $199,999 | 31 | 7.8% |
| $200,000+ | 26 | 6.5% |
Family Income by Famaliy Size in Penn Valley
2-person families (298 | 74.7%) account for the highest median family income in Penn Valley with $76,118 per family, while 2-person families (298 | 74.7%) have the highest median income of $38,059 per family member.
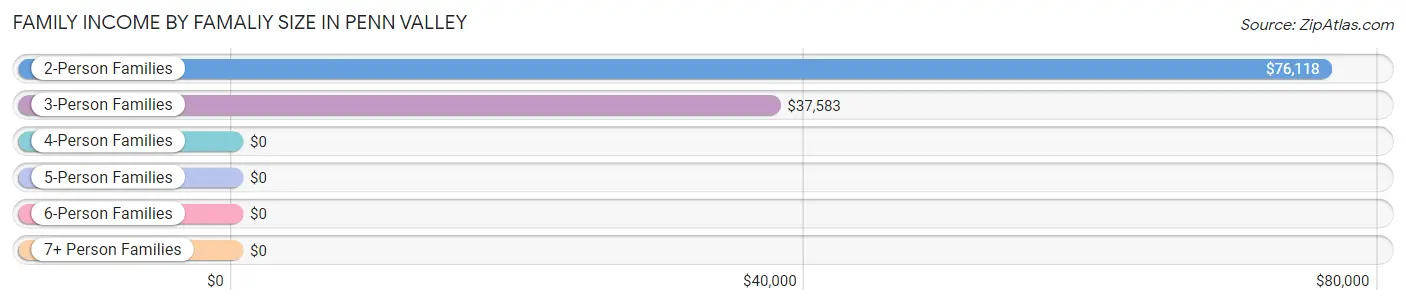
| Income Bracket | # Families | Median Income |
| 2-Person Families | 298 (74.7%) | $76,118 |
| 3-Person Families | 49 (12.3%) | $37,583 |
| 4-Person Families | 31 (7.8%) | $0 |
| 5-Person Families | 21 (5.3%) | $0 |
| 6-Person Families | 0 (0.0%) | $0 |
| 7+ Person Families | 0 (0.0%) | $0 |
| Total | 399 (100.0%) | $72,202 |
Family Income by Number of Earners in Penn Valley
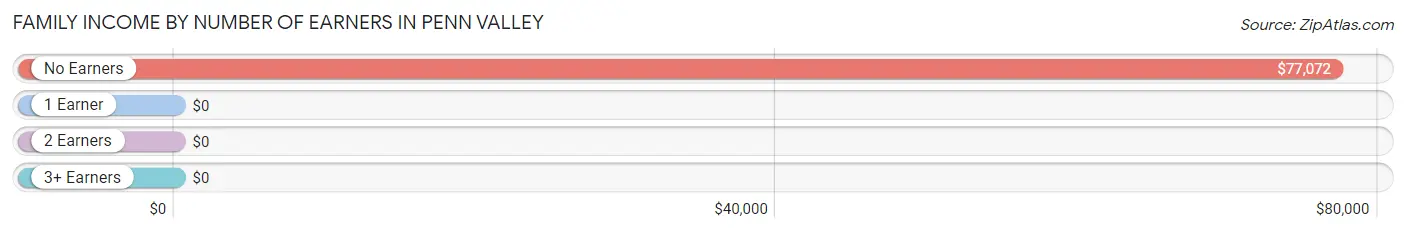
| Number of Earners | # Families | Median Income |
| No Earners | 193 (48.4%) | $77,072 |
| 1 Earner | 34 (8.5%) | $0 |
| 2 Earners | 172 (43.1%) | $0 |
| 3+ Earners | 0 (0.0%) | $0 |
| Total | 399 (100.0%) | $72,202 |
Household Income in Penn Valley
Household Income Brackets in Penn Valley
With 140 households falling in the category, the $75,000 to $99,999 income range is the most frequent in Penn Valley, accounting for 29.3% of all households.
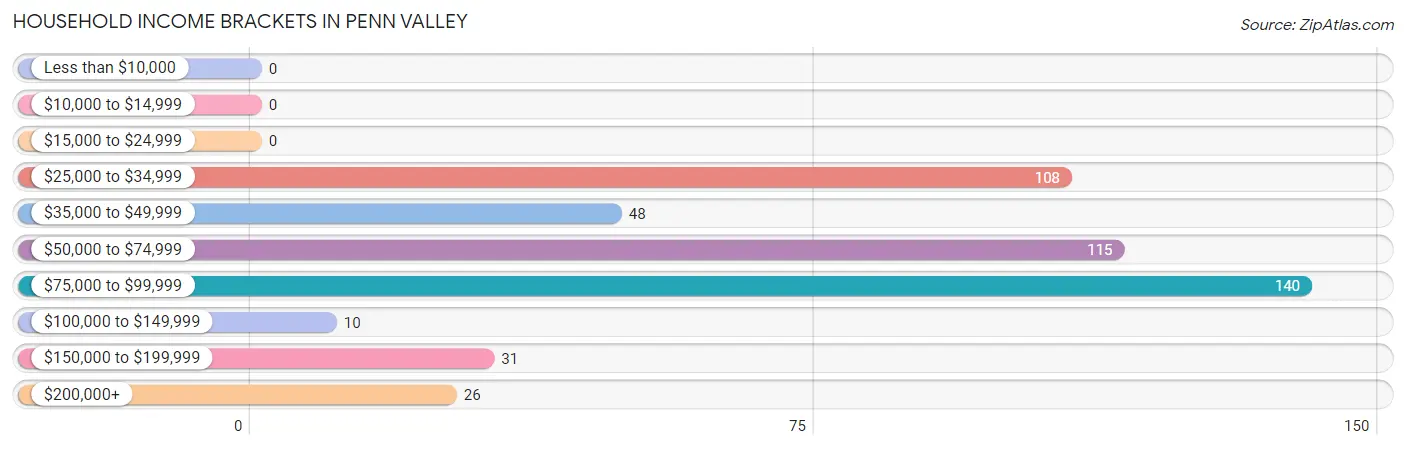
| Income Bracket | # Households | % Households |
| Less than $10,000 | 0 | 0.0% |
| $10,000 to $14,999 | 0 | 0.0% |
| $15,000 to $24,999 | 0 | 0.0% |
| $25,000 to $34,999 | 108 | 22.6% |
| $35,000 to $49,999 | 48 | 10.0% |
| $50,000 to $74,999 | 115 | 24.1% |
| $75,000 to $99,999 | 140 | 29.3% |
| $100,000 to $149,999 | 10 | 2.1% |
| $150,000 to $199,999 | 31 | 6.5% |
| $200,000+ | 26 | 5.4% |
Household Income by Householder Age in Penn Valley
The median household income in Penn Valley is $65,882, with the highest median household income of $70,060 found in the 65+ years age bracket for the primary householder. A total of 297 households (62.1%) fall into this category.
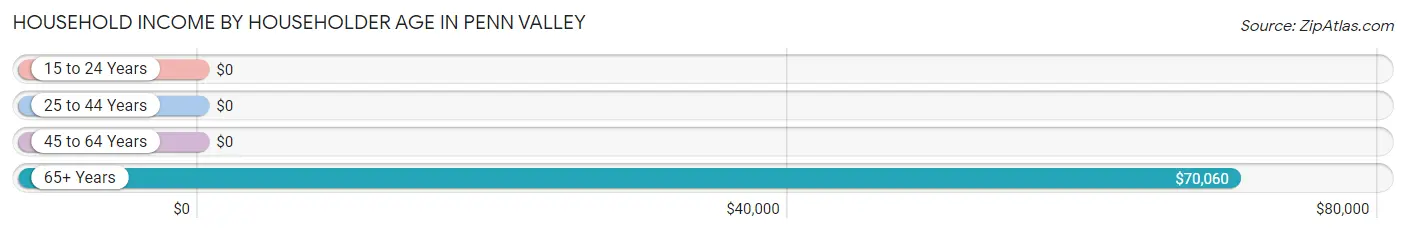
| Income Bracket | # Households | Median Income |
| 15 to 24 Years | 0 (0.0%) | $0 |
| 25 to 44 Years | 157 (32.9%) | $0 |
| 45 to 64 Years | 24 (5.0%) | $0 |
| 65+ Years | 297 (62.1%) | $70,060 |
| Total | 478 (100.0%) | $65,882 |
Poverty in Penn Valley
Income Below Poverty by Sex and Age in Penn Valley
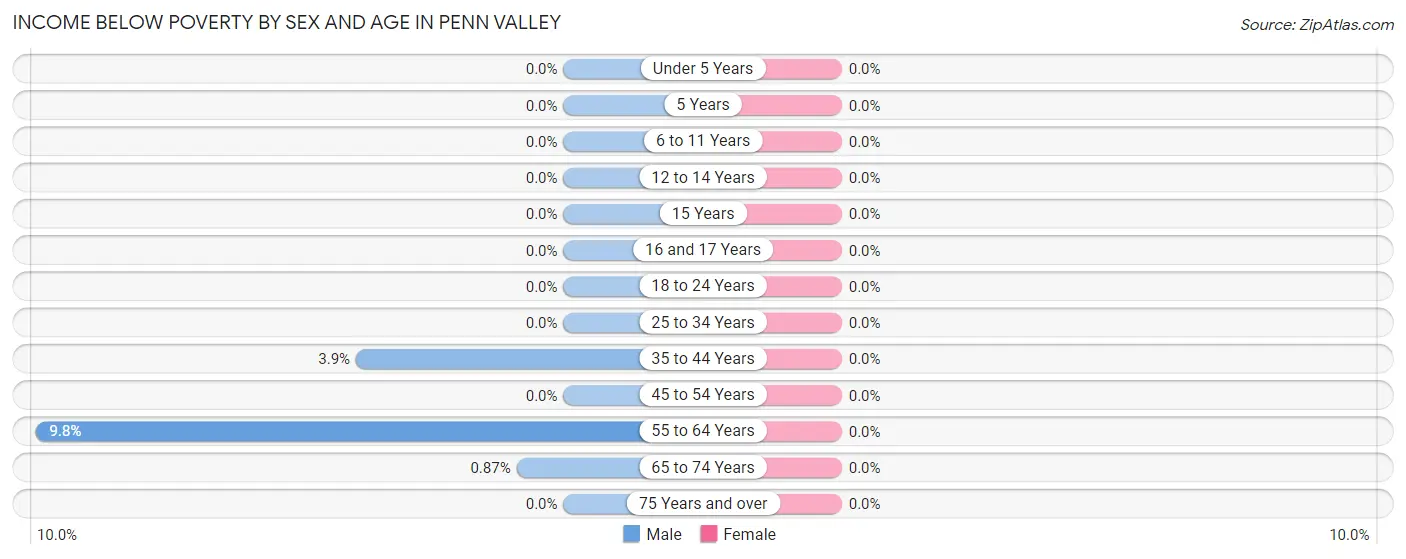
| Age Bracket | Male | Female |
| Under 5 Years | 0 (0.0%) | 0 (0.0%) |
| 5 Years | 0 (0.0%) | 0 (0.0%) |
| 6 to 11 Years | 0 (0.0%) | 0 (0.0%) |
| 12 to 14 Years | 0 (0.0%) | 0 (0.0%) |
| 15 Years | 0 (0.0%) | 0 (0.0%) |
| 16 and 17 Years | 0 (0.0%) | 0 (0.0%) |
| 18 to 24 Years | 0 (0.0%) | 0 (0.0%) |
| 25 to 34 Years | 0 (0.0%) | 0 (0.0%) |
| 35 to 44 Years | 5 (3.8%) | 0 (0.0%) |
| 45 to 54 Years | 0 (0.0%) | 0 (0.0%) |
| 55 to 64 Years | 9 (9.8%) | 0 (0.0%) |
| 65 to 74 Years | 2 (0.9%) | 0 (0.0%) |
| 75 Years and over | 0 (0.0%) | 0 (0.0%) |
| Total | 16 (2.8%) | 0 (0.0%) |
Income Above Poverty by Sex and Age in Penn Valley
According to the poverty statistics in Penn Valley, males aged under 5 years and females aged under 5 years are the age groups that are most secure financially, with 100.0% of males and 100.0% of females in these age groups living above the poverty line.
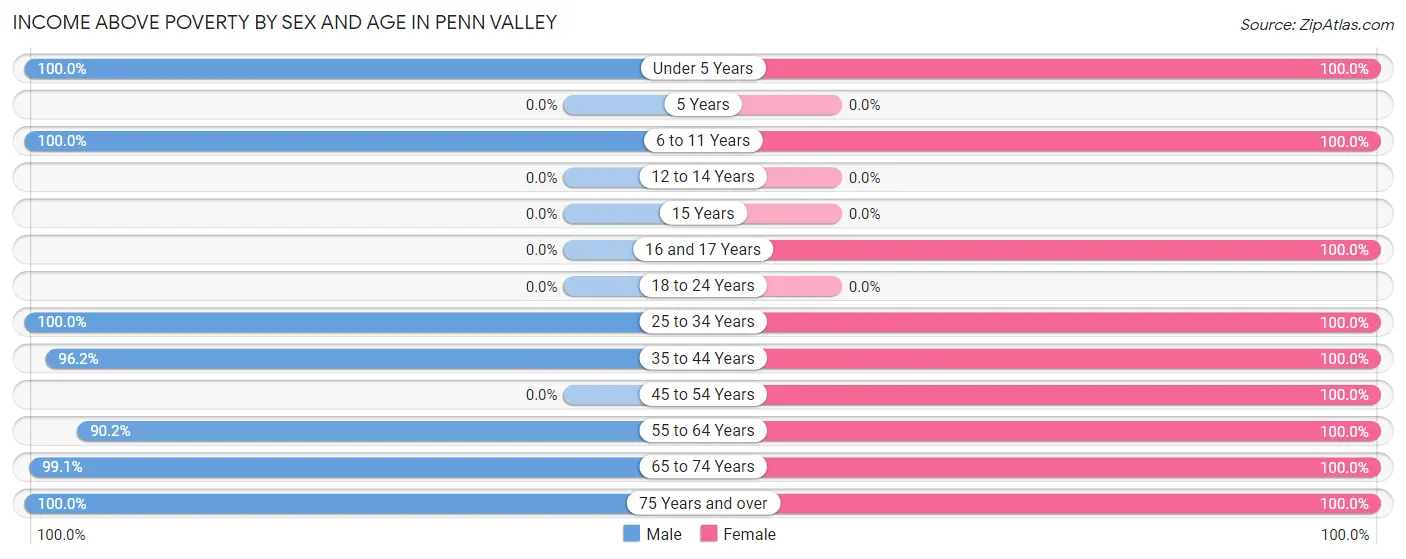
| Age Bracket | Male | Female |
| Under 5 Years | 29 (100.0%) | 14 (100.0%) |
| 5 Years | 0 (0.0%) | 0 (0.0%) |
| 6 to 11 Years | 40 (100.0%) | 53 (100.0%) |
| 12 to 14 Years | 0 (0.0%) | 0 (0.0%) |
| 15 Years | 0 (0.0%) | 0 (0.0%) |
| 16 and 17 Years | 0 (0.0%) | 25 (100.0%) |
| 18 to 24 Years | 0 (0.0%) | 0 (0.0%) |
| 25 to 34 Years | 36 (100.0%) | 92 (100.0%) |
| 35 to 44 Years | 125 (96.2%) | 109 (100.0%) |
| 45 to 54 Years | 0 (0.0%) | 45 (100.0%) |
| 55 to 64 Years | 83 (90.2%) | 67 (100.0%) |
| 65 to 74 Years | 227 (99.1%) | 58 (100.0%) |
| 75 Years and over | 21 (100.0%) | 148 (100.0%) |
| Total | 561 (97.2%) | 611 (100.0%) |
Income Below Poverty Among Married-Couple Families in Penn Valley
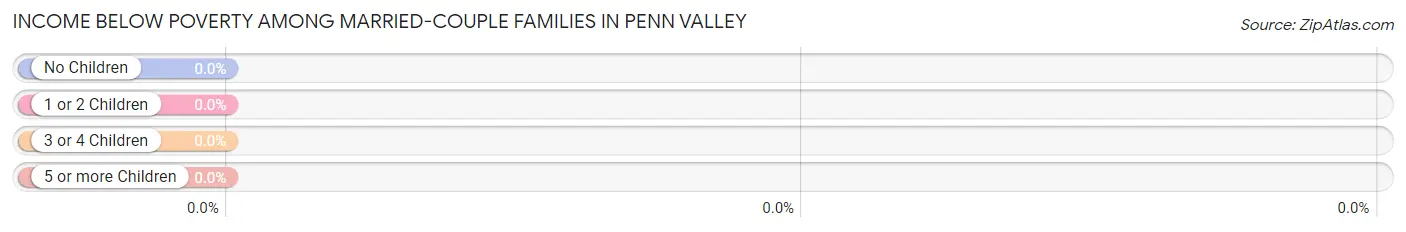
| Children | Above Poverty | Below Poverty |
| No Children | 250 (100.0%) | 0 (0.0%) |
| 1 or 2 Children | 67 (100.0%) | 0 (0.0%) |
| 3 or 4 Children | 0 (0.0%) | 0 (0.0%) |
| 5 or more Children | 0 (0.0%) | 0 (0.0%) |
| Total | 317 (100.0%) | 0 (0.0%) |
Income Below Poverty Among Single-Parent Households in Penn Valley
| Children | Single Father | Single Mother |
| No Children | 0 (0.0%) | 0 (0.0%) |
| 1 or 2 Children | 0 (0.0%) | 0 (0.0%) |
| 3 or 4 Children | 0 (0.0%) | 0 (0.0%) |
| 5 or more Children | 0 (0.0%) | 0 (0.0%) |
| Total | 0 (0.0%) | 0 (0.0%) |
Income Below Poverty Among Married-Couple vs Single-Parent Households in Penn Valley
| Children | Married-Couple Families | Single-Parent Households |
| No Children | 0 (0.0%) | 0 (0.0%) |
| 1 or 2 Children | 0 (0.0%) | 0 (0.0%) |
| 3 or 4 Children | 0 (0.0%) | 0 (0.0%) |
| 5 or more Children | 0 (0.0%) | 0 (0.0%) |
| Total | 0 (0.0%) | 0 (0.0%) |
Race in Penn Valley
The most populous races in Penn Valley are White / Caucasian (1,070 | 90.1%), Hispanic or Latino (86 | 7.2%), and Two or more Races (84 | 7.1%).
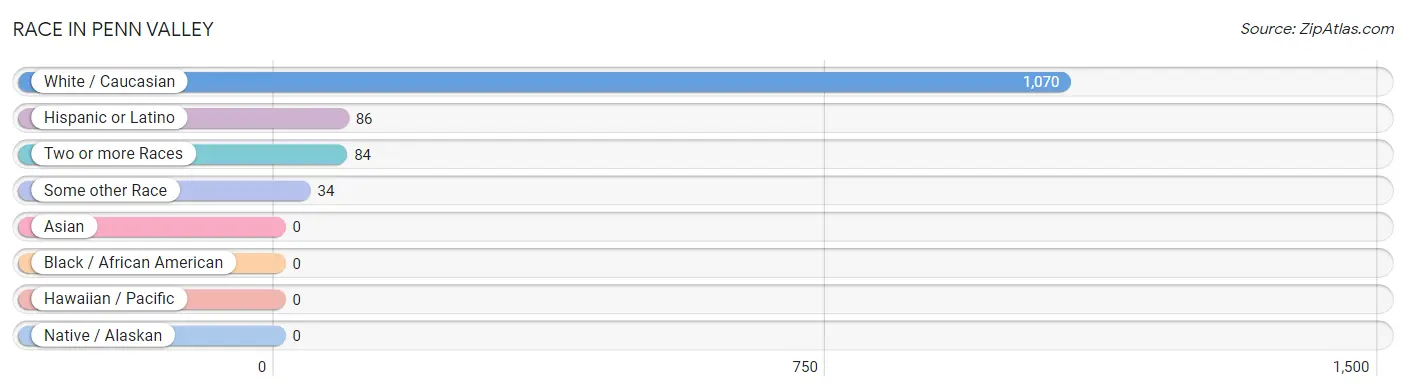
| Race | # Population | % Population |
| Asian | 0 | 0.0% |
| Black / African American | 0 | 0.0% |
| Hawaiian / Pacific | 0 | 0.0% |
| Hispanic or Latino | 86 | 7.2% |
| Native / Alaskan | 0 | 0.0% |
| White / Caucasian | 1,070 | 90.1% |
| Two or more Races | 84 | 7.1% |
| Some other Race | 34 | 2.9% |
| Total | 1,188 | 100.0% |
Ancestry in Penn Valley
The most populous ancestries reported in Penn Valley are English (204 | 17.2%), Norwegian (155 | 13.1%), German (123 | 10.3%), Austrian (90 | 7.6%), and Irish (76 | 6.4%), together accounting for 54.6% of all Penn Valley residents.
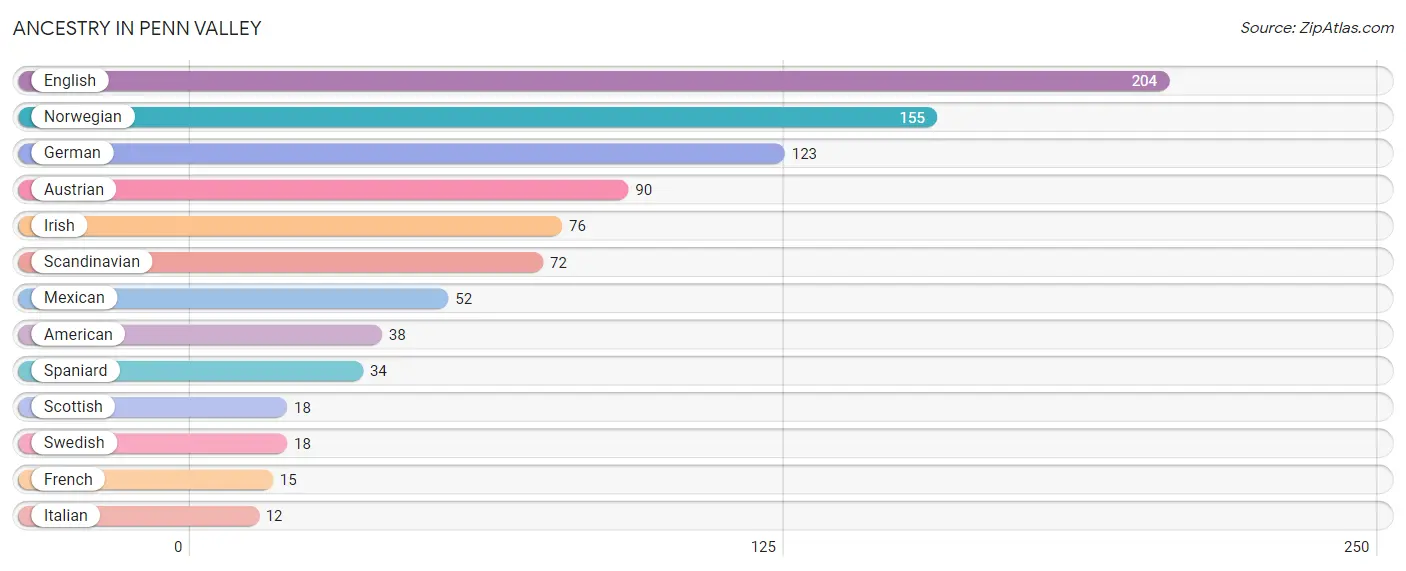
| Ancestry | # Population | % Population |
| American | 38 | 3.2% |
| Austrian | 90 | 7.6% |
| English | 204 | 17.2% |
| French | 15 | 1.3% |
| German | 123 | 10.3% |
| Irish | 76 | 6.4% |
| Italian | 12 | 1.0% |
| Mexican | 52 | 4.4% |
| Norwegian | 155 | 13.1% |
| Scandinavian | 72 | 6.1% |
| Scottish | 18 | 1.5% |
| Spaniard | 34 | 2.9% |
| Swedish | 18 | 1.5% | View All 13 Rows |
Immigrants in Penn Valley

| Immigration Origin | # Population | % Population | View All 0 Rows |
Sex and Age in Penn Valley
Sex and Age in Penn Valley
The most populous age groups in Penn Valley are 70 to 74 Years (126 | 21.8%) for men and 35 to 39 Years (77 | 12.6%) for women.
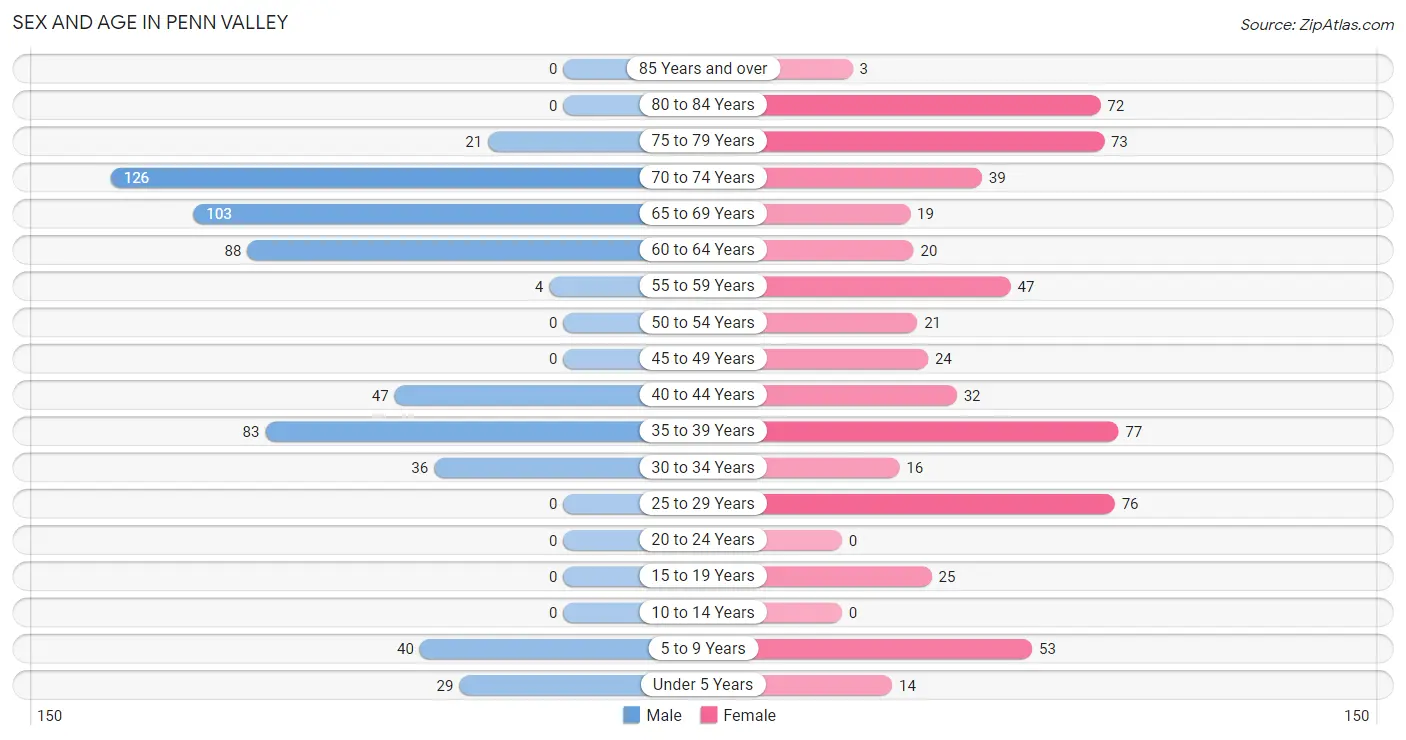
| Age Bracket | Male | Female |
| Under 5 Years | 29 (5.0%) | 14 (2.3%) |
| 5 to 9 Years | 40 (6.9%) | 53 (8.7%) |
| 10 to 14 Years | 0 (0.0%) | 0 (0.0%) |
| 15 to 19 Years | 0 (0.0%) | 25 (4.1%) |
| 20 to 24 Years | 0 (0.0%) | 0 (0.0%) |
| 25 to 29 Years | 0 (0.0%) | 76 (12.4%) |
| 30 to 34 Years | 36 (6.2%) | 16 (2.6%) |
| 35 to 39 Years | 83 (14.4%) | 77 (12.6%) |
| 40 to 44 Years | 47 (8.2%) | 32 (5.2%) |
| 45 to 49 Years | 0 (0.0%) | 24 (3.9%) |
| 50 to 54 Years | 0 (0.0%) | 21 (3.4%) |
| 55 to 59 Years | 4 (0.7%) | 47 (7.7%) |
| 60 to 64 Years | 88 (15.2%) | 20 (3.3%) |
| 65 to 69 Years | 103 (17.8%) | 19 (3.1%) |
| 70 to 74 Years | 126 (21.8%) | 39 (6.4%) |
| 75 to 79 Years | 21 (3.6%) | 73 (11.9%) |
| 80 to 84 Years | 0 (0.0%) | 72 (11.8%) |
| 85 Years and over | 0 (0.0%) | 3 (0.5%) |
| Total | 577 (100.0%) | 611 (100.0%) |
Families and Households in Penn Valley
Median Family Size in Penn Valley
The median family size in Penn Valley is 2.64 persons per family, with single male/father families (10 | 2.5%) accounting for the largest median family size of 3.4 persons per family. On the other hand, married-couple families (317 | 79.4%) represent the smallest median family size with 2.56 persons per family.
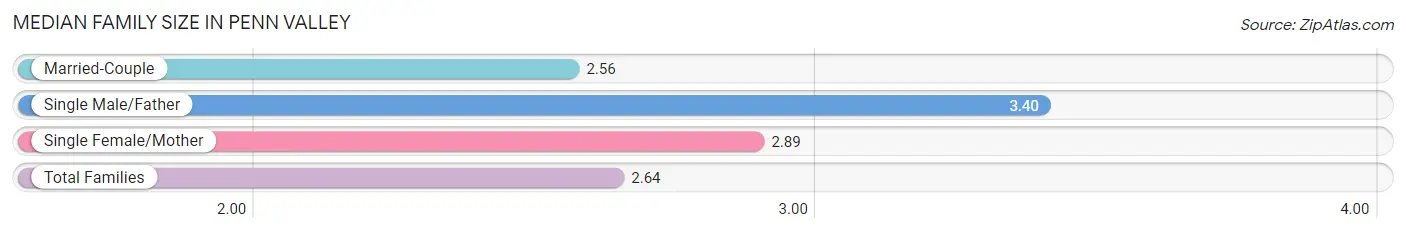
| Family Type | # Families | Family Size |
| Married-Couple | 317 (79.4%) | 2.56 |
| Single Male/Father | 10 (2.5%) | 3.40 |
| Single Female/Mother | 72 (18.0%) | 2.89 |
| Total Families | 399 (100.0%) | 2.64 |
Median Household Size in Penn Valley
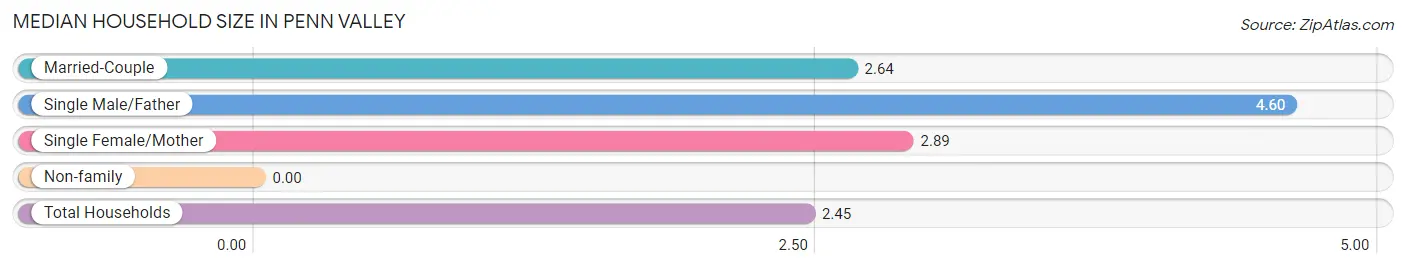
| Household Type | # Households | Household Size |
| Married-Couple | 317 (66.3%) | 2.64 |
| Single Male/Father | 10 (2.1%) | 4.60 |
| Single Female/Mother | 72 (15.1%) | 2.89 |
| Non-family | 79 (16.5%) | - |
| Total Households | 478 (100.0%) | 2.45 |
Household Size by Marriage Status in Penn Valley
Out of a total of 478 households in Penn Valley, 399 (83.5%) are family households, while 79 (16.5%) are nonfamily households. The most numerous type of family households are 2-person households, comprising 298, and the most common type of nonfamily households are 1-person households, comprising 79.
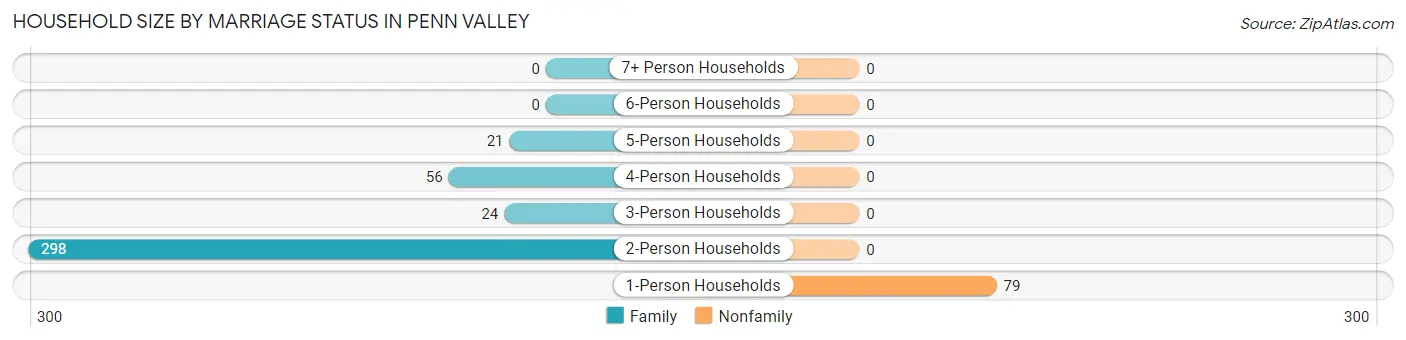
| Household Size | Family Households | Nonfamily Households |
| 1-Person Households | - | 79 (16.5%) |
| 2-Person Households | 298 (62.3%) | 0 (0.0%) |
| 3-Person Households | 24 (5.0%) | 0 (0.0%) |
| 4-Person Households | 56 (11.7%) | 0 (0.0%) |
| 5-Person Households | 21 (4.4%) | 0 (0.0%) |
| 6-Person Households | 0 (0.0%) | 0 (0.0%) |
| 7+ Person Households | 0 (0.0%) | 0 (0.0%) |
| Total | 399 (83.5%) | 79 (16.5%) |
Female Fertility in Penn Valley
Fertility by Age in Penn Valley
| Age Bracket | Women with Births | Births / 1,000 Women |
| 15 to 19 years | 0 (0.0%) | 0.0 |
| 20 to 34 years | 0 (0.0%) | 0.0 |
| 35 to 50 years | 0 (0.0%) | 0.0 |
| Total | 0 (0.0%) | 0.0 |
Fertility by Age by Marriage Status in Penn Valley
| Age Bracket | Married | Unmarried |
| 15 to 19 years | 0 (0.0%) | 0 (0.0%) |
| 20 to 34 years | 0 (0.0%) | 0 (0.0%) |
| 35 to 50 years | 0 (0.0%) | 0 (0.0%) |
| Total | 0 (0.0%) | 0 (0.0%) |
Fertility by Education in Penn Valley
| Educational Attainment | Women with Births | Births / 1,000 Women |
| Less than High School | 0 (0.0%) | 0.0 |
| High School Diploma | 0 (0.0%) | 0.0 |
| College or Associate's Degree | 0 (0.0%) | 0.0 |
| Bachelor's Degree | 0 (0.0%) | 0.0 |
| Graduate Degree | 0 (0.0%) | 0.0 |
| Total | 0 (0.0%) | 0.0 |
Fertility by Education by Marriage Status in Penn Valley
| Educational Attainment | Married | Unmarried |
| Less than High School | 0 (0.0%) | 0 (0.0%) |
| High School Diploma | 0 (0.0%) | 0 (0.0%) |
| College or Associate's Degree | 0 (0.0%) | 0 (0.0%) |
| Bachelor's Degree | 0 (0.0%) | 0 (0.0%) |
| Graduate Degree | 0 (0.0%) | 0 (0.0%) |
| Total | 0 (0.0%) | 0 (0.0%) |
Employment Characteristics in Penn Valley
Employment by Class of Employer in Penn Valley
Among the 502 employed individuals in Penn Valley, private company employees (265 | 52.8%), self-employed (not incorporated) (92 | 18.3%), and not-for-profit organizations (90 | 17.9%) make up the most common classes of employment.
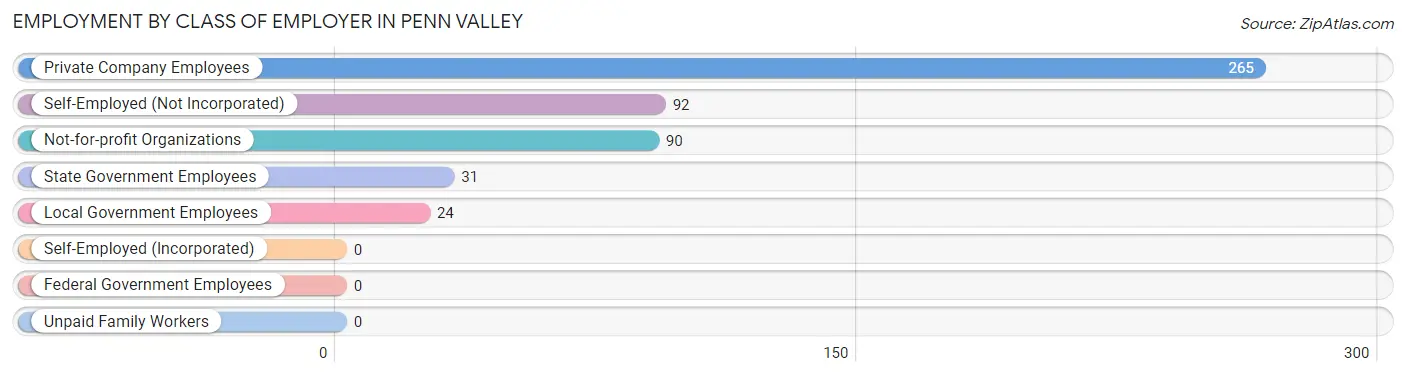
| Employer Class | # Employees | % Employees |
| Private Company Employees | 265 | 52.8% |
| Self-Employed (Incorporated) | 0 | 0.0% |
| Self-Employed (Not Incorporated) | 92 | 18.3% |
| Not-for-profit Organizations | 90 | 17.9% |
| Local Government Employees | 24 | 4.8% |
| State Government Employees | 31 | 6.2% |
| Federal Government Employees | 0 | 0.0% |
| Unpaid Family Workers | 0 | 0.0% |
| Total | 502 | 100.0% |
Employment Status by Age in Penn Valley
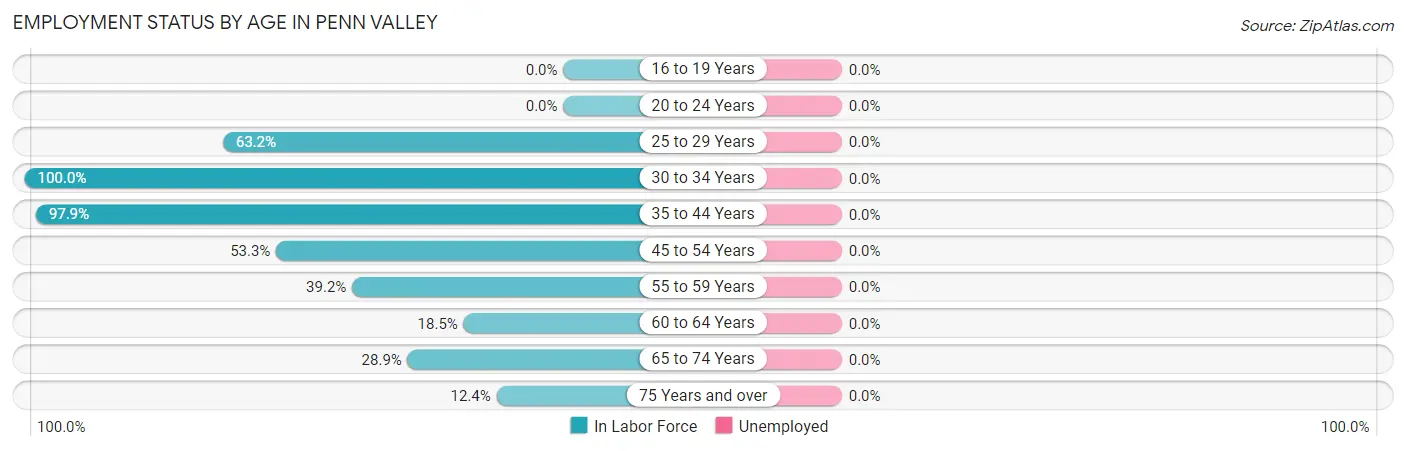
| Age Bracket | In Labor Force | Unemployed |
| 16 to 19 Years | 0 (0.0%) | 0 (0.0%) |
| 20 to 24 Years | 0 (0.0%) | 0 (0.0%) |
| 25 to 29 Years | 48 (63.2%) | 0 (0.0%) |
| 30 to 34 Years | 52 (100.0%) | 0 (0.0%) |
| 35 to 44 Years | 234 (97.9%) | 0 (0.0%) |
| 45 to 54 Years | 24 (53.3%) | 0 (0.0%) |
| 55 to 59 Years | 20 (39.2%) | 0 (0.0%) |
| 60 to 64 Years | 20 (18.5%) | 0 (0.0%) |
| 65 to 74 Years | 83 (28.9%) | 0 (0.0%) |
| 75 Years and over | 21 (12.4%) | 0 (0.0%) |
| Total | 502 (47.7%) | 0 (0.0%) |
Employment Status by Educational Attainment in Penn Valley
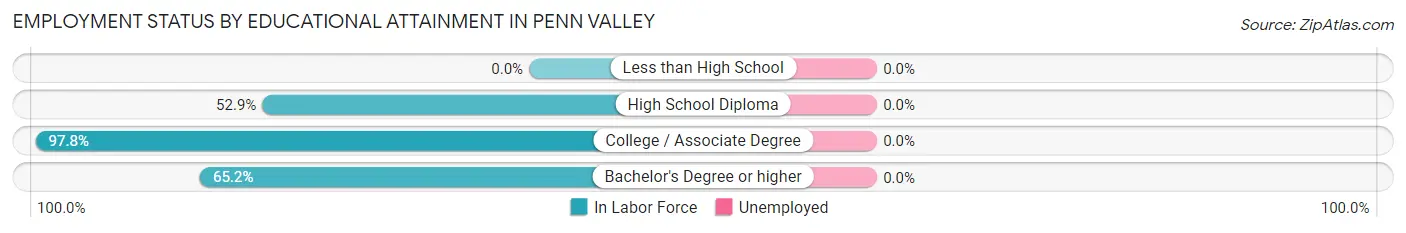
| Educational Attainment | In Labor Force | Unemployed |
| Less than High School | 0 (0.0%) | 0 (0.0%) |
| High School Diploma | 117 (52.9%) | 0 (0.0%) |
| College / Associate Degree | 223 (97.8%) | 0 (0.0%) |
| Bachelor's Degree or higher | 58 (65.2%) | 0 (0.0%) |
| Total | 398 (69.7%) | 0 (0.0%) |
Employment Occupations by Sex in Penn Valley
Management, Business, Science and Arts Occupations
The most common Management, Business, Science and Arts occupations in Penn Valley are Management (50 | 10.0%), Health Diagnosing & Treating (48 | 9.6%), Health Technologists (48 | 9.6%), Community & Social Service (36 | 7.2%), and Education, Arts & Media (36 | 7.2%).
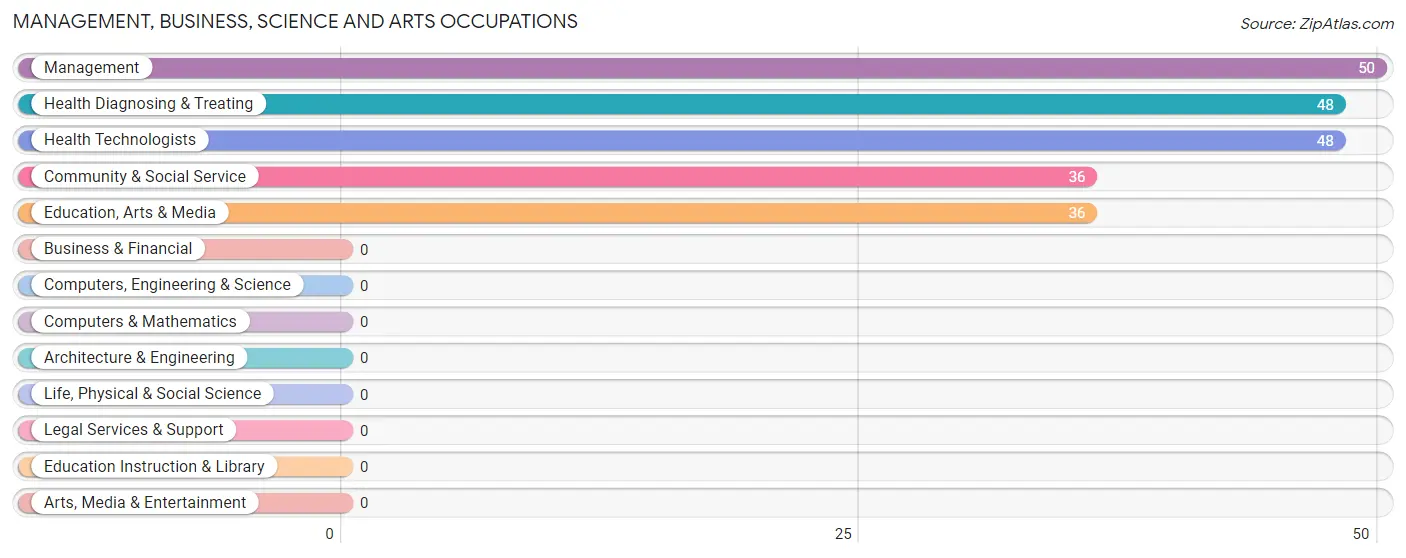
Management, Business, Science and Arts Occupations by Sex
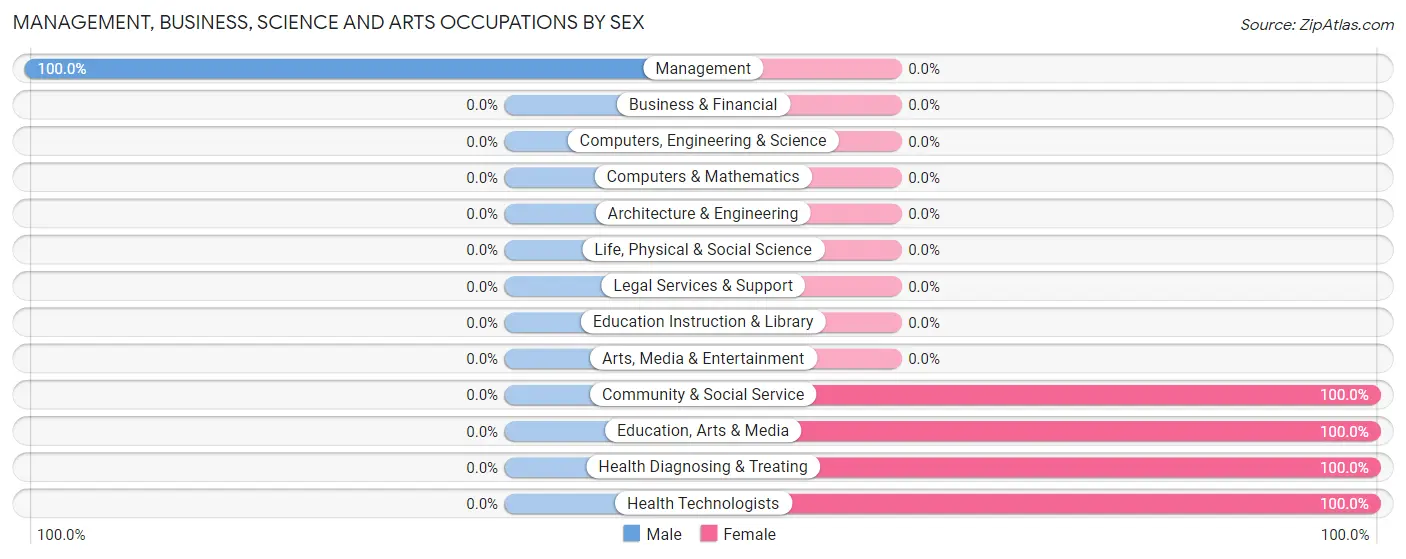
| Occupation | Male | Female |
| Management | 50 (100.0%) | 0 (0.0%) |
| Business & Financial | 0 (0.0%) | 0 (0.0%) |
| Computers, Engineering & Science | 0 (0.0%) | 0 (0.0%) |
| Computers & Mathematics | 0 (0.0%) | 0 (0.0%) |
| Architecture & Engineering | 0 (0.0%) | 0 (0.0%) |
| Life, Physical & Social Science | 0 (0.0%) | 0 (0.0%) |
| Community & Social Service | 0 (0.0%) | 36 (100.0%) |
| Education, Arts & Media | 0 (0.0%) | 36 (100.0%) |
| Legal Services & Support | 0 (0.0%) | 0 (0.0%) |
| Education Instruction & Library | 0 (0.0%) | 0 (0.0%) |
| Arts, Media & Entertainment | 0 (0.0%) | 0 (0.0%) |
| Health Diagnosing & Treating | 0 (0.0%) | 48 (100.0%) |
| Health Technologists | 0 (0.0%) | 48 (100.0%) |
| Total (Category) | 50 (37.3%) | 84 (62.7%) |
| Total (Overall) | 269 (53.6%) | 233 (46.4%) |
Services Occupations
The most common Services occupations in Penn Valley are Healthcare Support (24 | 4.8%), and Food Preparation & Serving (15 | 3.0%).
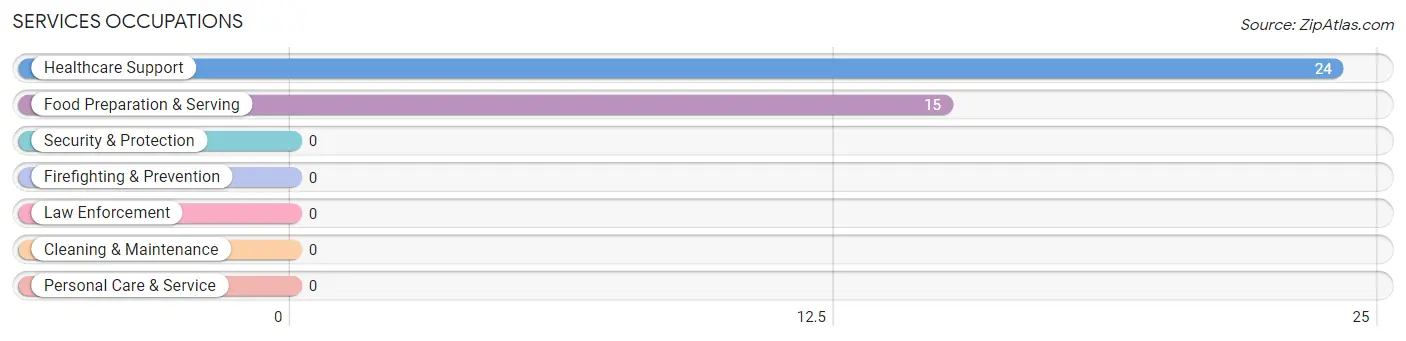
Services Occupations by Sex
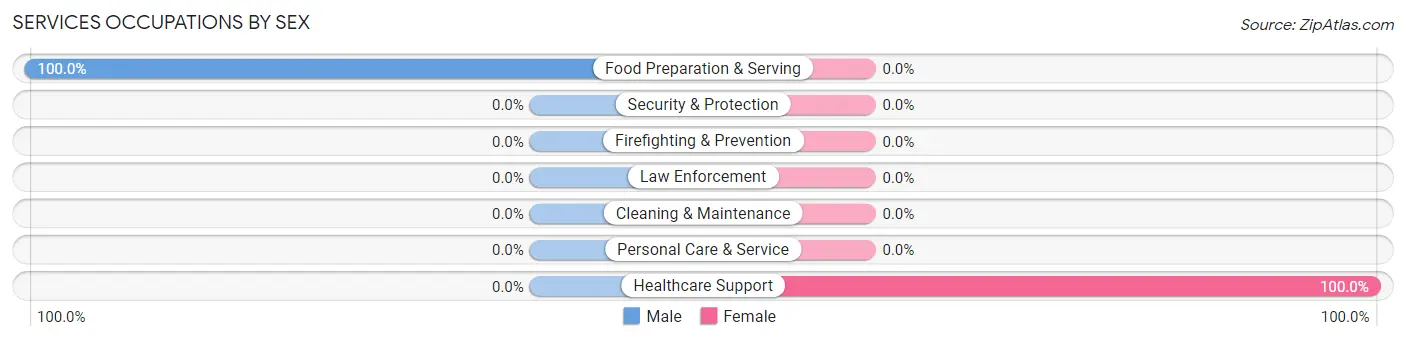
| Occupation | Male | Female |
| Healthcare Support | 0 (0.0%) | 24 (100.0%) |
| Security & Protection | 0 (0.0%) | 0 (0.0%) |
| Firefighting & Prevention | 0 (0.0%) | 0 (0.0%) |
| Law Enforcement | 0 (0.0%) | 0 (0.0%) |
| Food Preparation & Serving | 15 (100.0%) | 0 (0.0%) |
| Cleaning & Maintenance | 0 (0.0%) | 0 (0.0%) |
| Personal Care & Service | 0 (0.0%) | 0 (0.0%) |
| Total (Category) | 15 (38.5%) | 24 (61.5%) |
| Total (Overall) | 269 (53.6%) | 233 (46.4%) |
Sales and Office Occupations
The most common Sales and Office occupations in Penn Valley are Office & Administration (113 | 22.5%), and Sales & Related (12 | 2.4%).
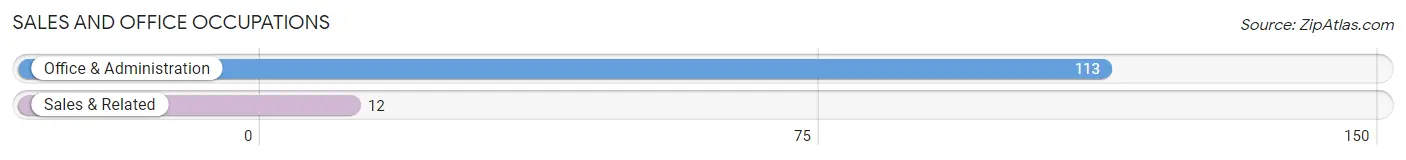
Sales and Office Occupations by Sex
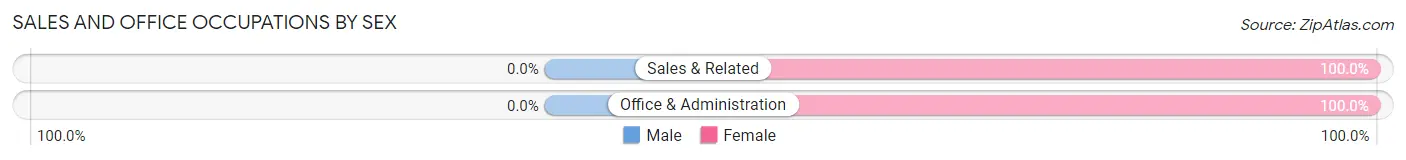
| Occupation | Male | Female |
| Sales & Related | 0 (0.0%) | 12 (100.0%) |
| Office & Administration | 0 (0.0%) | 113 (100.0%) |
| Total (Category) | 0 (0.0%) | 125 (100.0%) |
| Total (Overall) | 269 (53.6%) | 233 (46.4%) |
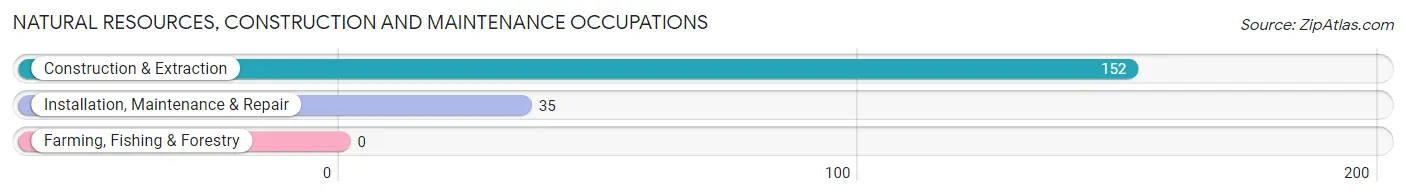
Natural Resources, Construction and Maintenance Occupations
The most common Natural Resources, Construction and Maintenance occupations in Penn Valley are Construction & Extraction (152 | 30.3%), and Installation, Maintenance & Repair (35 | 7.0%).
Natural Resources, Construction and Maintenance Occupations by Sex
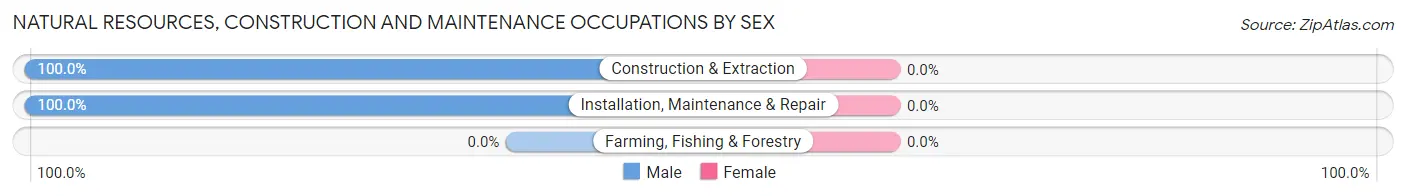
| Occupation | Male | Female |
| Farming, Fishing & Forestry | 0 (0.0%) | 0 (0.0%) |
| Construction & Extraction | 152 (100.0%) | 0 (0.0%) |
| Installation, Maintenance & Repair | 35 (100.0%) | 0 (0.0%) |
| Total (Category) | 187 (100.0%) | 0 (0.0%) |
| Total (Overall) | 269 (53.6%) | 233 (46.4%) |
Production, Transportation and Moving Occupations
The most common Production, Transportation and Moving occupations in Penn Valley are , and Transportation (17 | 3.4%).
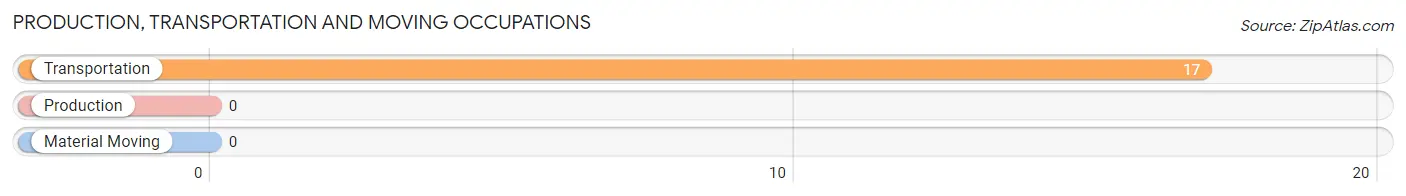
Production, Transportation and Moving Occupations by Sex
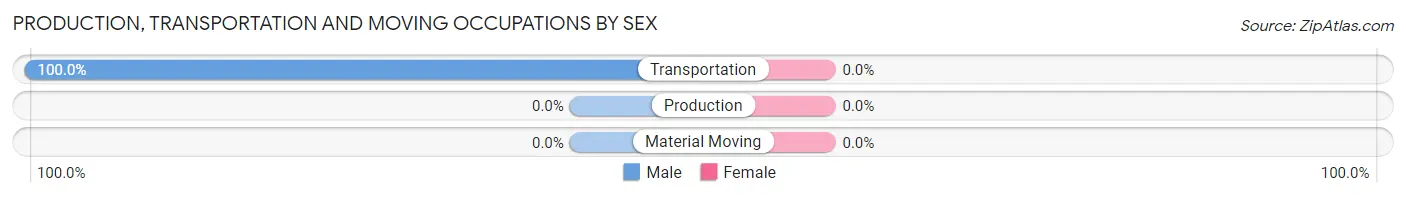
| Occupation | Male | Female |
| Production | 0 (0.0%) | 0 (0.0%) |
| Transportation | 17 (100.0%) | 0 (0.0%) |
| Material Moving | 0 (0.0%) | 0 (0.0%) |
| Total (Category) | 17 (100.0%) | 0 (0.0%) |
| Total (Overall) | 269 (53.6%) | 233 (46.4%) |
Employment Industries by Sex in Penn Valley
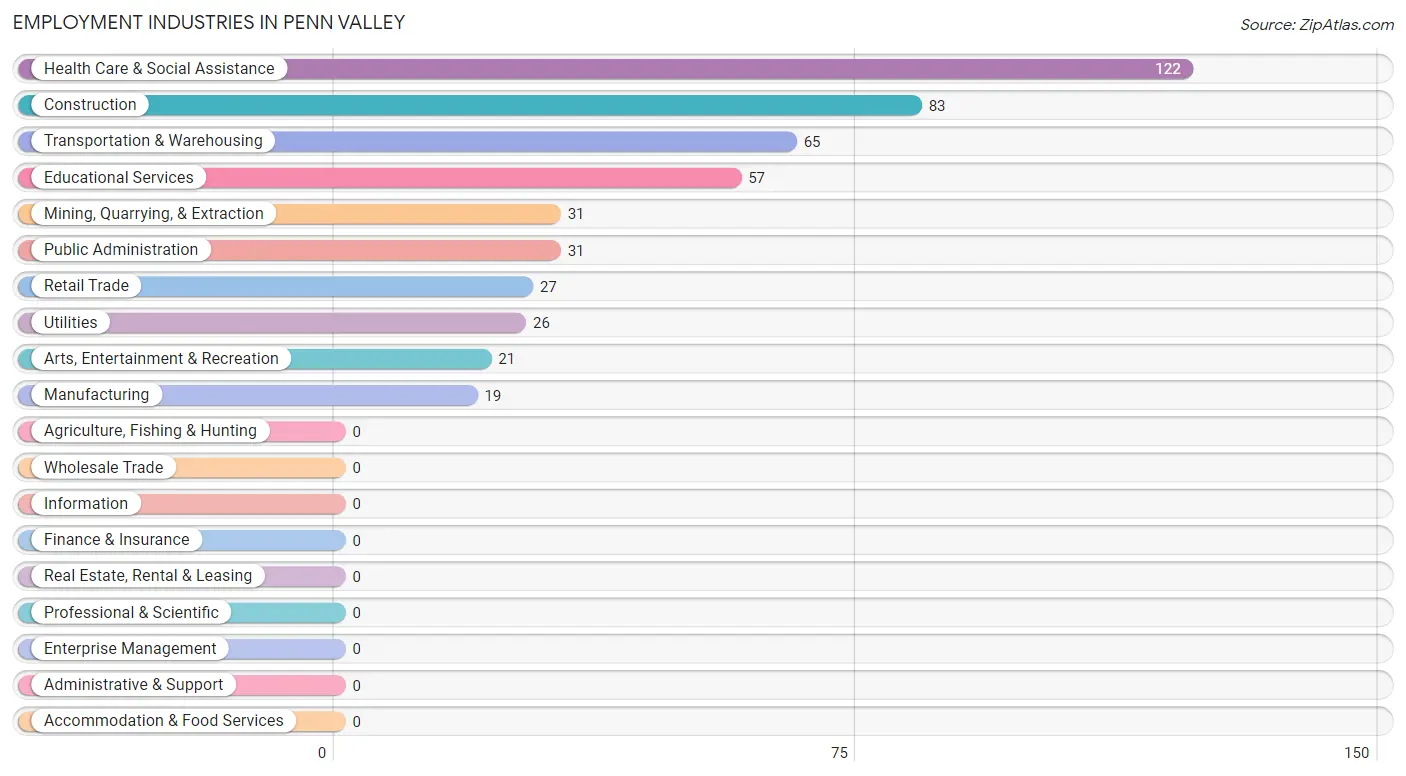
Employment Industries in Penn Valley
The major employment industries in Penn Valley include Health Care & Social Assistance (122 | 24.3%), Construction (83 | 16.5%), Transportation & Warehousing (65 | 13.0%), Educational Services (57 | 11.4%), and Mining, Quarrying, & Extraction (31 | 6.2%).
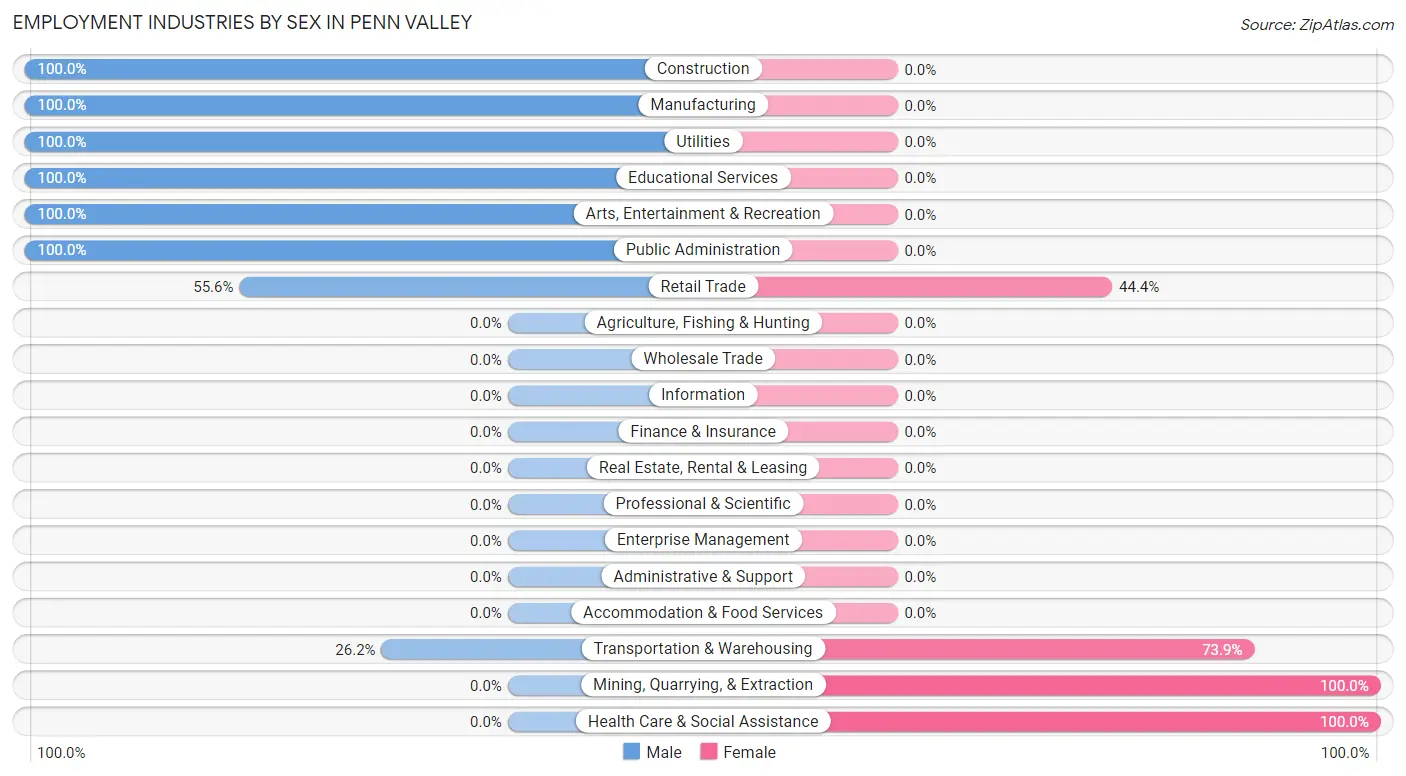
Employment Industries by Sex in Penn Valley
The Penn Valley industries that see more men than women are Construction (100.0%), Manufacturing (100.0%), and Utilities (100.0%), whereas the industries that tend to have a higher number of women are Mining, Quarrying, & Extraction (100.0%), Health Care & Social Assistance (100.0%), and Transportation & Warehousing (73.9%).
| Industry | Male | Female |
| Agriculture, Fishing & Hunting | 0 (0.0%) | 0 (0.0%) |
| Mining, Quarrying, & Extraction | 0 (0.0%) | 31 (100.0%) |
| Construction | 83 (100.0%) | 0 (0.0%) |
| Manufacturing | 19 (100.0%) | 0 (0.0%) |
| Wholesale Trade | 0 (0.0%) | 0 (0.0%) |
| Retail Trade | 15 (55.6%) | 12 (44.4%) |
| Transportation & Warehousing | 17 (26.2%) | 48 (73.9%) |
| Utilities | 26 (100.0%) | 0 (0.0%) |
| Information | 0 (0.0%) | 0 (0.0%) |
| Finance & Insurance | 0 (0.0%) | 0 (0.0%) |
| Real Estate, Rental & Leasing | 0 (0.0%) | 0 (0.0%) |
| Professional & Scientific | 0 (0.0%) | 0 (0.0%) |
| Enterprise Management | 0 (0.0%) | 0 (0.0%) |
| Administrative & Support | 0 (0.0%) | 0 (0.0%) |
| Educational Services | 57 (100.0%) | 0 (0.0%) |
| Health Care & Social Assistance | 0 (0.0%) | 122 (100.0%) |
| Arts, Entertainment & Recreation | 21 (100.0%) | 0 (0.0%) |
| Accommodation & Food Services | 0 (0.0%) | 0 (0.0%) |
| Public Administration | 31 (100.0%) | 0 (0.0%) |
| Total | 269 (53.6%) | 233 (46.4%) |
Education in Penn Valley
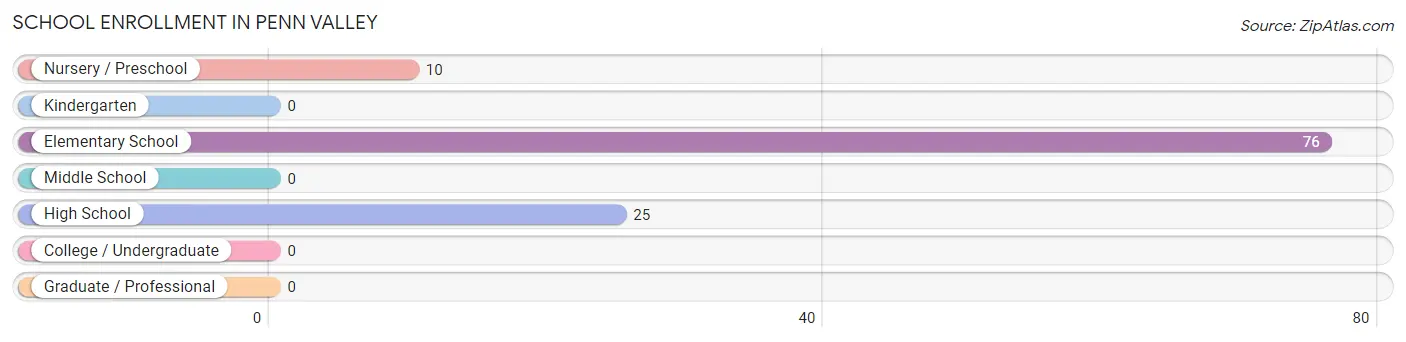
School Enrollment in Penn Valley
The most common levels of schooling among the 111 students in Penn Valley are elementary school (76 | 68.5%), high school (25 | 22.5%), and nursery / preschool (10 | 9.0%).
| School Level | # Students | % Students |
| Nursery / Preschool | 10 | 9.0% |
| Kindergarten | 0 | 0.0% |
| Elementary School | 76 | 68.5% |
| Middle School | 0 | 0.0% |
| High School | 25 | 22.5% |
| College / Undergraduate | 0 | 0.0% |
| Graduate / Professional | 0 | 0.0% |
| Total | 111 | 100.0% |
School Enrollment by Age by Funding Source in Penn Valley
Out of a total of 111 students who are enrolled in schools in Penn Valley, 10 (9.0%) attend a private institution, while the remaining 101 (91.0%) are enrolled in public schools. The age group of 3 to 4 year olds has the highest likelihood of being enrolled in private schools, with 10 (100.0% in the age bracket) enrolled. Conversely, the age group of 5 to 9 year old has the lowest likelihood of being enrolled in a private school, with 76 (100.0% in the age bracket) attending a public institution.
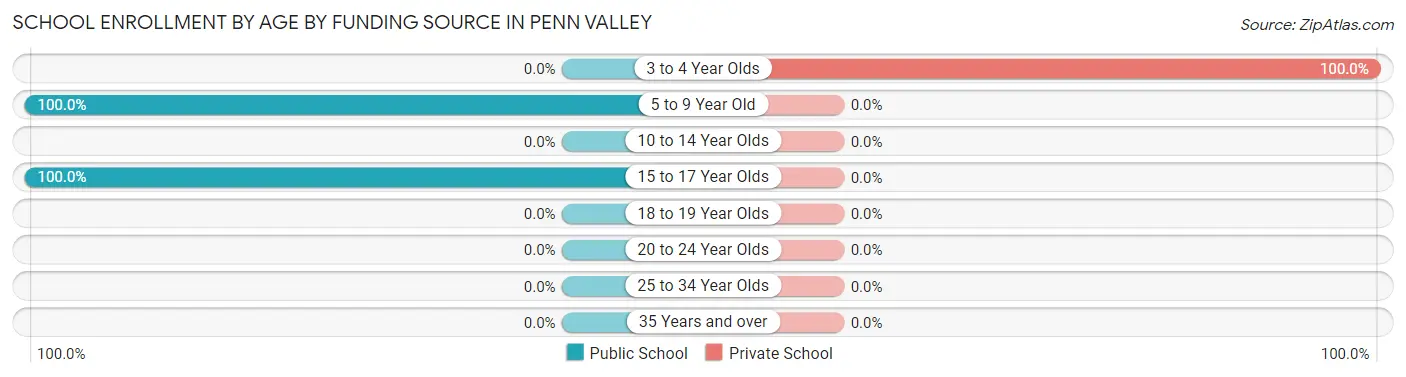
| Age Bracket | Public School | Private School |
| 3 to 4 Year Olds | 0 (0.0%) | 10 (100.0%) |
| 5 to 9 Year Old | 76 (100.0%) | 0 (0.0%) |
| 10 to 14 Year Olds | 0 (0.0%) | 0 (0.0%) |
| 15 to 17 Year Olds | 25 (100.0%) | 0 (0.0%) |
| 18 to 19 Year Olds | 0 (0.0%) | 0 (0.0%) |
| 20 to 24 Year Olds | 0 (0.0%) | 0 (0.0%) |
| 25 to 34 Year Olds | 0 (0.0%) | 0 (0.0%) |
| 35 Years and over | 0 (0.0%) | 0 (0.0%) |
| Total | 101 (91.0%) | 10 (9.0%) |
Educational Attainment by Field of Study in Penn Valley
Social sciences (86 | 46.2%), education (39 | 21.0%), visual & performing arts (31 | 16.7%), psychology (20 | 10.7%), and communications (10 | 5.4%) are the most common fields of study among 186 individuals in Penn Valley who have obtained a bachelor's degree or higher.
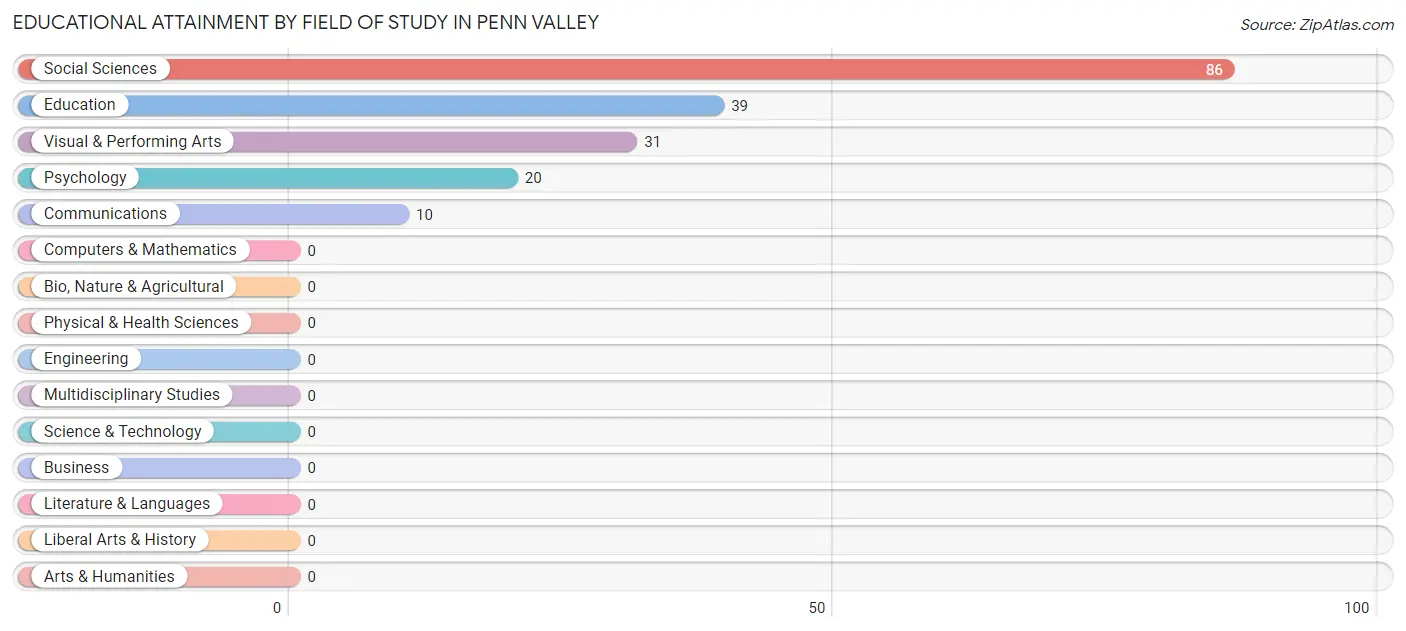
| Field of Study | # Graduates | % Graduates |
| Computers & Mathematics | 0 | 0.0% |
| Bio, Nature & Agricultural | 0 | 0.0% |
| Physical & Health Sciences | 0 | 0.0% |
| Psychology | 20 | 10.7% |
| Social Sciences | 86 | 46.2% |
| Engineering | 0 | 0.0% |
| Multidisciplinary Studies | 0 | 0.0% |
| Science & Technology | 0 | 0.0% |
| Business | 0 | 0.0% |
| Education | 39 | 21.0% |
| Literature & Languages | 0 | 0.0% |
| Liberal Arts & History | 0 | 0.0% |
| Visual & Performing Arts | 31 | 16.7% |
| Communications | 10 | 5.4% |
| Arts & Humanities | 0 | 0.0% |
| Total | 186 | 100.0% |
Transportation & Commute in Penn Valley
Vehicle Availability by Sex in Penn Valley
The most prevalent vehicle ownership categories in Penn Valley are males with 1 vehicle (126, accounting for 47.5%) and females with 1 vehicle (64, making up 54.1%).
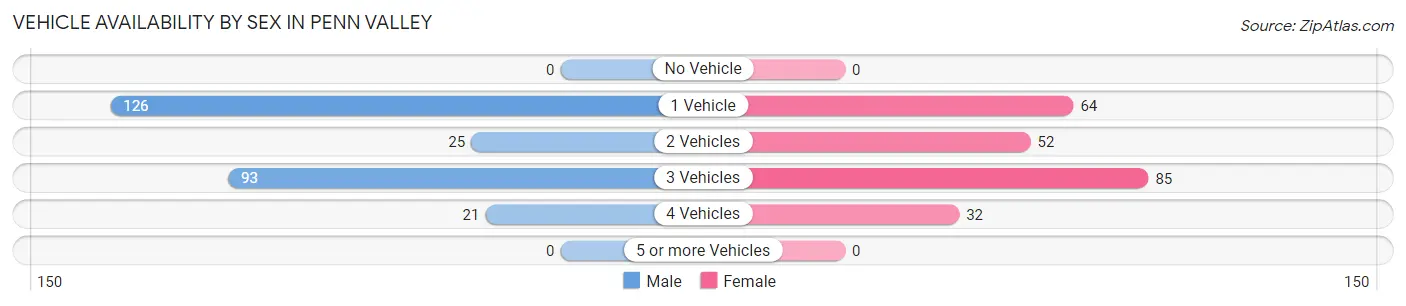
| Vehicles Available | Male | Female |
| No Vehicle | 0 (0.0%) | 0 (0.0%) |
| 1 Vehicle | 126 (47.5%) | 64 (27.5%) |
| 2 Vehicles | 25 (9.4%) | 52 (22.3%) |
| 3 Vehicles | 93 (35.1%) | 85 (36.5%) |
| 4 Vehicles | 21 (7.9%) | 32 (13.7%) |
| 5 or more Vehicles | 0 (0.0%) | 0 (0.0%) |
| Total | 265 (100.0%) | 233 (100.0%) |
Commute Time in Penn Valley
The most frequently occuring commute durations in Penn Valley are 90 or more minutes (161 commuters, 32.1%), 15 to 19 minutes (149 commuters, 29.7%), and 20 to 24 minutes (109 commuters, 21.7%).
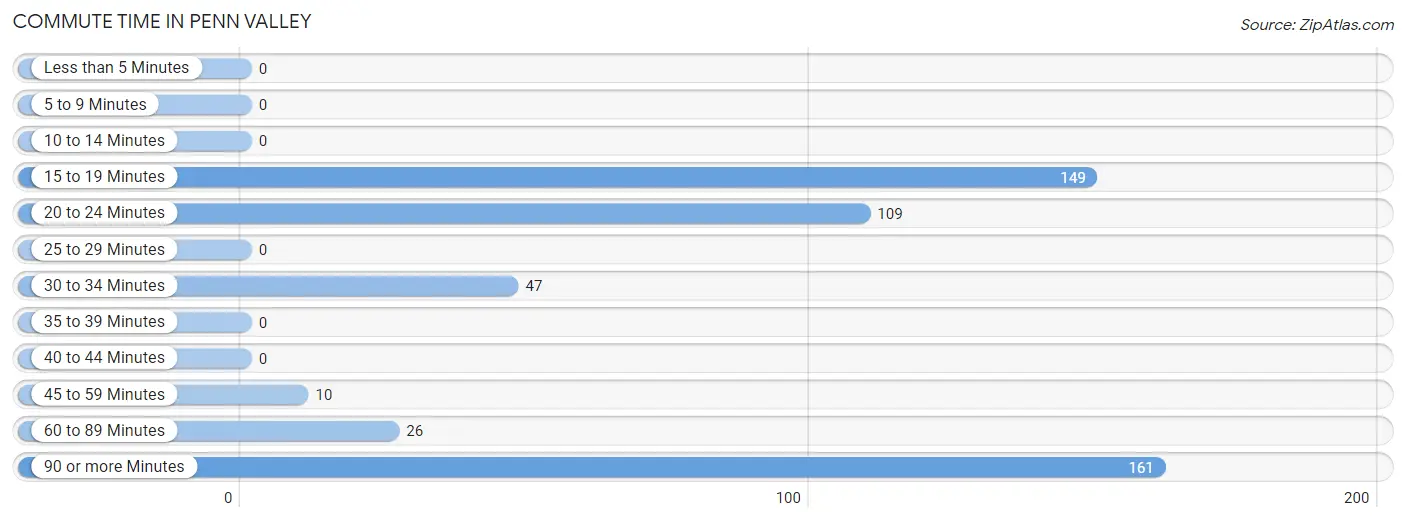
| Commute Time | # Commuters | % Commuters |
| Less than 5 Minutes | 0 | 0.0% |
| 5 to 9 Minutes | 0 | 0.0% |
| 10 to 14 Minutes | 0 | 0.0% |
| 15 to 19 Minutes | 149 | 29.7% |
| 20 to 24 Minutes | 109 | 21.7% |
| 25 to 29 Minutes | 0 | 0.0% |
| 30 to 34 Minutes | 47 | 9.4% |
| 35 to 39 Minutes | 0 | 0.0% |
| 40 to 44 Minutes | 0 | 0.0% |
| 45 to 59 Minutes | 10 | 2.0% |
| 60 to 89 Minutes | 26 | 5.2% |
| 90 or more Minutes | 161 | 32.1% |
Commute Time by Sex in Penn Valley
The most common commute times in Penn Valley are 90 or more minutes (102 commuters, 37.9%) for males and 15 to 19 minutes (120 commuters, 51.5%) for females.
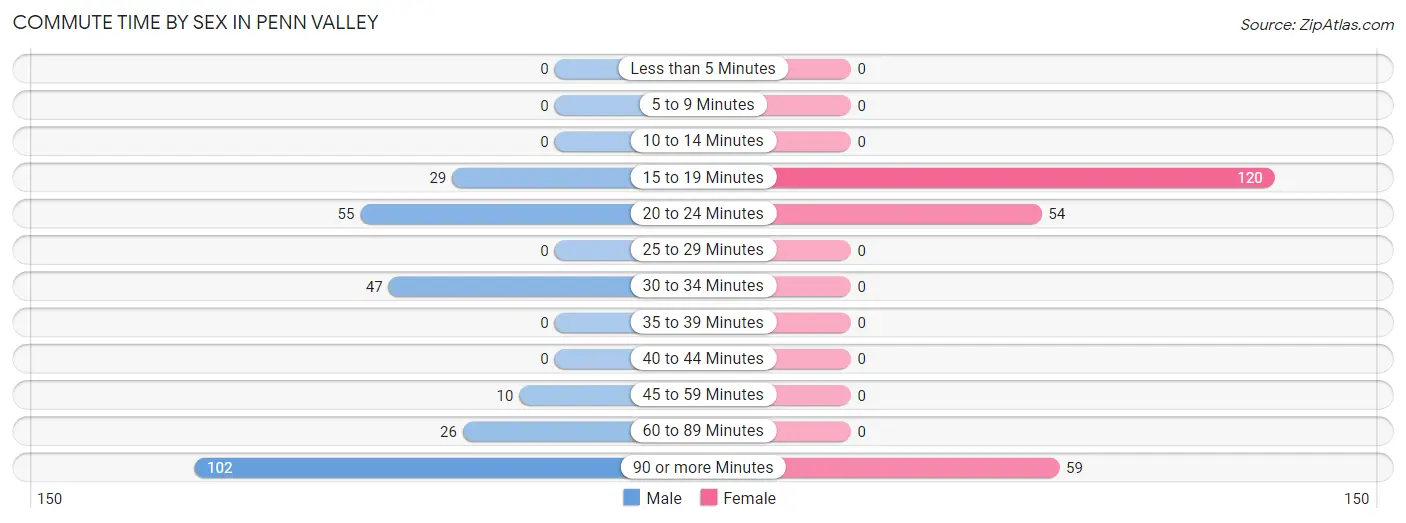
| Commute Time | Male | Female |
| Less than 5 Minutes | 0 (0.0%) | 0 (0.0%) |
| 5 to 9 Minutes | 0 (0.0%) | 0 (0.0%) |
| 10 to 14 Minutes | 0 (0.0%) | 0 (0.0%) |
| 15 to 19 Minutes | 29 (10.8%) | 120 (51.5%) |
| 20 to 24 Minutes | 55 (20.4%) | 54 (23.2%) |
| 25 to 29 Minutes | 0 (0.0%) | 0 (0.0%) |
| 30 to 34 Minutes | 47 (17.5%) | 0 (0.0%) |
| 35 to 39 Minutes | 0 (0.0%) | 0 (0.0%) |
| 40 to 44 Minutes | 0 (0.0%) | 0 (0.0%) |
| 45 to 59 Minutes | 10 (3.7%) | 0 (0.0%) |
| 60 to 89 Minutes | 26 (9.7%) | 0 (0.0%) |
| 90 or more Minutes | 102 (37.9%) | 59 (25.3%) |
Time of Departure to Work by Sex in Penn Valley
The most frequent times of departure to work in Penn Valley are 5:00 AM to 5:29 AM (102, 37.9%) for males and 7:30 AM to 7:59 AM (102, 43.8%) for females.
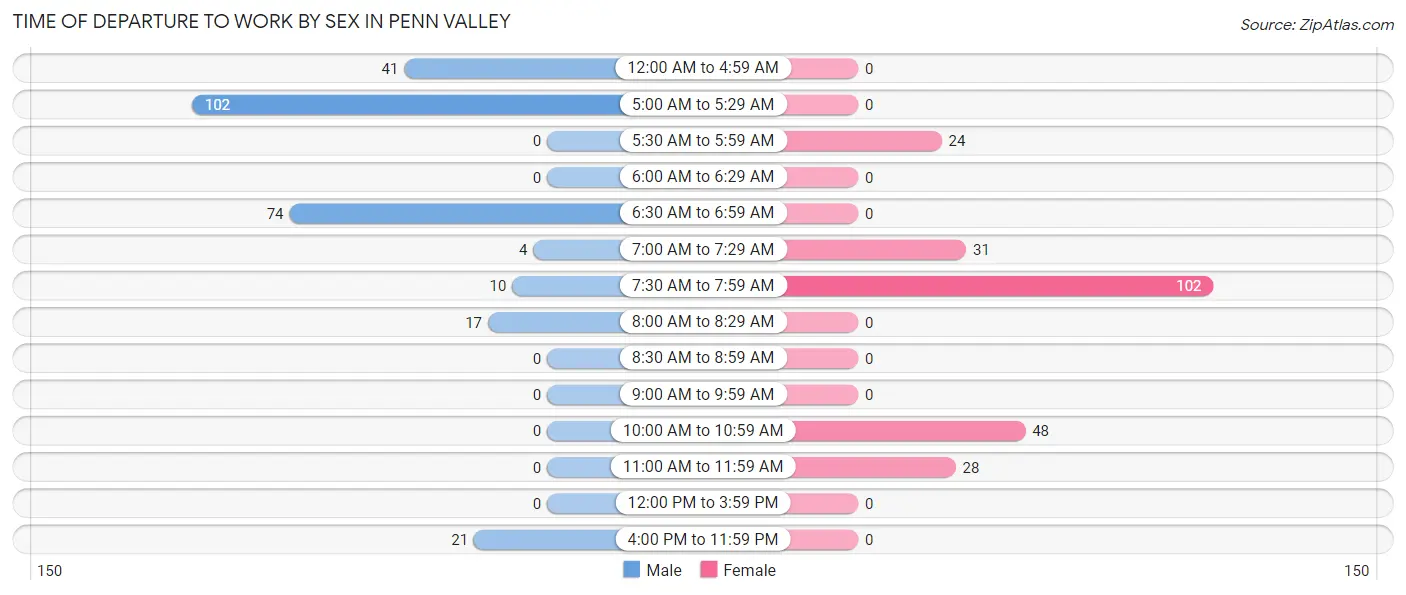
| Time of Departure | Male | Female |
| 12:00 AM to 4:59 AM | 41 (15.2%) | 0 (0.0%) |
| 5:00 AM to 5:29 AM | 102 (37.9%) | 0 (0.0%) |
| 5:30 AM to 5:59 AM | 0 (0.0%) | 24 (10.3%) |
| 6:00 AM to 6:29 AM | 0 (0.0%) | 0 (0.0%) |
| 6:30 AM to 6:59 AM | 74 (27.5%) | 0 (0.0%) |
| 7:00 AM to 7:29 AM | 4 (1.5%) | 31 (13.3%) |
| 7:30 AM to 7:59 AM | 10 (3.7%) | 102 (43.8%) |
| 8:00 AM to 8:29 AM | 17 (6.3%) | 0 (0.0%) |
| 8:30 AM to 8:59 AM | 0 (0.0%) | 0 (0.0%) |
| 9:00 AM to 9:59 AM | 0 (0.0%) | 0 (0.0%) |
| 10:00 AM to 10:59 AM | 0 (0.0%) | 48 (20.6%) |
| 11:00 AM to 11:59 AM | 0 (0.0%) | 28 (12.0%) |
| 12:00 PM to 3:59 PM | 0 (0.0%) | 0 (0.0%) |
| 4:00 PM to 11:59 PM | 21 (7.8%) | 0 (0.0%) |
| Total | 269 (100.0%) | 233 (100.0%) |
Housing Occupancy in Penn Valley
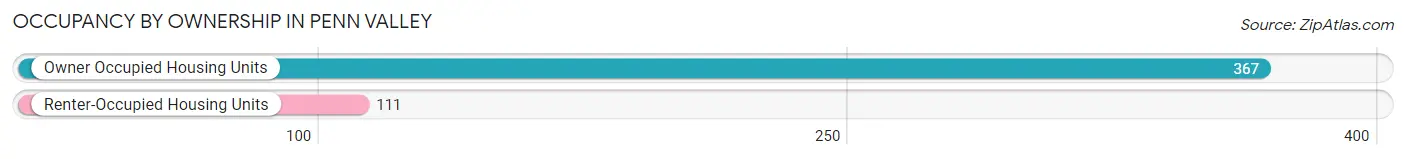
Occupancy by Ownership in Penn Valley
Of the total 478 dwellings in Penn Valley, owner-occupied units account for 367 (76.8%), while renter-occupied units make up 111 (23.2%).
| Occupancy | # Housing Units | % Housing Units |
| Owner Occupied Housing Units | 367 | 76.8% |
| Renter-Occupied Housing Units | 111 | 23.2% |
| Total Occupied Housing Units | 478 | 100.0% |
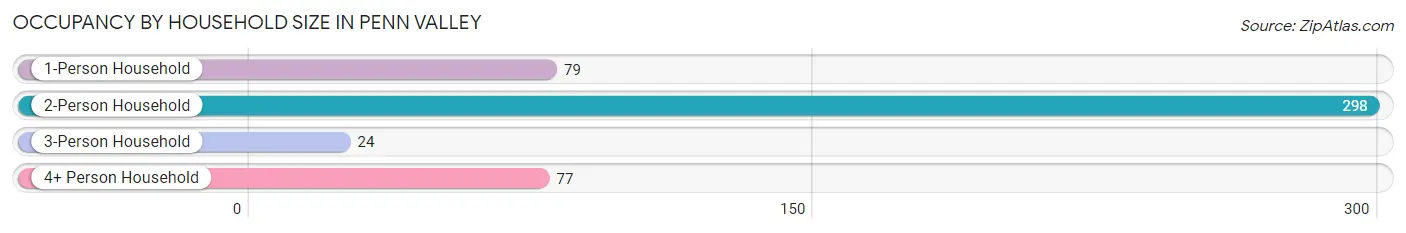
Occupancy by Household Size in Penn Valley
| Household Size | # Housing Units | % Housing Units |
| 1-Person Household | 79 | 16.5% |
| 2-Person Household | 298 | 62.3% |
| 3-Person Household | 24 | 5.0% |
| 4+ Person Household | 77 | 16.1% |
| Total Housing Units | 478 | 100.0% |
Occupancy by Ownership by Household Size in Penn Valley
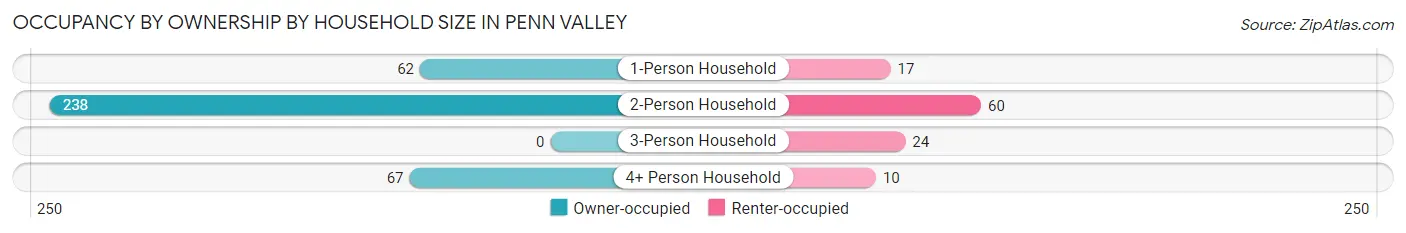
| Household Size | Owner-occupied | Renter-occupied |
| 1-Person Household | 62 (78.5%) | 17 (21.5%) |
| 2-Person Household | 238 (79.9%) | 60 (20.1%) |
| 3-Person Household | 0 (0.0%) | 24 (100.0%) |
| 4+ Person Household | 67 (87.0%) | 10 (13.0%) |
| Total Housing Units | 367 (76.8%) | 111 (23.2%) |
Occupancy by Educational Attainment in Penn Valley
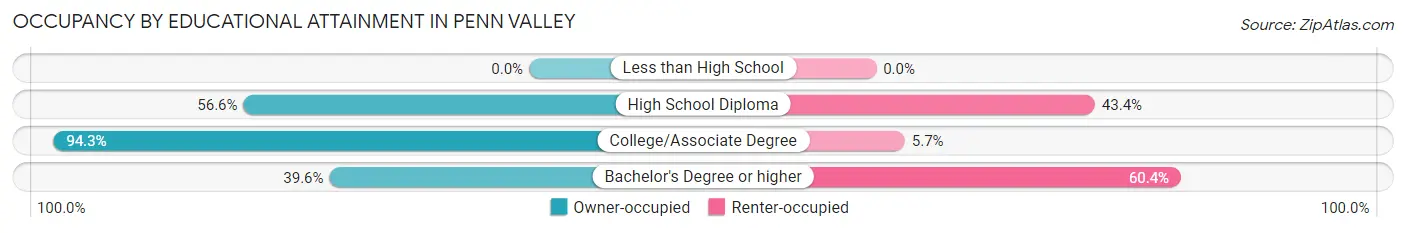
| Household Size | Owner-occupied | Renter-occupied |
| Less than High School | 0 (0.0%) | 0 (0.0%) |
| High School Diploma | 47 (56.6%) | 36 (43.4%) |
| College/Associate Degree | 282 (94.3%) | 17 (5.7%) |
| Bachelor's Degree or higher | 38 (39.6%) | 58 (60.4%) |
Occupancy by Age of Householder in Penn Valley
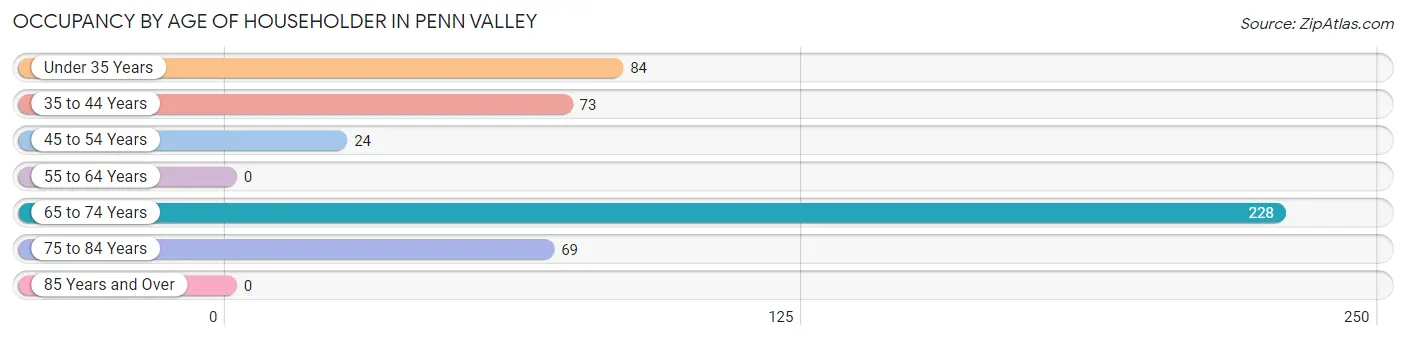
| Age Bracket | # Households | % Households |
| Under 35 Years | 84 | 17.6% |
| 35 to 44 Years | 73 | 15.3% |
| 45 to 54 Years | 24 | 5.0% |
| 55 to 64 Years | 0 | 0.0% |
| 65 to 74 Years | 228 | 47.7% |
| 75 to 84 Years | 69 | 14.4% |
| 85 Years and Over | 0 | 0.0% |
| Total | 478 | 100.0% |
Housing Finances in Penn Valley
Median Income by Occupancy in Penn Valley
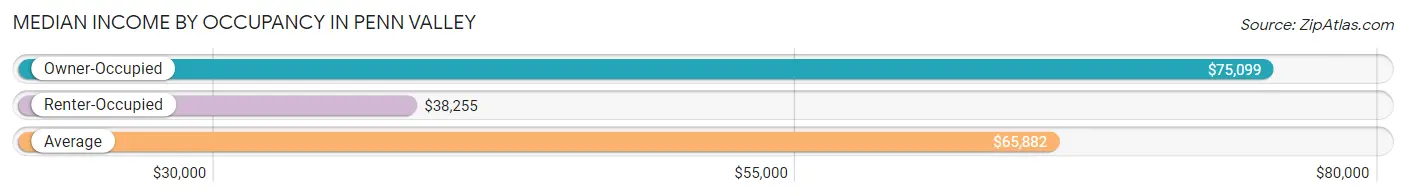
| Occupancy Type | # Households | Median Income |
| Owner-Occupied | 367 (76.8%) | $75,099 |
| Renter-Occupied | 111 (23.2%) | $38,255 |
| Average | 478 (100.0%) | $65,882 |
Occupancy by Householder Income Bracket in Penn Valley
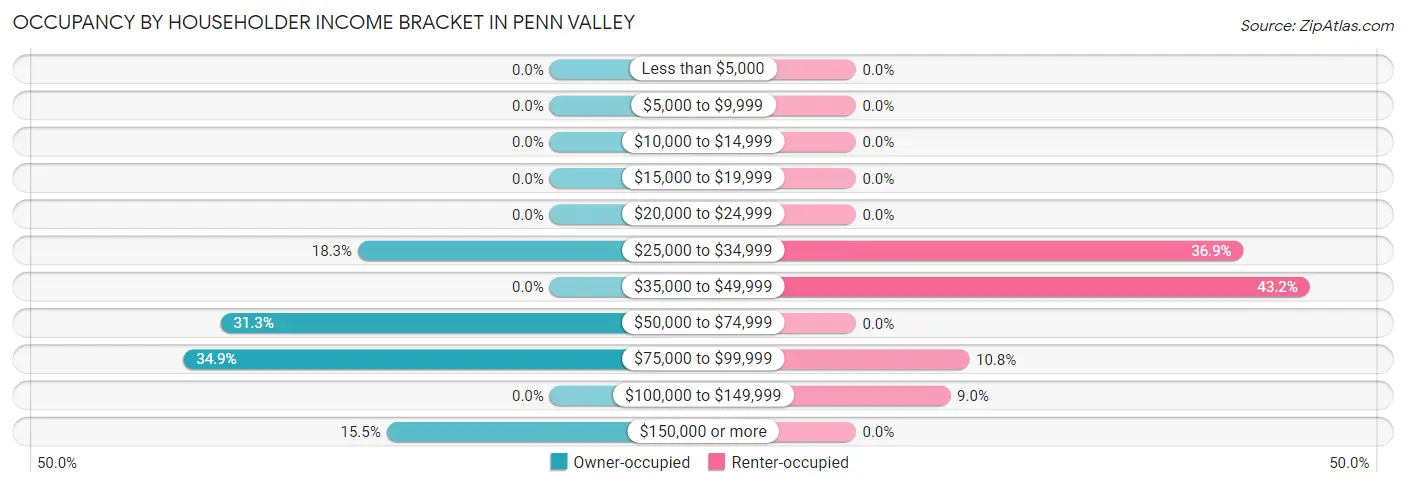
| Income Bracket | Owner-occupied | Renter-occupied |
| Less than $5,000 | 0 (0.0%) | 0 (0.0%) |
| $5,000 to $9,999 | 0 (0.0%) | 0 (0.0%) |
| $10,000 to $14,999 | 0 (0.0%) | 0 (0.0%) |
| $15,000 to $19,999 | 0 (0.0%) | 0 (0.0%) |
| $20,000 to $24,999 | 0 (0.0%) | 0 (0.0%) |
| $25,000 to $34,999 | 67 (18.3%) | 41 (36.9%) |
| $35,000 to $49,999 | 0 (0.0%) | 48 (43.2%) |
| $50,000 to $74,999 | 115 (31.3%) | 0 (0.0%) |
| $75,000 to $99,999 | 128 (34.9%) | 12 (10.8%) |
| $100,000 to $149,999 | 0 (0.0%) | 10 (9.0%) |
| $150,000 or more | 57 (15.5%) | 0 (0.0%) |
| Total | 367 (100.0%) | 111 (100.0%) |
Monthly Housing Cost Tiers in Penn Valley
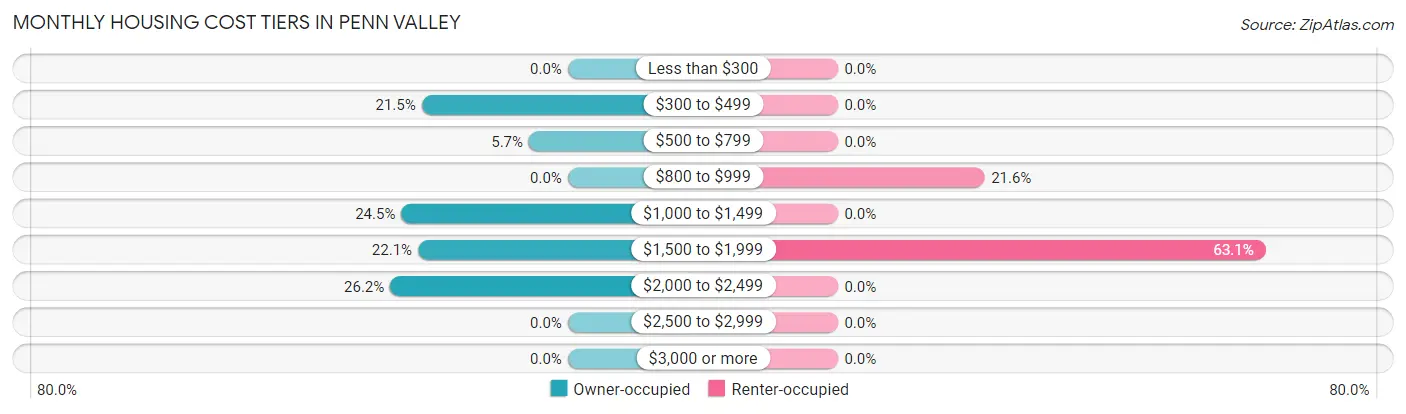
| Monthly Cost | Owner-occupied | Renter-occupied |
| Less than $300 | 0 (0.0%) | 0 (0.0%) |
| $300 to $499 | 79 (21.5%) | 0 (0.0%) |
| $500 to $799 | 21 (5.7%) | 0 (0.0%) |
| $800 to $999 | 0 (0.0%) | 24 (21.6%) |
| $1,000 to $1,499 | 90 (24.5%) | 0 (0.0%) |
| $1,500 to $1,999 | 81 (22.1%) | 70 (63.1%) |
| $2,000 to $2,499 | 96 (26.2%) | 0 (0.0%) |
| $2,500 to $2,999 | 0 (0.0%) | 0 (0.0%) |
| $3,000 or more | 0 (0.0%) | 0 (0.0%) |
| Total | 367 (100.0%) | 111 (100.0%) |
Physical Housing Characteristics in Penn Valley
Housing Structures in Penn Valley
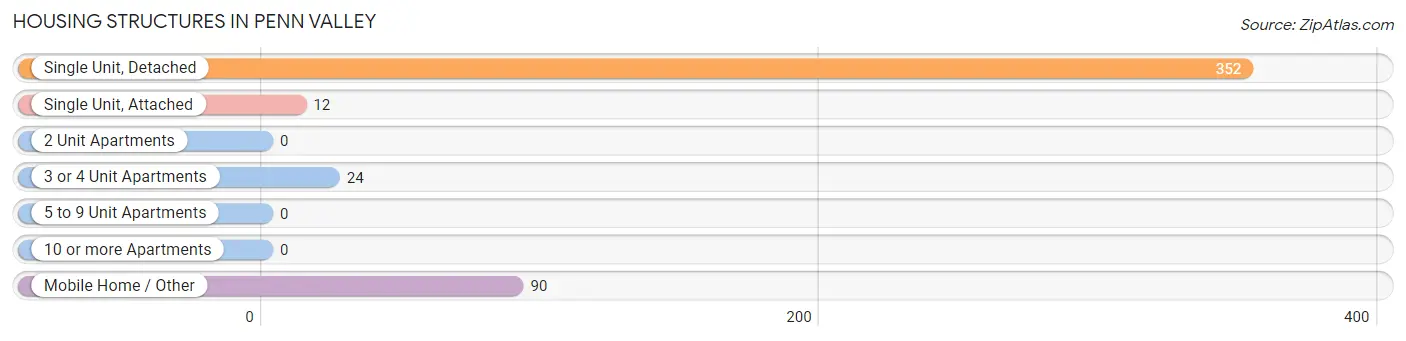
| Structure Type | # Housing Units | % Housing Units |
| Single Unit, Detached | 352 | 73.6% |
| Single Unit, Attached | 12 | 2.5% |
| 2 Unit Apartments | 0 | 0.0% |
| 3 or 4 Unit Apartments | 24 | 5.0% |
| 5 to 9 Unit Apartments | 0 | 0.0% |
| 10 or more Apartments | 0 | 0.0% |
| Mobile Home / Other | 90 | 18.8% |
| Total | 478 | 100.0% |
Housing Structures by Occupancy in Penn Valley
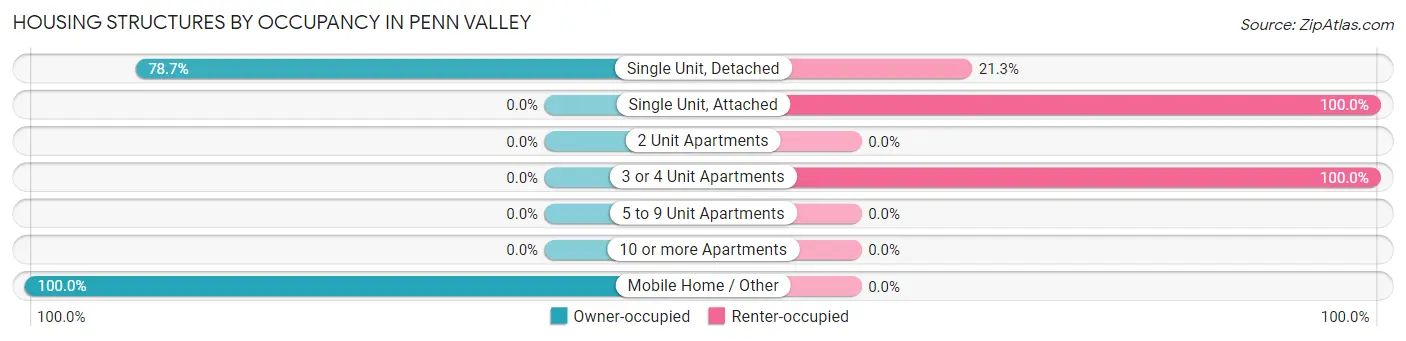
| Structure Type | Owner-occupied | Renter-occupied |
| Single Unit, Detached | 277 (78.7%) | 75 (21.3%) |
| Single Unit, Attached | 0 (0.0%) | 12 (100.0%) |
| 2 Unit Apartments | 0 (0.0%) | 0 (0.0%) |
| 3 or 4 Unit Apartments | 0 (0.0%) | 24 (100.0%) |
| 5 to 9 Unit Apartments | 0 (0.0%) | 0 (0.0%) |
| 10 or more Apartments | 0 (0.0%) | 0 (0.0%) |
| Mobile Home / Other | 90 (100.0%) | 0 (0.0%) |
| Total | 367 (76.8%) | 111 (23.2%) |
Housing Structures by Number of Rooms in Penn Valley
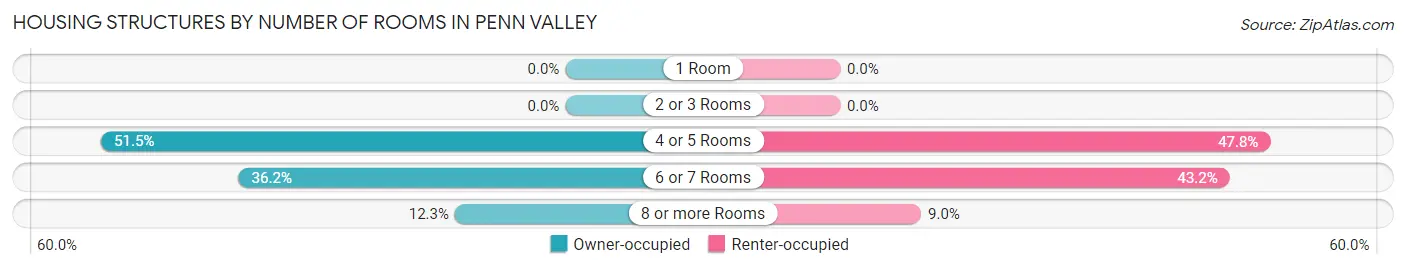
| Number of Rooms | Owner-occupied | Renter-occupied |
| 1 Room | 0 (0.0%) | 0 (0.0%) |
| 2 or 3 Rooms | 0 (0.0%) | 0 (0.0%) |
| 4 or 5 Rooms | 189 (51.5%) | 53 (47.7%) |
| 6 or 7 Rooms | 133 (36.2%) | 48 (43.2%) |
| 8 or more Rooms | 45 (12.3%) | 10 (9.0%) |
| Total | 367 (100.0%) | 111 (100.0%) |
Housing Structure by Heating Type in Penn Valley
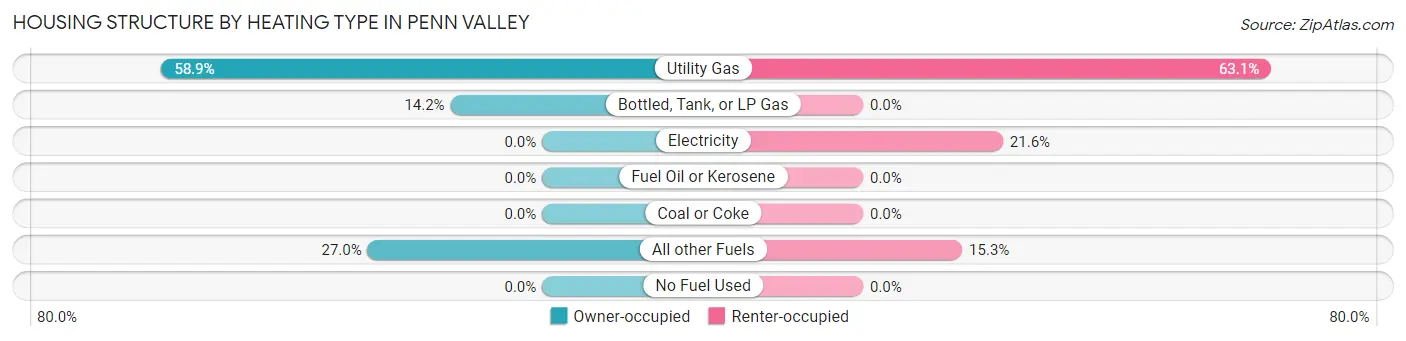
| Heating Type | Owner-occupied | Renter-occupied |
| Utility Gas | 216 (58.9%) | 70 (63.1%) |
| Bottled, Tank, or LP Gas | 52 (14.2%) | 0 (0.0%) |
| Electricity | 0 (0.0%) | 24 (21.6%) |
| Fuel Oil or Kerosene | 0 (0.0%) | 0 (0.0%) |
| Coal or Coke | 0 (0.0%) | 0 (0.0%) |
| All other Fuels | 99 (27.0%) | 17 (15.3%) |
| No Fuel Used | 0 (0.0%) | 0 (0.0%) |
| Total | 367 (100.0%) | 111 (100.0%) |
Household Vehicle Usage in Penn Valley
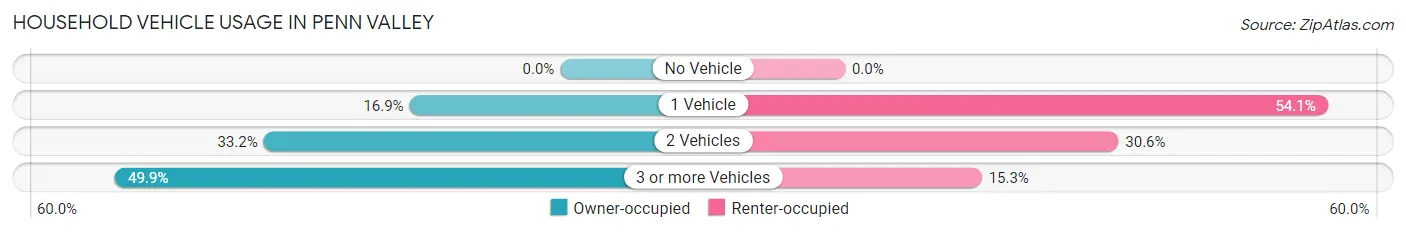
| Vehicles per Household | Owner-occupied | Renter-occupied |
| No Vehicle | 0 (0.0%) | 0 (0.0%) |
| 1 Vehicle | 62 (16.9%) | 60 (54.0%) |
| 2 Vehicles | 122 (33.2%) | 34 (30.6%) |
| 3 or more Vehicles | 183 (49.9%) | 17 (15.3%) |
| Total | 367 (100.0%) | 111 (100.0%) |
Real Estate & Mortgages in Penn Valley
Real Estate and Mortgage Overview in Penn Valley
| Characteristic | Without Mortgage | With Mortgage |
| Housing Units | 221 | 146 |
| Median Property Value | - | - |
| Median Household Income | $95,292 | $26 |
| Monthly Housing Costs | - | - |
| Real Estate Taxes | - | - |
Property Value by Mortgage Status in Penn Valley
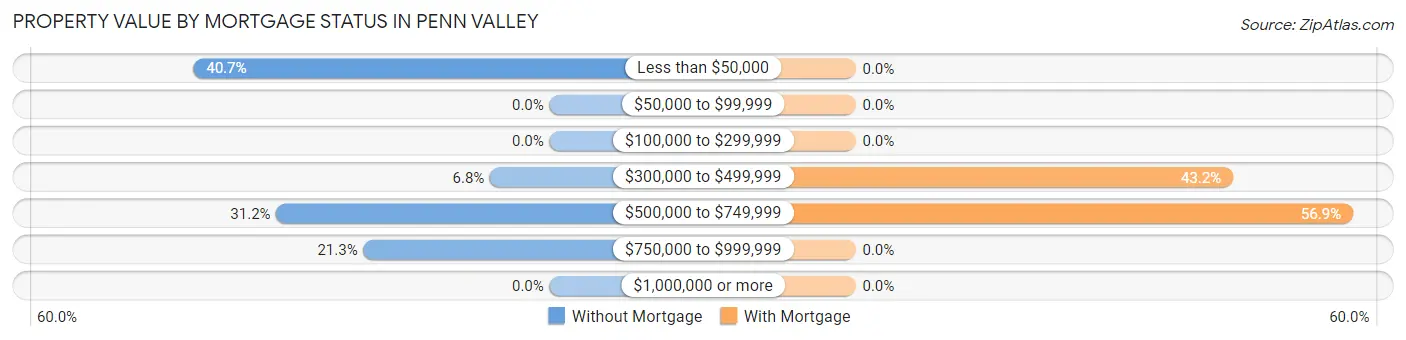
| Property Value | Without Mortgage | With Mortgage |
| Less than $50,000 | 90 (40.7%) | 0 (0.0%) |
| $50,000 to $99,999 | 0 (0.0%) | 0 (0.0%) |
| $100,000 to $299,999 | 0 (0.0%) | 0 (0.0%) |
| $300,000 to $499,999 | 15 (6.8%) | 63 (43.1%) |
| $500,000 to $749,999 | 69 (31.2%) | 83 (56.9%) |
| $750,000 to $999,999 | 47 (21.3%) | 0 (0.0%) |
| $1,000,000 or more | 0 (0.0%) | 0 (0.0%) |
| Total | 221 (100.0%) | 146 (100.0%) |
Household Income by Mortgage Status in Penn Valley
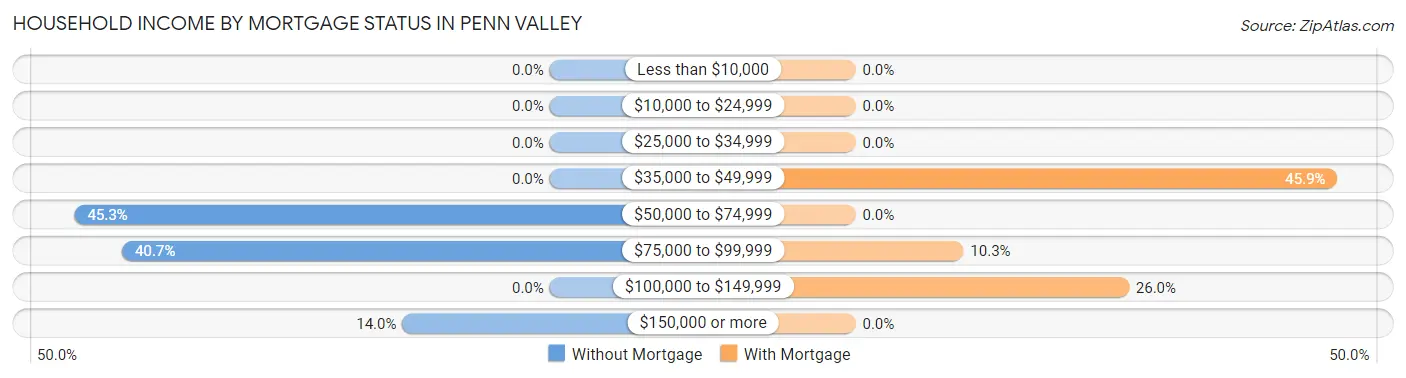
| Household Income | Without Mortgage | With Mortgage |
| Less than $10,000 | 0 (0.0%) | 0 (0.0%) |
| $10,000 to $24,999 | 0 (0.0%) | 0 (0.0%) |
| $25,000 to $34,999 | 0 (0.0%) | 0 (0.0%) |
| $35,000 to $49,999 | 0 (0.0%) | 67 (45.9%) |
| $50,000 to $74,999 | 100 (45.3%) | 0 (0.0%) |
| $75,000 to $99,999 | 90 (40.7%) | 15 (10.3%) |
| $100,000 to $149,999 | 0 (0.0%) | 38 (26.0%) |
| $150,000 or more | 31 (14.0%) | 0 (0.0%) |
| Total | 221 (100.0%) | 146 (100.0%) |
Property Value to Household Income Ratio in Penn Valley
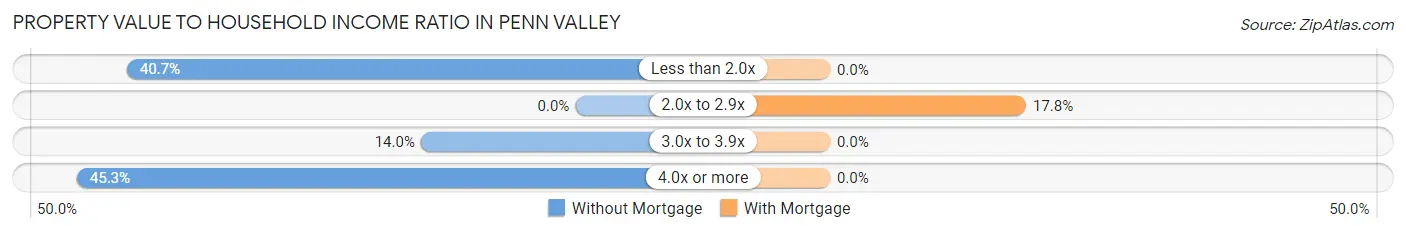
| Value-to-Income Ratio | Without Mortgage | With Mortgage |
| Less than 2.0x | 90 (40.7%) | 0 (0.0%) |
| 2.0x to 2.9x | 0 (0.0%) | 26 (17.8%) |
| 3.0x to 3.9x | 31 (14.0%) | 0 (0.0%) |
| 4.0x or more | 100 (45.3%) | 0 (0.0%) |
| Total | 221 (100.0%) | 146 (100.0%) |
Real Estate Taxes by Mortgage Status in Penn Valley
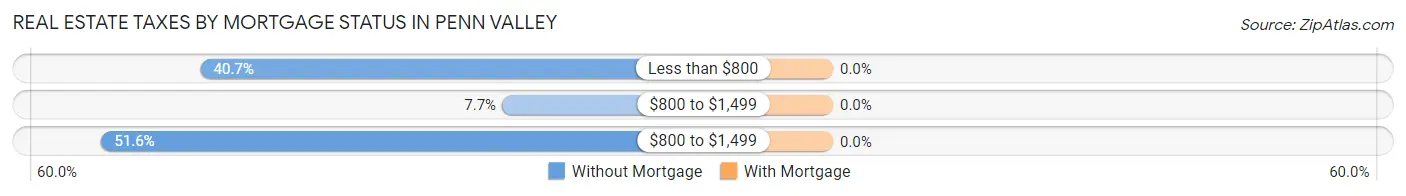
| Property Taxes | Without Mortgage | With Mortgage |
| Less than $800 | 90 (40.7%) | 0 (0.0%) |
| $800 to $1,499 | 17 (7.7%) | 0 (0.0%) |
| $800 to $1,499 | 114 (51.6%) | 0 (0.0%) |
| Total | 221 (100.0%) | 146 (100.0%) |
Health & Disability in Penn Valley
Health Insurance Coverage by Age in Penn Valley
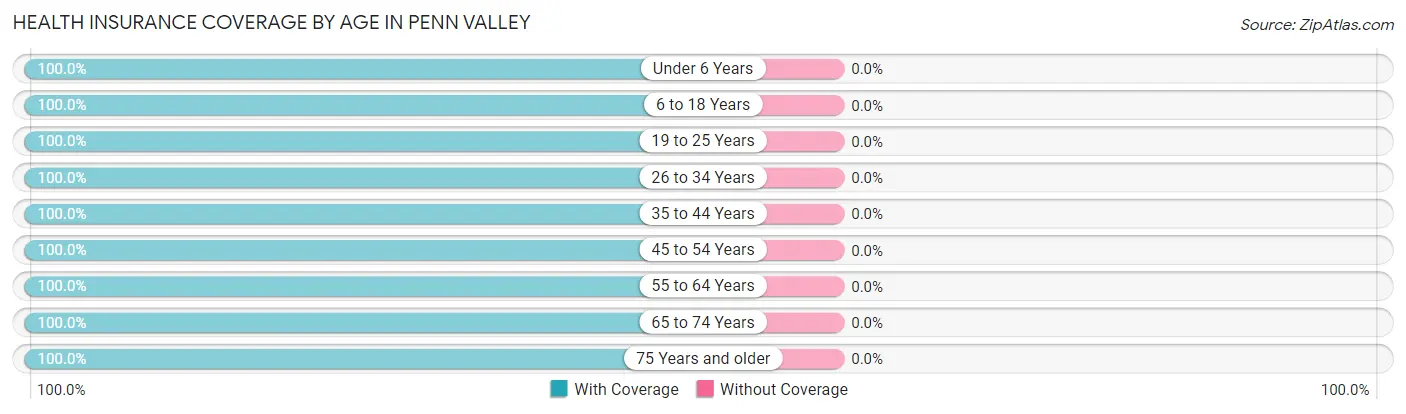
| Age Bracket | With Coverage | Without Coverage |
| Under 6 Years | 43 (100.0%) | 0 (0.0%) |
| 6 to 18 Years | 118 (100.0%) | 0 (0.0%) |
| 19 to 25 Years | 28 (100.0%) | 0 (0.0%) |
| 26 to 34 Years | 100 (100.0%) | 0 (0.0%) |
| 35 to 44 Years | 239 (100.0%) | 0 (0.0%) |
| 45 to 54 Years | 45 (100.0%) | 0 (0.0%) |
| 55 to 64 Years | 159 (100.0%) | 0 (0.0%) |
| 65 to 74 Years | 287 (100.0%) | 0 (0.0%) |
| 75 Years and older | 169 (100.0%) | 0 (0.0%) |
| Total | 1,188 (100.0%) | 0 (0.0%) |
Health Insurance Coverage by Citizenship Status in Penn Valley
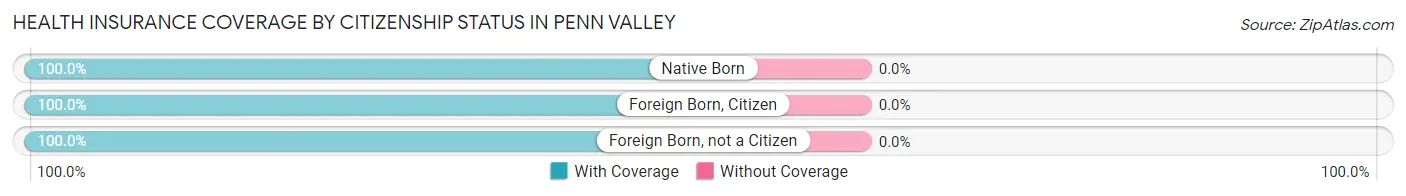
| Citizenship Status | With Coverage | Without Coverage |
| Native Born | 43 (100.0%) | 0 (0.0%) |
| Foreign Born, Citizen | 118 (100.0%) | 0 (0.0%) |
| Foreign Born, not a Citizen | 28 (100.0%) | 0 (0.0%) |
Health Insurance Coverage by Household Income in Penn Valley
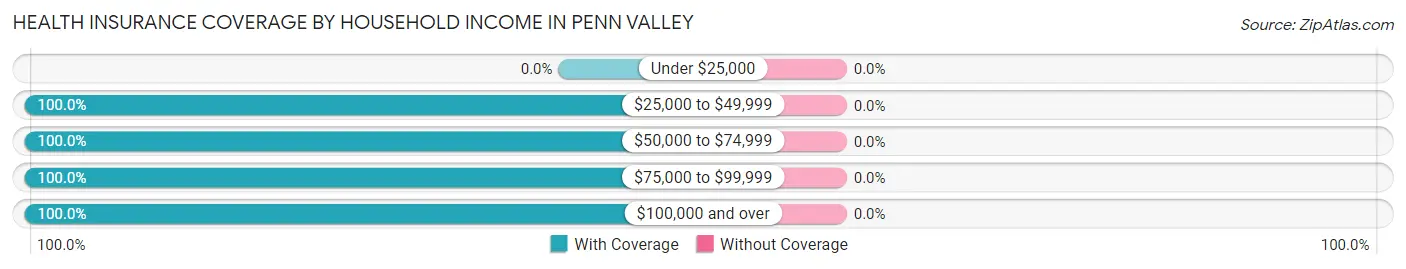
| Household Income | With Coverage | Without Coverage |
| Under $25,000 | 0 (0.0%) | 0 (0.0%) |
| $25,000 to $49,999 | 364 (100.0%) | 0 (0.0%) |
| $50,000 to $74,999 | 293 (100.0%) | 0 (0.0%) |
| $75,000 to $99,999 | 268 (100.0%) | 0 (0.0%) |
| $100,000 and over | 244 (100.0%) | 0 (0.0%) |
Public vs Private Health Insurance Coverage by Age in Penn Valley
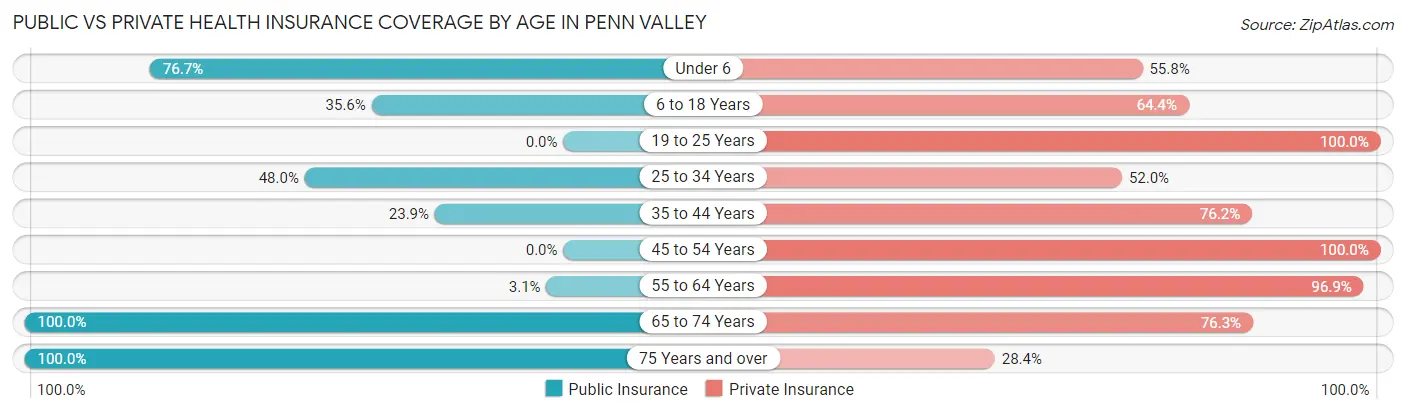
| Age Bracket | Public Insurance | Private Insurance |
| Under 6 | 33 (76.7%) | 24 (55.8%) |
| 6 to 18 Years | 42 (35.6%) | 76 (64.4%) |
| 19 to 25 Years | 0 (0.0%) | 28 (100.0%) |
| 25 to 34 Years | 48 (48.0%) | 52 (52.0%) |
| 35 to 44 Years | 57 (23.8%) | 182 (76.1%) |
| 45 to 54 Years | 0 (0.0%) | 45 (100.0%) |
| 55 to 64 Years | 5 (3.1%) | 154 (96.9%) |
| 65 to 74 Years | 287 (100.0%) | 219 (76.3%) |
| 75 Years and over | 169 (100.0%) | 48 (28.4%) |
| Total | 641 (54.0%) | 828 (69.7%) |
Disability Status by Sex by Age in Penn Valley
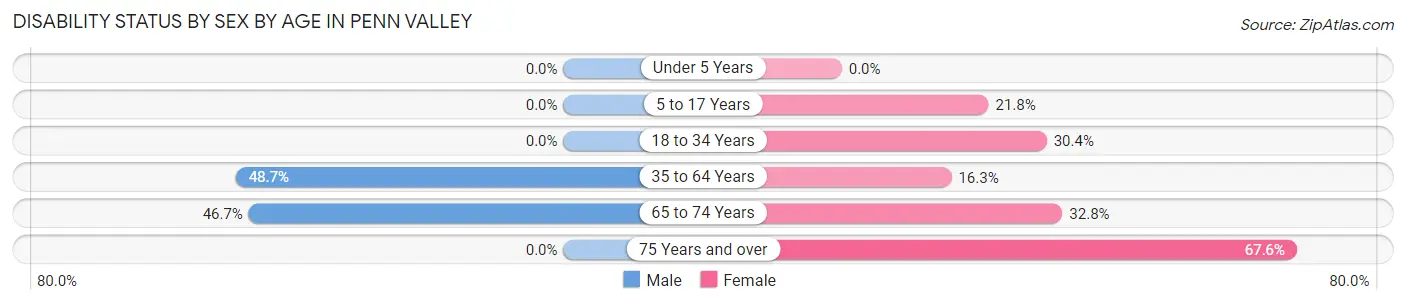
| Age Bracket | Male | Female |
| Under 5 Years | 0 (0.0%) | 0 (0.0%) |
| 5 to 17 Years | 0 (0.0%) | 17 (21.8%) |
| 18 to 34 Years | 0 (0.0%) | 28 (30.4%) |
| 35 to 64 Years | 108 (48.6%) | 36 (16.3%) |
| 65 to 74 Years | 107 (46.7%) | 19 (32.8%) |
| 75 Years and over | 0 (0.0%) | 100 (67.6%) |
Disability Class by Sex by Age in Penn Valley
Disability Class: Hearing Difficulty
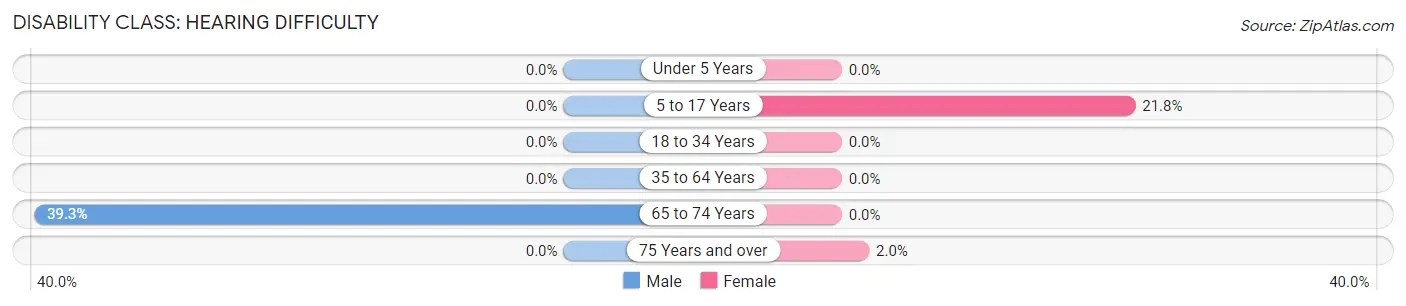
| Age Bracket | Male | Female |
| Under 5 Years | 0 (0.0%) | 0 (0.0%) |
| 5 to 17 Years | 0 (0.0%) | 17 (21.8%) |
| 18 to 34 Years | 0 (0.0%) | 0 (0.0%) |
| 35 to 64 Years | 0 (0.0%) | 0 (0.0%) |
| 65 to 74 Years | 90 (39.3%) | 0 (0.0%) |
| 75 Years and over | 0 (0.0%) | 3 (2.0%) |
Disability Class: Vision Difficulty
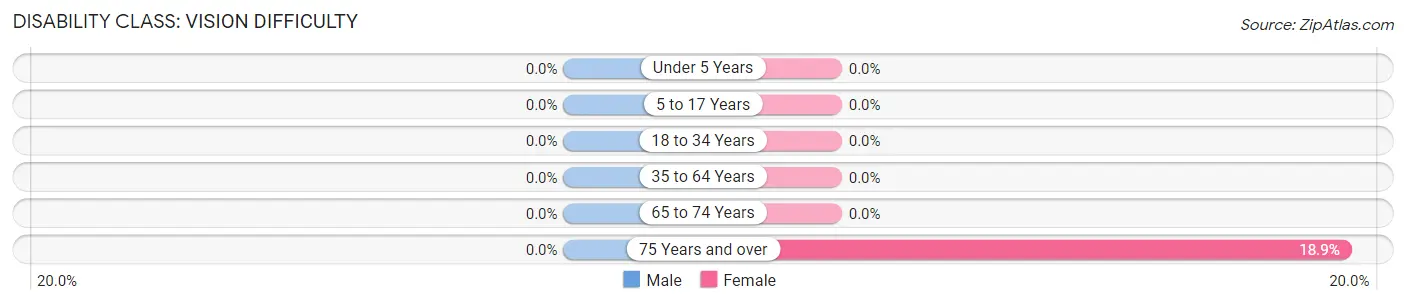
| Age Bracket | Male | Female |
| Under 5 Years | 0 (0.0%) | 0 (0.0%) |
| 5 to 17 Years | 0 (0.0%) | 0 (0.0%) |
| 18 to 34 Years | 0 (0.0%) | 0 (0.0%) |
| 35 to 64 Years | 0 (0.0%) | 0 (0.0%) |
| 65 to 74 Years | 0 (0.0%) | 0 (0.0%) |
| 75 Years and over | 0 (0.0%) | 28 (18.9%) |
Disability Class: Cognitive Difficulty
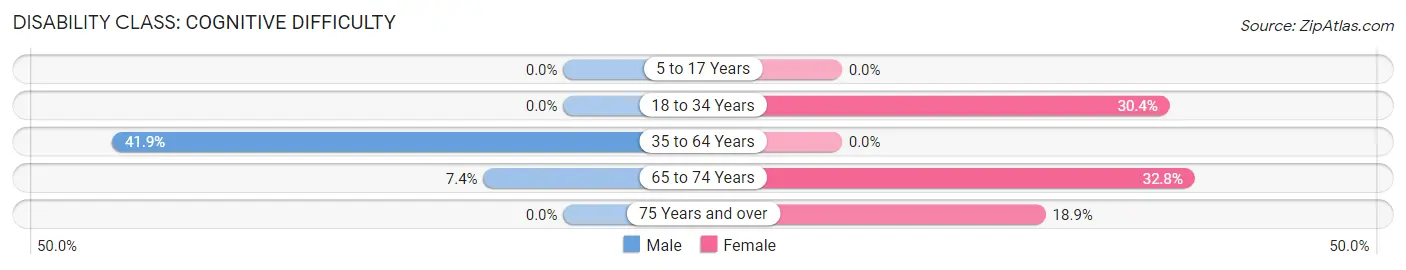
| Age Bracket | Male | Female |
| 5 to 17 Years | 0 (0.0%) | 0 (0.0%) |
| 18 to 34 Years | 0 (0.0%) | 28 (30.4%) |
| 35 to 64 Years | 93 (41.9%) | 0 (0.0%) |
| 65 to 74 Years | 17 (7.4%) | 19 (32.8%) |
| 75 Years and over | 0 (0.0%) | 28 (18.9%) |
Disability Class: Ambulatory Difficulty
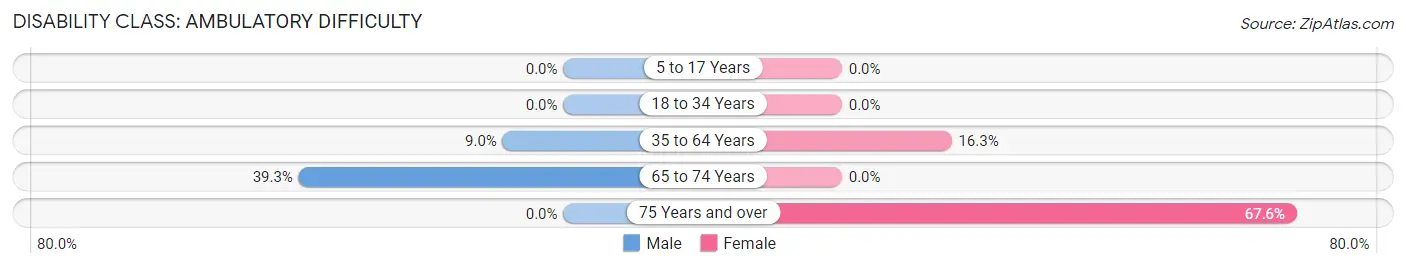
| Age Bracket | Male | Female |
| 5 to 17 Years | 0 (0.0%) | 0 (0.0%) |
| 18 to 34 Years | 0 (0.0%) | 0 (0.0%) |
| 35 to 64 Years | 20 (9.0%) | 36 (16.3%) |
| 65 to 74 Years | 90 (39.3%) | 0 (0.0%) |
| 75 Years and over | 0 (0.0%) | 100 (67.6%) |
Disability Class: Self-Care Difficulty
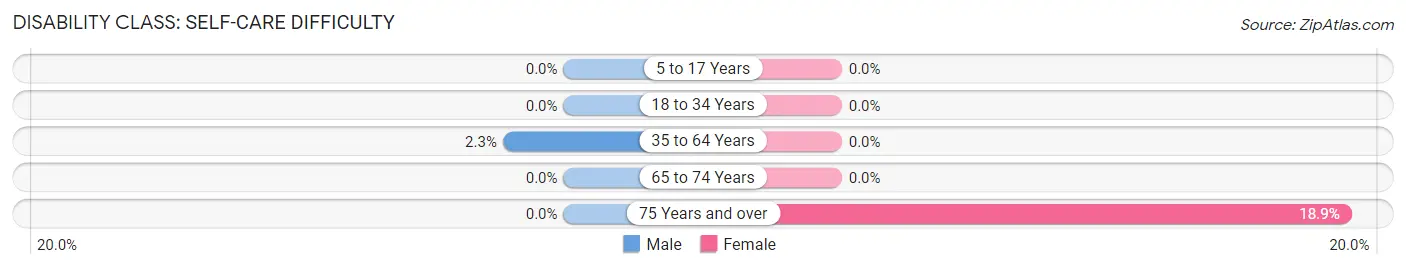
| Age Bracket | Male | Female |
| 5 to 17 Years | 0 (0.0%) | 0 (0.0%) |
| 18 to 34 Years | 0 (0.0%) | 0 (0.0%) |
| 35 to 64 Years | 5 (2.2%) | 0 (0.0%) |
| 65 to 74 Years | 0 (0.0%) | 0 (0.0%) |
| 75 Years and over | 0 (0.0%) | 28 (18.9%) |
Technology Access in Penn Valley
Computing Device Access in Penn Valley
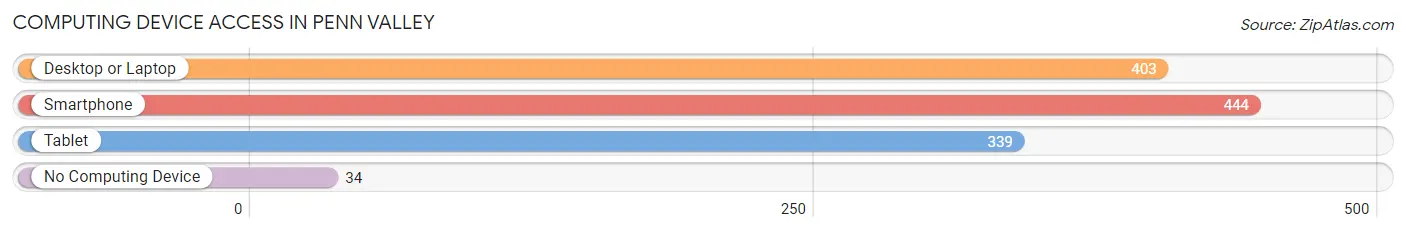
| Device Type | # Households | % Households |
| Desktop or Laptop | 403 | 84.3% |
| Smartphone | 444 | 92.9% |
| Tablet | 339 | 70.9% |
| No Computing Device | 34 | 7.1% |
| Total | 478 | 100.0% |
Internet Access in Penn Valley
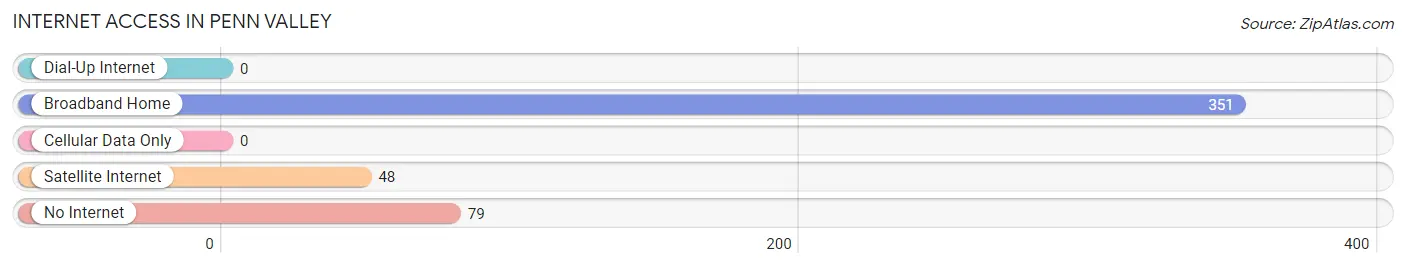
| Internet Type | # Households | % Households |
| Dial-Up Internet | 0 | 0.0% |
| Broadband Home | 351 | 73.4% |
| Cellular Data Only | 0 | 0.0% |
| Satellite Internet | 48 | 10.0% |
| No Internet | 79 | 16.5% |
| Total | 478 | 100.0% |
Penn Valley Summary
Penn Valley is a small unincorporated community located in Nevada County, California. It is situated in the Sierra Nevada foothills, approximately 10 miles northeast of Grass Valley and 20 miles northwest of Nevada City. The population of Penn Valley was estimated to be 3,845 in 2019.
History
The area now known as Penn Valley was originally inhabited by the Nisenan Native Americans. The first non-native settlers arrived in the area in the 1850s, and the town was officially founded in 1864. The town was named after the Penn family, who were among the first settlers.
The town was initially a farming and ranching community, and the Penn Valley area was known for its production of hay, grain, and livestock. In the late 19th century, the town began to grow as a result of the gold rush. The town was also home to several sawmills, which provided lumber for the growing population.
In the early 20th century, the town began to experience a decline in population as the gold rush ended and the timber industry declined. However, the town experienced a resurgence in the 1950s and 1960s as the area became a popular destination for outdoor recreation.
Geography
Penn Valley is located in the Sierra Nevada foothills, approximately 10 miles northeast of Grass Valley and 20 miles northwest of Nevada City. The town is situated at an elevation of 1,400 feet, and the surrounding area is characterized by rolling hills and oak woodlands.
The town is located in the Sierra Nevada watershed, and the nearby Wolf Creek and Penn Valley Creek both flow into the Bear River. The Bear River is a tributary of the Yuba River, which flows into the Feather River and eventually into the Sacramento River.
Economy
The economy of Penn Valley is largely based on agriculture and tourism. The area is known for its production of hay, grain, and livestock, and the town is home to several wineries and vineyards.
The town is also a popular destination for outdoor recreation, and the nearby Lake Wildwood is a popular spot for fishing, boating, and swimming. The area is also home to several golf courses, and the nearby Sierra Nevada mountains provide opportunities for hiking, camping, and skiing.
Demographics
As of 2019, the population of Penn Valley was estimated to be 3,845. The town has a median age of 48.7 years, and the median household income is $63,945. The town is predominantly white (90.2%), with smaller percentages of Hispanic (3.7%), Asian (2.2%), and African American (1.2%) residents.
Conclusion
Penn Valley is a small unincorporated community located in Nevada County, California. It is situated in the Sierra Nevada foothills, approximately 10 miles northeast of Grass Valley and 20 miles northwest of Nevada City. The population of Penn Valley was estimated to be 3,845 in 2019. The town is known for its production of hay, grain, and livestock, and the nearby Lake Wildwood is a popular spot for outdoor recreation. The town has a predominantly white population, with smaller percentages of Hispanic, Asian, and African American residents.
Common Questions
What is Per Capita Income in Penn Valley?
Per Capita income in Penn Valley is $34,638.
What is the Median Family Income in Penn Valley?
Median Family Income in Penn Valley is $72,202.
What is the Median Household income in Penn Valley?
Median Household Income in Penn Valley is $65,882.
What is Income or Wage Gap in Penn Valley?
Income or Wage Gap in Penn Valley is 23.5%.
Women in Penn Valley earn 76.5 cents for every dollar earned by a man.
What is Inequality or Gini Index in Penn Valley?
Inequality or Gini Index in Penn Valley is 0.38.
What is the Total Population of Penn Valley?
Total Population of Penn Valley is 1,188.
What is the Total Male Population of Penn Valley?
Total Male Population of Penn Valley is 577.
What is the Total Female Population of Penn Valley?
Total Female Population of Penn Valley is 611.
What is the Ratio of Males per 100 Females in Penn Valley?
There are 94.44 Males per 100 Females in Penn Valley.
What is the Ratio of Females per 100 Males in Penn Valley?
There are 105.89 Females per 100 Males in Penn Valley.
What is the Median Population Age in Penn Valley?
Median Population Age in Penn Valley is 55.7 Years.
What is the Average Family Size in Penn Valley
Average Family Size in Penn Valley is 2.6 People.
What is the Average Household Size in Penn Valley
Average Household Size in Penn Valley is 2.5 People.
How Large is the Labor Force in Penn Valley?
There are 502 People in the Labor Forcein in Penn Valley.
What is the Percentage of People in the Labor Force in Penn Valley?
47.7% of People are in the Labor Force in Penn Valley.