Cities with the Highest Percentage of Population with a Degree in Visual and Performing Arts in Nebraska
RELATED REPORTS & OPTIONS
Visual and Performing Arts
Nebraska
Compare Cities
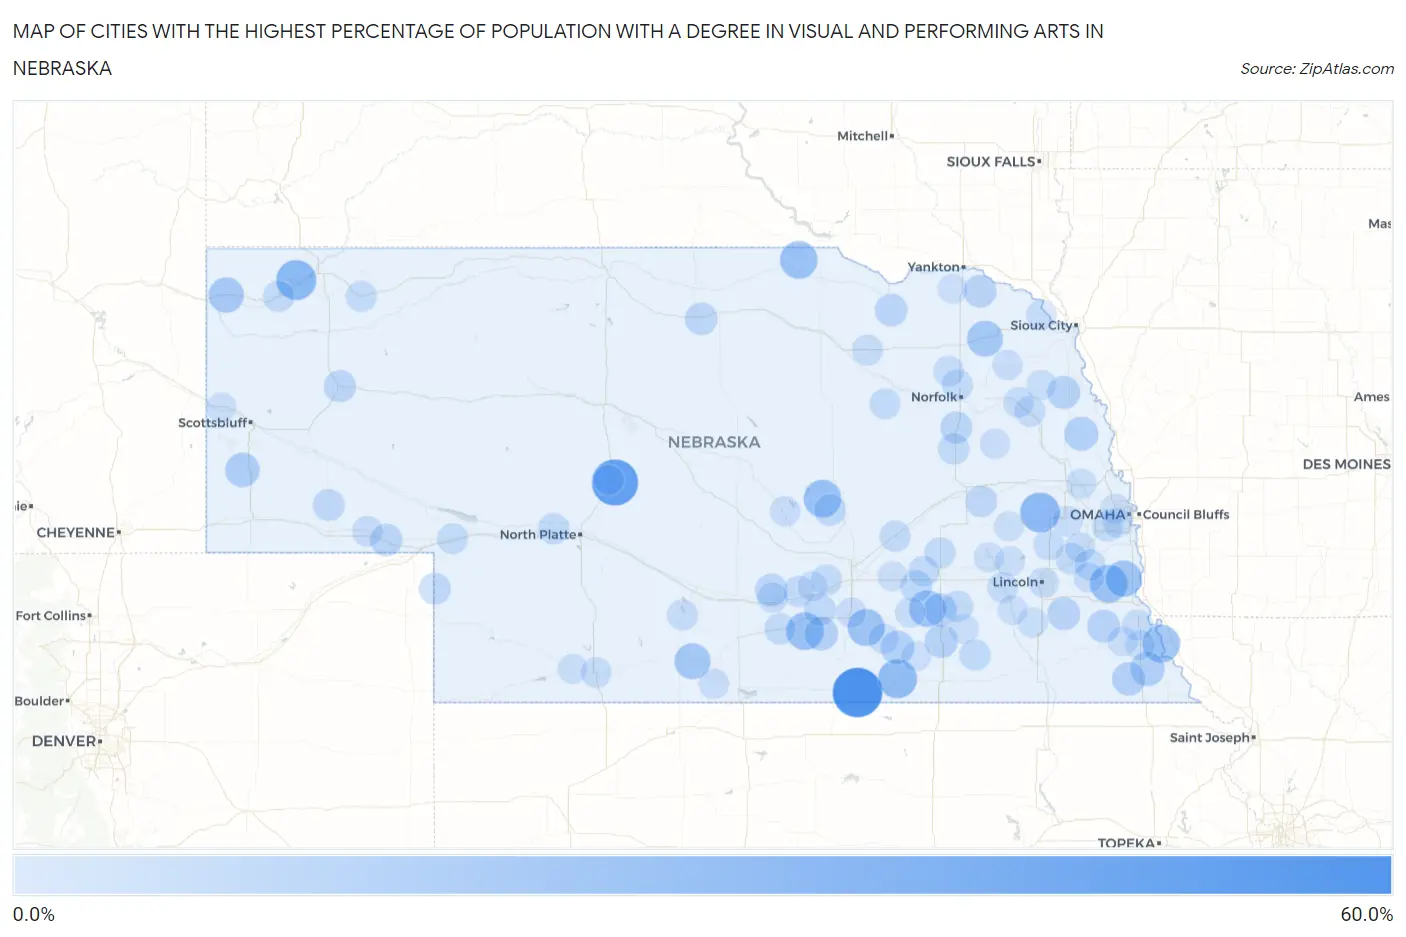
Map of Cities with the Highest Percentage of Population with a Degree in Visual and Performing Arts in Nebraska
0.0%
60.0%
Cities with the Highest Percentage of Population with a Degree in Visual and Performing Arts in Nebraska
| City | % Graduates | vs State | vs National | |
| 1. | Guide Rock | 60.0% | 3.3%(+56.7)#1 | 4.3%(+55.7)#82 |
| 2. | Gandy | 50.0% | 3.3%(+46.7)#2 | 4.3%(+45.7)#132 |
| 3. | Whitney | 31.6% | 3.3%(+28.3)#3 | 4.3%(+27.3)#290 |
| 4. | Malmo | 31.2% | 3.3%(+28.0)#4 | 4.3%(+27.0)#294 |
| 5. | Nora | 28.6% | 3.3%(+25.3)#5 | 4.3%(+24.3)#348 |
| 6. | Avoca | 25.0% | 3.3%(+21.7)#6 | 4.3%(+20.7)#433 |
| 7. | Brownville | 25.0% | 3.3%(+21.7)#7 | 4.3%(+20.7)#437 |
| 8. | Norman | 25.0% | 3.3%(+21.7)#8 | 4.3%(+20.7)#444 |
| 9. | Cotesfield | 25.0% | 3.3%(+21.7)#9 | 4.3%(+20.7)#446 |
| 10. | Butte | 24.7% | 3.3%(+21.5)#10 | 4.3%(+20.5)#450 |
| 11. | Glenvil | 23.1% | 3.3%(+19.8)#11 | 4.3%(+18.8)#485 |
| 12. | Grafton | 22.2% | 3.3%(+19.0)#12 | 4.3%(+18.0)#519 |
| 13. | Nehawka | 21.1% | 3.3%(+17.8)#13 | 4.3%(+16.8)#573 |
| 14. | Edison | 20.0% | 3.3%(+16.7)#14 | 4.3%(+15.7)#635 |
| 15. | Belden | 20.0% | 3.3%(+16.7)#15 | 4.3%(+15.7)#638 |
| 16. | Harrison | 18.4% | 3.3%(+15.2)#16 | 4.3%(+14.2)#747 |
| 17. | Harrisburg | 15.8% | 3.3%(+12.5)#17 | 4.3%(+11.5)#976 |
| 18. | Stella | 14.8% | 3.3%(+11.5)#18 | 4.3%(+10.6)#1,085 |
| 19. | Craig | 14.3% | 3.3%(+11.0)#19 | 4.3%(+10.0)#1,164 |
| 20. | Edgar | 13.6% | 3.3%(+10.3)#20 | 4.3%(+9.33)#1,252 |
| 21. | Holstein | 13.3% | 3.3%(+10.1)#21 | 4.3%(+9.08)#1,298 |
| 22. | Humboldt | 13.0% | 3.3%(+9.73)#22 | 4.3%(+8.75)#1,346 |
| 23. | Fairmont | 12.5% | 3.3%(+9.23)#23 | 4.3%(+8.25)#1,414 |
| 24. | Strang | 12.5% | 3.3%(+9.23)#24 | 4.3%(+8.25)#1,435 |
| 25. | Rosalie | 12.1% | 3.3%(+8.85)#25 | 4.3%(+7.87)#1,505 |
| 26. | Cook | 11.7% | 3.3%(+8.40)#26 | 4.3%(+7.41)#1,593 |
| 27. | Panama | 11.5% | 3.3%(+8.27)#27 | 4.3%(+7.29)#1,622 |
| 28. | Bow Valley | 11.1% | 3.3%(+7.84)#28 | 4.3%(+6.86)#1,727 |
| 29. | Long Pine | 10.5% | 3.3%(+7.26)#29 | 4.3%(+6.27)#1,896 |
| 30. | Verdigre | 10.4% | 3.3%(+7.15)#30 | 4.3%(+6.16)#1,926 |
| 31. | Glenwood | 10.0% | 3.3%(+6.70)#31 | 4.3%(+5.72)#2,086 |
| 32. | Chappell | 9.8% | 3.3%(+6.58)#32 | 4.3%(+5.60)#2,120 |
| 33. | Alliance | 9.5% | 3.3%(+6.23)#33 | 4.3%(+5.25)#2,250 |
| 34. | Madison | 9.0% | 3.3%(+5.77)#34 | 4.3%(+4.79)#2,440 |
| 35. | Kenesaw | 8.5% | 3.3%(+5.26)#35 | 4.3%(+4.28)#2,680 |
| 36. | Gurley | 8.3% | 3.3%(+5.06)#36 | 4.3%(+4.08)#2,787 |
| 37. | Elba | 8.3% | 3.3%(+5.06)#37 | 4.3%(+4.08)#2,790 |
| 38. | Venango | 8.3% | 3.3%(+5.06)#38 | 4.3%(+4.08)#2,799 |
| 39. | Henderson | 8.0% | 3.3%(+4.77)#39 | 4.3%(+3.79)#2,940 |
| 40. | Bellwood | 8.0% | 3.3%(+4.73)#40 | 4.3%(+3.75)#2,970 |
| 41. | Greenwood | 7.5% | 3.3%(+4.26)#41 | 4.3%(+3.27)#3,284 |
| 42. | Humphrey | 7.4% | 3.3%(+4.14)#42 | 4.3%(+3.16)#3,352 |
| 43. | Hershey | 7.4% | 3.3%(+4.08)#43 | 4.3%(+3.10)#3,396 |
| 44. | Crawford | 7.3% | 3.3%(+4.02)#44 | 4.3%(+3.03)#3,459 |
| 45. | Minden | 7.1% | 3.3%(+3.87)#45 | 4.3%(+2.89)#3,557 |
| 46. | Exeter | 7.0% | 3.3%(+3.71)#46 | 4.3%(+2.72)#3,727 |
| 47. | Daykin | 6.9% | 3.3%(+3.63)#47 | 4.3%(+2.64)#3,794 |
| 48. | Central City | 6.9% | 3.3%(+3.59)#48 | 4.3%(+2.60)#3,830 |
| 49. | Gibbon | 6.6% | 3.3%(+3.37)#49 | 4.3%(+2.39)#4,080 |
| 50. | Hay Springs | 6.5% | 3.3%(+3.25)#50 | 4.3%(+2.27)#4,177 |
| 51. | Wood River | 6.3% | 3.3%(+3.07)#51 | 4.3%(+2.09)#4,347 |
| 52. | Benedict | 6.2% | 3.3%(+2.98)#52 | 4.3%(+2.00)#4,443 |
| 53. | Elgin | 6.1% | 3.3%(+2.87)#53 | 4.3%(+1.89)#4,552 |
| 54. | Chalco | 6.1% | 3.3%(+2.86)#54 | 4.3%(+1.88)#4,561 |
| 55. | Hadar | 6.1% | 3.3%(+2.79)#55 | 4.3%(+1.81)#4,659 |
| 56. | Bradshaw | 6.0% | 3.3%(+2.76)#56 | 4.3%(+1.77)#4,694 |
| 57. | Brule | 6.0% | 3.3%(+2.73)#57 | 4.3%(+1.75)#4,728 |
| 58. | Murdock | 6.0% | 3.3%(+2.73)#58 | 4.3%(+1.75)#4,729 |
| 59. | Julian | 5.9% | 3.3%(+2.61)#59 | 4.3%(+1.63)#4,864 |
| 60. | Pierce | 5.9% | 3.3%(+2.58)#60 | 4.3%(+1.60)#4,886 |
| 61. | Orchard | 5.8% | 3.3%(+2.50)#61 | 4.3%(+1.52)#4,980 |
| 62. | Beemer | 5.7% | 3.3%(+2.45)#62 | 4.3%(+1.46)#5,045 |
| 63. | Elwood | 5.7% | 3.3%(+2.41)#63 | 4.3%(+1.43)#5,089 |
| 64. | Wisner | 5.6% | 3.3%(+2.38)#64 | 4.3%(+1.40)#5,121 |
| 65. | Ceresco | 5.6% | 3.3%(+2.37)#65 | 4.3%(+1.38)#5,138 |
| 66. | Lodgepole | 5.4% | 3.3%(+2.14)#66 | 4.3%(+1.15)#5,440 |
| 67. | Milford | 5.3% | 3.3%(+2.02)#67 | 4.3%(+1.04)#5,585 |
| 68. | Kearney | 5.0% | 3.3%(+1.75)#68 | 4.3%(+0.768)#5,963 |
| 69. | Mccook | 5.0% | 3.3%(+1.75)#69 | 4.3%(+0.765)#5,969 |
| 70. | Loup City | 5.0% | 3.3%(+1.70)#70 | 4.3%(+0.712)#6,052 |
| 71. | Hallam | 4.9% | 3.3%(+1.61)#71 | 4.3%(+0.626)#6,216 |
| 72. | Stamford | 4.8% | 3.3%(+1.49)#72 | 4.3%(+0.510)#6,432 |
| 73. | Wayne | 4.7% | 3.3%(+1.43)#73 | 4.3%(+0.441)#6,543 |
| 74. | Clarkson | 4.7% | 3.3%(+1.38)#74 | 4.3%(+0.399)#6,623 |
| 75. | Sutton | 4.6% | 3.3%(+1.29)#75 | 4.3%(+0.309)#6,793 |
| 76. | Mead | 4.5% | 3.3%(+1.21)#76 | 4.3%(+0.226)#6,950 |
| 77. | Elmwood | 4.5% | 3.3%(+1.20)#77 | 4.3%(+0.217)#6,966 |
| 78. | Fairfield | 4.4% | 3.3%(+1.18)#78 | 4.3%(+0.192)#7,018 |
| 79. | Hastings | 4.4% | 3.3%(+1.14)#79 | 4.3%(+0.153)#7,087 |
| 80. | Stapleton | 4.3% | 3.3%(+1.08)#80 | 4.3%(+0.096)#7,195 |
| 81. | Lincoln | 4.3% | 3.3%(+1.07)#81 | 4.3%(+0.085)#7,230 |
| 82. | Ashland | 4.3% | 3.3%(+1.04)#82 | 4.3%(+0.053)#7,294 |
| 83. | Ponca | 4.2% | 3.3%(+0.974)#83 | 4.3%(-0.010)#7,424 |
| 84. | Arlington | 4.1% | 3.3%(+0.847)#84 | 4.3%(-0.137)#7,690 |
| 85. | Omaha | 4.0% | 3.3%(+0.753)#85 | 4.3%(-0.230)#7,880 |
| 86. | Johnson | 4.0% | 3.3%(+0.732)#86 | 4.3%(-0.252)#7,938 |
| 87. | Milligan | 4.0% | 3.3%(+0.732)#87 | 4.3%(-0.252)#7,939 |
| 88. | Morrill | 3.9% | 3.3%(+0.653)#88 | 4.3%(-0.331)#8,096 |
| 89. | Pender | 3.9% | 3.3%(+0.605)#89 | 4.3%(-0.379)#8,219 |
| 90. | Shelton | 3.8% | 3.3%(+0.578)#90 | 4.3%(-0.406)#8,276 |
| 91. | Staplehurst | 3.8% | 3.3%(+0.578)#91 | 4.3%(-0.406)#8,294 |
| 92. | Garland | 3.8% | 3.3%(+0.578)#92 | 4.3%(-0.406)#8,299 |
| 93. | Ralston | 3.8% | 3.3%(+0.554)#93 | 4.3%(-0.430)#8,353 |
| 94. | Auburn | 3.8% | 3.3%(+0.519)#94 | 4.3%(-0.464)#8,417 |
| 95. | Culbertson | 3.7% | 3.3%(+0.482)#95 | 4.3%(-0.502)#8,498 |
| 96. | Davenport | 3.7% | 3.3%(+0.435)#96 | 4.3%(-0.548)#8,590 |
| 97. | Aurora | 3.7% | 3.3%(+0.390)#97 | 4.3%(-0.594)#8,684 |
| 98. | Crofton | 3.6% | 3.3%(+0.368)#98 | 4.3%(-0.616)#8,738 |
| 99. | Brainard | 3.6% | 3.3%(+0.368)#99 | 4.3%(-0.616)#8,745 |
| 100. | Crete | 3.6% | 3.3%(+0.333)#100 | 4.3%(-0.650)#8,824 |
Common Questions
What are the Top 10 Cities with the Highest Percentage of Population with a Degree in Visual and Performing Arts in Nebraska?
Top 10 Cities with the Highest Percentage of Population with a Degree in Visual and Performing Arts in Nebraska are:
#1
60.0%
#2
50.0%
#3
31.6%
#4
31.2%
#5
28.6%
#6
25.0%
#7
25.0%
#8
25.0%
#9
25.0%
#10
24.7%
What city has the Highest Percentage of Population with a Degree in Visual and Performing Arts in Nebraska?
Guide Rock has the Highest Percentage of Population with a Degree in Visual and Performing Arts in Nebraska with 60.0%.
What is the Percentage of Population with a Degree in Visual and Performing Arts in the State of Nebraska?
Percentage of Population with a Degree in Visual and Performing Arts in Nebraska is 3.3%.
What is the Percentage of Population with a Degree in Visual and Performing Arts in the United States?
Percentage of Population with a Degree in Visual and Performing Arts in the United States is 4.3%.