Pleasure Point, CA Map & Demographics
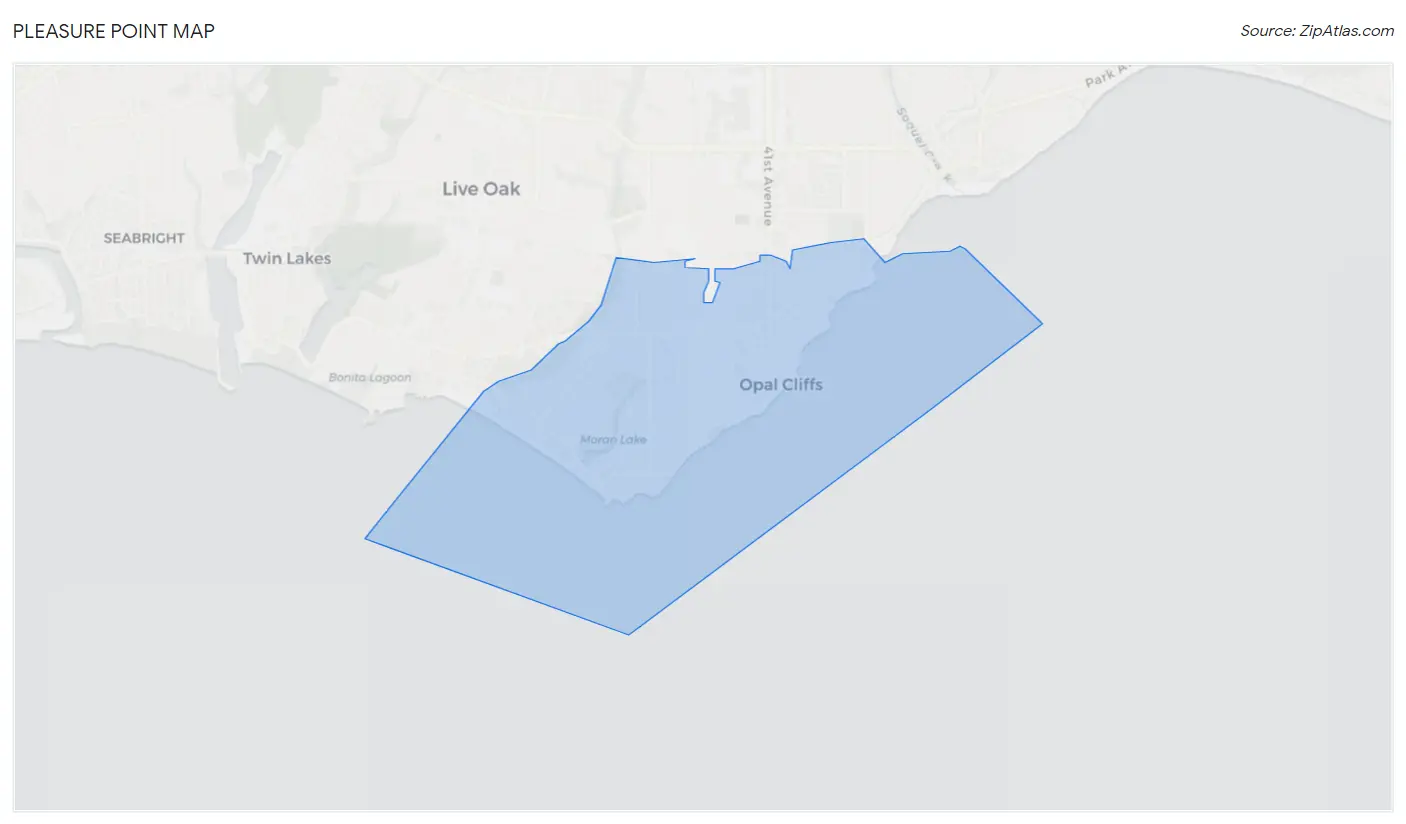
Pleasure Point Map
Pleasure Point Overview
$68,752
PER CAPITA INCOME
$137,378
AVG FAMILY INCOME
$117,551
AVG HOUSEHOLD INCOME
33.3%
WAGE / INCOME GAP [ % ]
66.7¢/ $1
WAGE / INCOME GAP [ $ ]
0.45
INEQUALITY / GINI INDEX
5,909
TOTAL POPULATION
2,772
MALE POPULATION
3,137
FEMALE POPULATION
88.36
MALES / 100 FEMALES
113.17
FEMALES / 100 MALES
47.0
MEDIAN AGE
2.7
AVG FAMILY SIZE
2.2
AVG HOUSEHOLD SIZE
3,582
LABOR FORCE [ PEOPLE ]
67.8%
PERCENT IN LABOR FORCE
3.0%
UNEMPLOYMENT RATE
Income in Pleasure Point
Income Overview in Pleasure Point
Per Capita Income in Pleasure Point is $68,752, while median incomes of families and households are $137,378 and $117,551 respectively.
| Characteristic | Number | Measure |
| Per Capita Income | 5,909 | $68,752 |
| Median Family Income | 1,635 | $137,378 |
| Mean Family Income | 1,635 | $167,053 |
| Median Household Income | 2,671 | $117,551 |
| Mean Household Income | 2,671 | $151,287 |
| Income Deficit | 1,635 | $0 |
| Wage / Income Gap (%) | 5,909 | 33.34% |
| Wage / Income Gap ($) | 5,909 | 66.66¢ per $1 |
| Gini / Inequality Index | 5,909 | 0.45 |
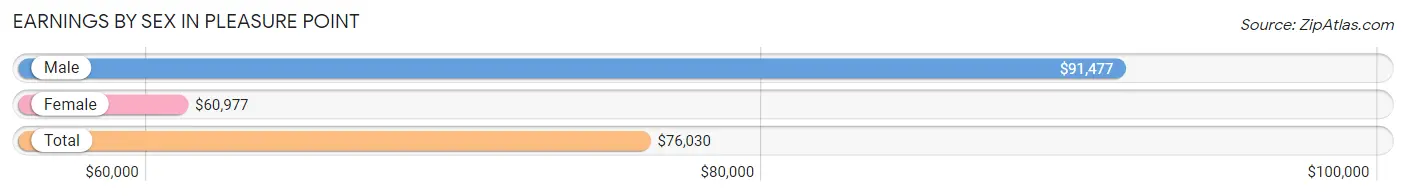
Earnings by Sex in Pleasure Point
Average Earnings in Pleasure Point are $76,030, $91,477 for men and $60,977 for women, a difference of 33.3%.
| Sex | Number | Average Earnings |
| Male | 1,848 (50.3%) | $91,477 |
| Female | 1,829 (49.7%) | $60,977 |
| Total | 3,677 (100.0%) | $76,030 |
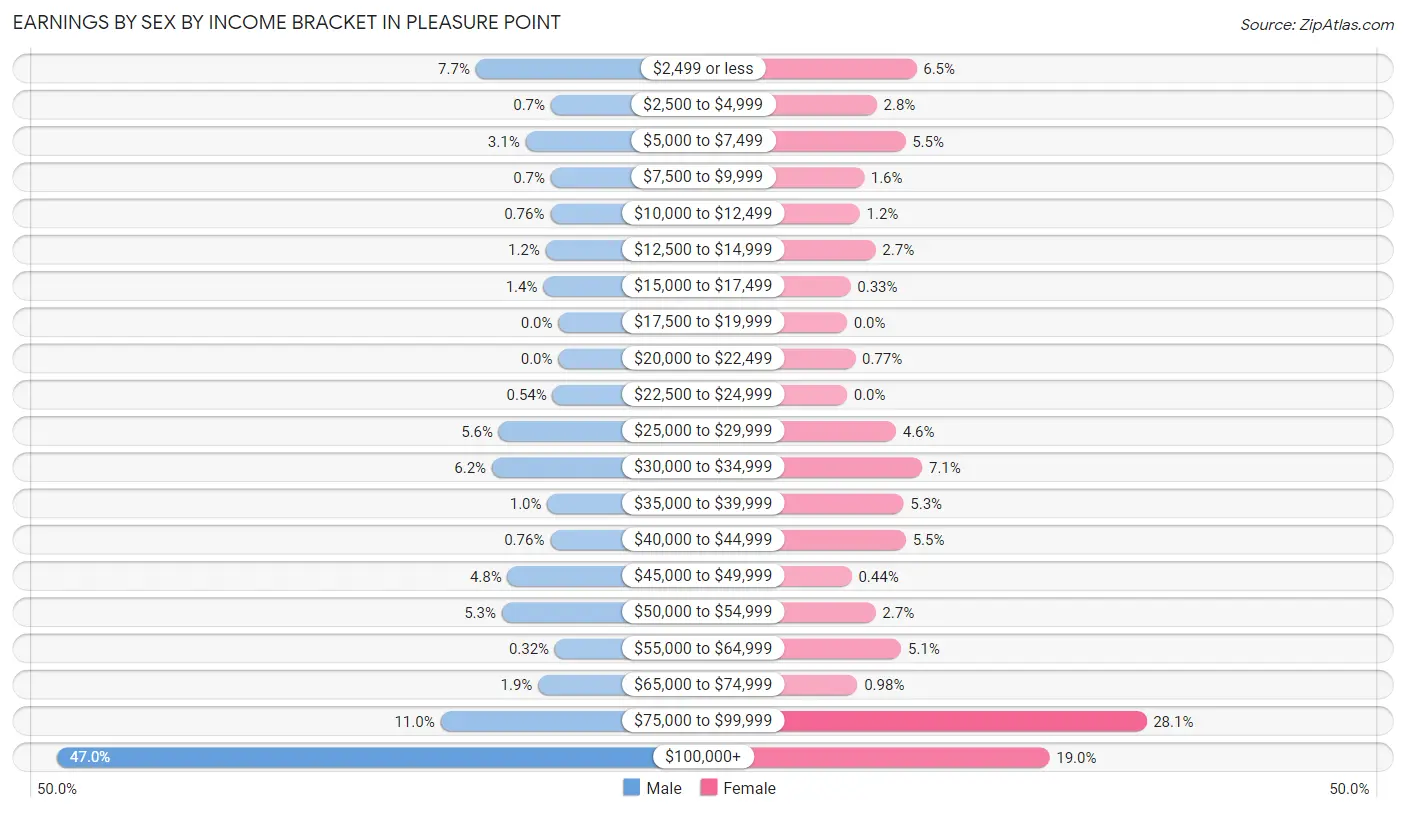
Earnings by Sex by Income Bracket in Pleasure Point
The most common earnings brackets in Pleasure Point are $100,000+ for men (868 | 47.0%) and $75,000 to $99,999 for women (513 | 28.1%).
| Income | Male | Female |
| $2,499 or less | 143 (7.7%) | 119 (6.5%) |
| $2,500 to $4,999 | 13 (0.7%) | 51 (2.8%) |
| $5,000 to $7,499 | 57 (3.1%) | 100 (5.5%) |
| $7,500 to $9,999 | 13 (0.7%) | 29 (1.6%) |
| $10,000 to $12,499 | 14 (0.8%) | 22 (1.2%) |
| $12,500 to $14,999 | 22 (1.2%) | 49 (2.7%) |
| $15,000 to $17,499 | 26 (1.4%) | 6 (0.3%) |
| $17,500 to $19,999 | 0 (0.0%) | 0 (0.0%) |
| $20,000 to $22,499 | 0 (0.0%) | 14 (0.8%) |
| $22,500 to $24,999 | 10 (0.5%) | 0 (0.0%) |
| $25,000 to $29,999 | 103 (5.6%) | 84 (4.6%) |
| $30,000 to $34,999 | 115 (6.2%) | 129 (7.0%) |
| $35,000 to $39,999 | 19 (1.0%) | 97 (5.3%) |
| $40,000 to $44,999 | 14 (0.8%) | 101 (5.5%) |
| $45,000 to $49,999 | 88 (4.8%) | 8 (0.4%) |
| $50,000 to $54,999 | 98 (5.3%) | 49 (2.7%) |
| $55,000 to $64,999 | 6 (0.3%) | 93 (5.1%) |
| $65,000 to $74,999 | 35 (1.9%) | 18 (1.0%) |
| $75,000 to $99,999 | 204 (11.0%) | 513 (28.1%) |
| $100,000+ | 868 (47.0%) | 347 (19.0%) |
| Total | 1,848 (100.0%) | 1,829 (100.0%) |
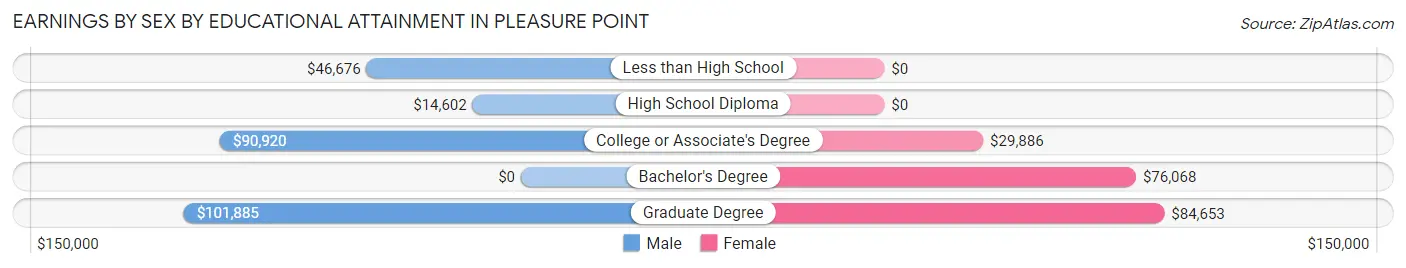
Earnings by Sex by Educational Attainment in Pleasure Point
Average earnings in Pleasure Point are $93,068 for men and $75,363 for women, a difference of 19.0%. Men with an educational attainment of graduate degree enjoy the highest average annual earnings of $101,885, while those with high school diploma education earn the least with $14,602. Women with an educational attainment of graduate degree earn the most with the average annual earnings of $84,653, while those with college or associate's degree education have the smallest earnings of $29,886.
| Educational Attainment | Male Income | Female Income |
| Less than High School | $46,676 | $0 |
| High School Diploma | $14,602 | $0 |
| College or Associate's Degree | $90,920 | $29,886 |
| Bachelor's Degree | - | - |
| Graduate Degree | $101,885 | $84,653 |
| Total | $93,068 | $75,363 |
Family Income in Pleasure Point
Family Income Brackets in Pleasure Point
According to the Pleasure Point family income data, there are 402 families falling into the $200,000+ income range, which is the most common income bracket and makes up 24.6% of all families.
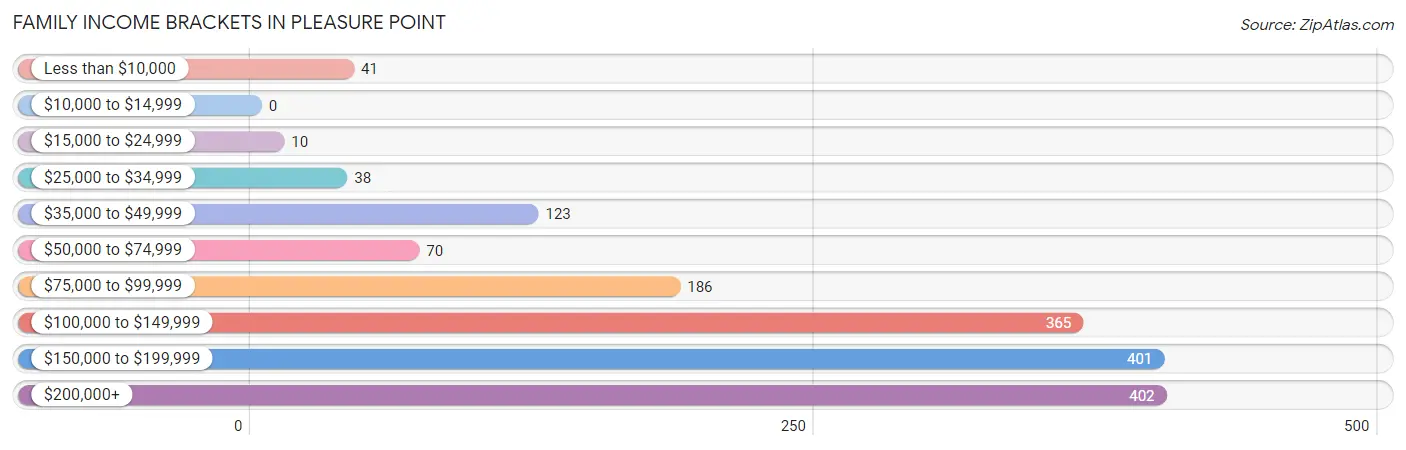
| Income Bracket | # Families | % Families |
| Less than $10,000 | 41 | 2.5% |
| $10,000 to $14,999 | 0 | 0.0% |
| $15,000 to $24,999 | 10 | 0.6% |
| $25,000 to $34,999 | 38 | 2.3% |
| $35,000 to $49,999 | 123 | 7.5% |
| $50,000 to $74,999 | 70 | 4.3% |
| $75,000 to $99,999 | 186 | 11.4% |
| $100,000 to $149,999 | 365 | 22.3% |
| $150,000 to $199,999 | 401 | 24.5% |
| $200,000+ | 402 | 24.6% |
Family Income by Famaliy Size in Pleasure Point
5-person families (42 | 2.6%) account for the highest median family income in Pleasure Point with $250,001 per family, while 2-person families (891 | 54.5%) have the highest median income of $68,186 per family member.
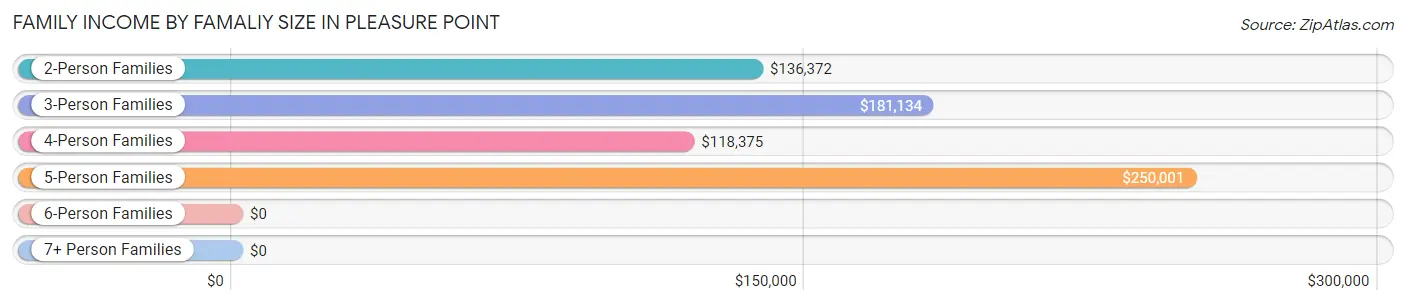
| Income Bracket | # Families | Median Income |
| 2-Person Families | 891 (54.5%) | $136,372 |
| 3-Person Families | 458 (28.0%) | $181,134 |
| 4-Person Families | 244 (14.9%) | $118,375 |
| 5-Person Families | 42 (2.6%) | $250,001 |
| 6-Person Families | 0 (0.0%) | $0 |
| 7+ Person Families | 0 (0.0%) | $0 |
| Total | 1,635 (100.0%) | $137,378 |
Family Income by Number of Earners in Pleasure Point
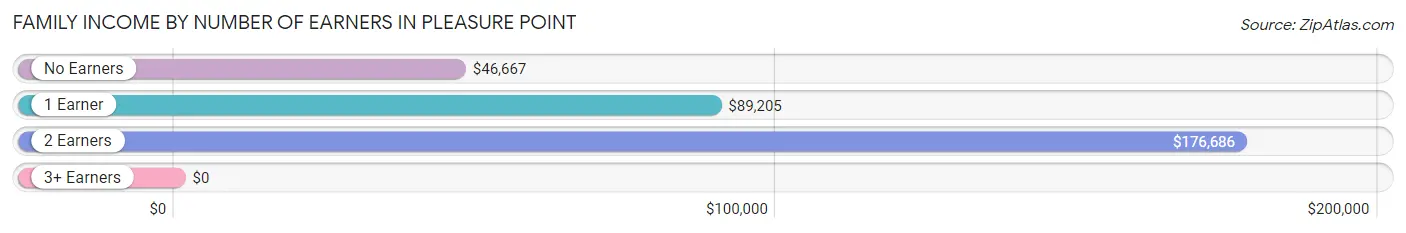
| Number of Earners | # Families | Median Income |
| No Earners | 190 (11.6%) | $46,667 |
| 1 Earner | 448 (27.4%) | $89,205 |
| 2 Earners | 865 (52.9%) | $176,686 |
| 3+ Earners | 132 (8.1%) | $0 |
| Total | 1,635 (100.0%) | $137,378 |
Household Income in Pleasure Point
Household Income Brackets in Pleasure Point
With 577 households falling in the category, the $200,000+ income range is the most frequent in Pleasure Point, accounting for 21.6% of all households. In contrast, only 61 households (2.3%) fall into the less than $10,000 income bracket, making it the least populous group.
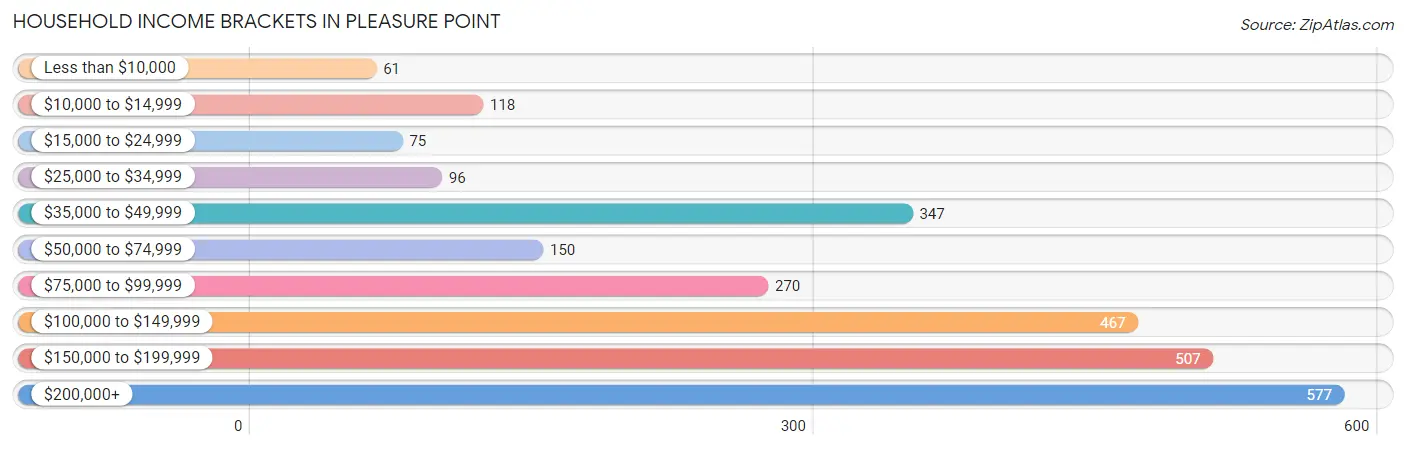
| Income Bracket | # Households | % Households |
| Less than $10,000 | 61 | 2.3% |
| $10,000 to $14,999 | 118 | 4.4% |
| $15,000 to $24,999 | 75 | 2.8% |
| $25,000 to $34,999 | 96 | 3.6% |
| $35,000 to $49,999 | 347 | 13.0% |
| $50,000 to $74,999 | 150 | 5.6% |
| $75,000 to $99,999 | 270 | 10.1% |
| $100,000 to $149,999 | 467 | 17.5% |
| $150,000 to $199,999 | 507 | 19.0% |
| $200,000+ | 577 | 21.6% |
Household Income by Householder Age in Pleasure Point
The median household income in Pleasure Point is $117,551, with the highest median household income of $157,417 found in the 45 to 64 years age bracket for the primary householder. A total of 1,212 households (45.4%) fall into this category.
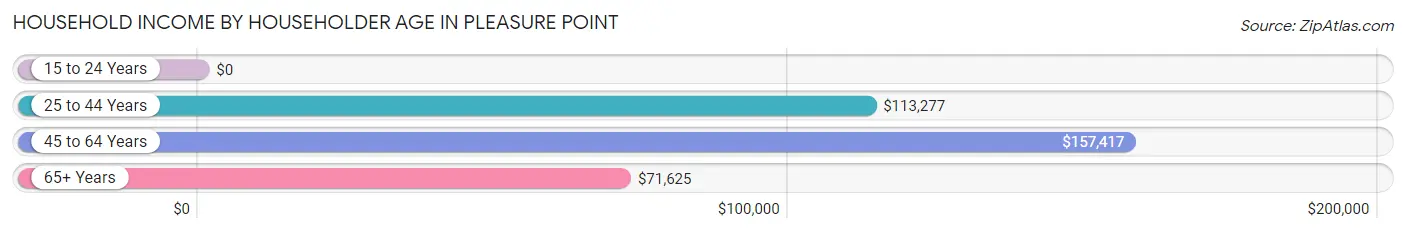
| Income Bracket | # Households | Median Income |
| 15 to 24 Years | 0 (0.0%) | $0 |
| 25 to 44 Years | 641 (24.0%) | $113,277 |
| 45 to 64 Years | 1,212 (45.4%) | $157,417 |
| 65+ Years | 818 (30.6%) | $71,625 |
| Total | 2,671 (100.0%) | $117,551 |
Poverty in Pleasure Point
Income Below Poverty by Sex and Age in Pleasure Point
With 9.4% poverty level for males and 6.4% for females among the residents of Pleasure Point, 35 to 44 year old males and 15 year old females are the most vulnerable to poverty, with 50 males (20.2%) and 33 females (24.3%) in their respective age groups living below the poverty level.
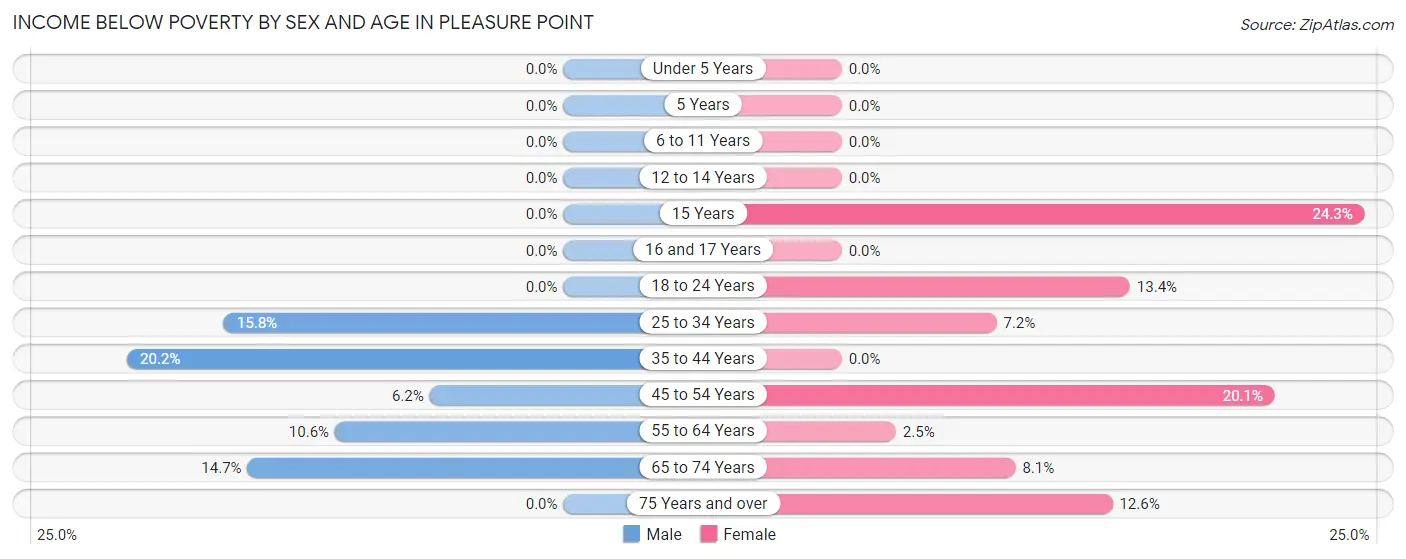
| Age Bracket | Male | Female |
| Under 5 Years | 0 (0.0%) | 0 (0.0%) |
| 5 Years | 0 (0.0%) | 0 (0.0%) |
| 6 to 11 Years | 0 (0.0%) | 0 (0.0%) |
| 12 to 14 Years | 0 (0.0%) | 0 (0.0%) |
| 15 Years | 0 (0.0%) | 33 (24.3%) |
| 16 and 17 Years | 0 (0.0%) | 0 (0.0%) |
| 18 to 24 Years | 0 (0.0%) | 25 (13.4%) |
| 25 to 34 Years | 43 (15.8%) | 27 (7.2%) |
| 35 to 44 Years | 50 (20.2%) | 0 (0.0%) |
| 45 to 54 Years | 42 (6.2%) | 46 (20.1%) |
| 55 to 64 Years | 58 (10.6%) | 16 (2.5%) |
| 65 to 74 Years | 68 (14.7%) | 27 (8.1%) |
| 75 Years and over | 0 (0.0%) | 26 (12.6%) |
| Total | 261 (9.4%) | 200 (6.4%) |
Income Above Poverty by Sex and Age in Pleasure Point
According to the poverty statistics in Pleasure Point, males aged under 5 years and females aged under 5 years are the age groups that are most secure financially, with 100.0% of males and 100.0% of females in these age groups living above the poverty line.
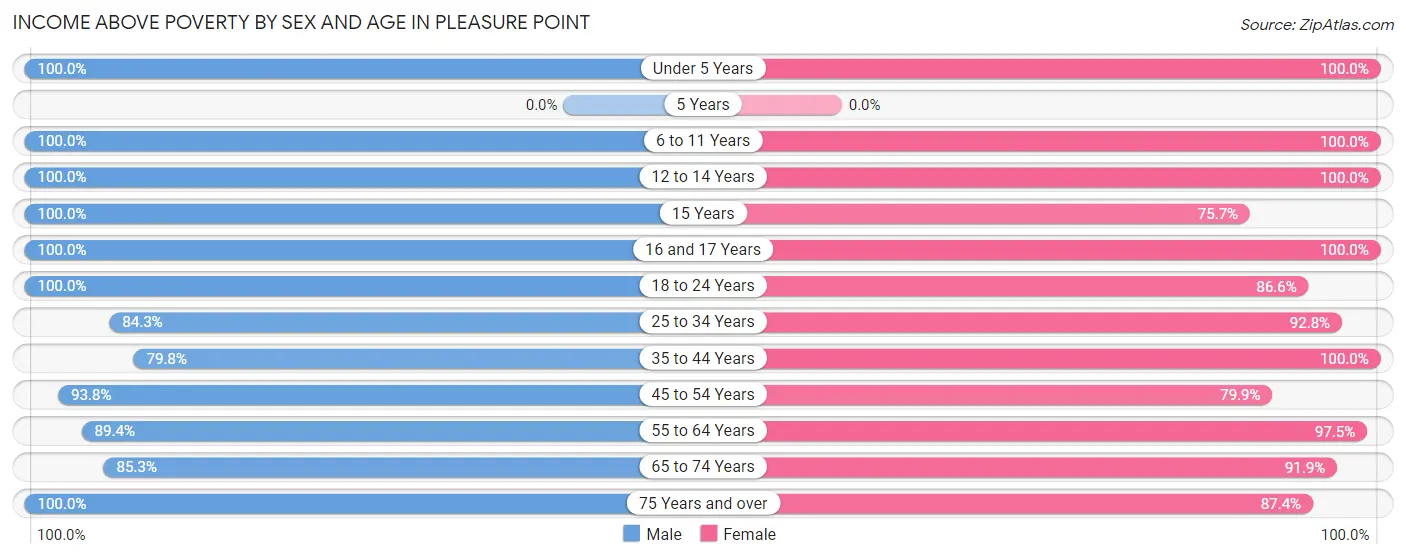
| Age Bracket | Male | Female |
| Under 5 Years | 48 (100.0%) | 165 (100.0%) |
| 5 Years | 0 (0.0%) | 0 (0.0%) |
| 6 to 11 Years | 82 (100.0%) | 26 (100.0%) |
| 12 to 14 Years | 71 (100.0%) | 95 (100.0%) |
| 15 Years | 3 (100.0%) | 103 (75.7%) |
| 16 and 17 Years | 27 (100.0%) | 143 (100.0%) |
| 18 to 24 Years | 121 (100.0%) | 162 (86.6%) |
| 25 to 34 Years | 230 (84.3%) | 349 (92.8%) |
| 35 to 44 Years | 197 (79.8%) | 601 (100.0%) |
| 45 to 54 Years | 634 (93.8%) | 183 (79.9%) |
| 55 to 64 Years | 489 (89.4%) | 621 (97.5%) |
| 65 to 74 Years | 396 (85.3%) | 308 (91.9%) |
| 75 Years and over | 213 (100.0%) | 181 (87.4%) |
| Total | 2,511 (90.6%) | 2,937 (93.6%) |
Income Below Poverty Among Married-Couple Families in Pleasure Point
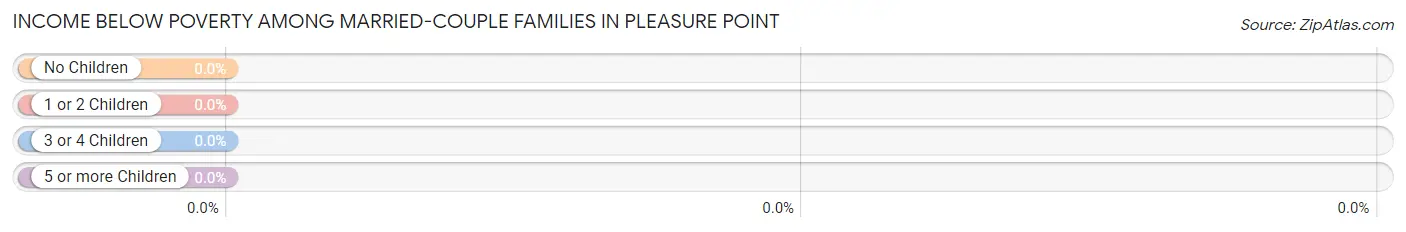
| Children | Above Poverty | Below Poverty |
| No Children | 956 (100.0%) | 0 (0.0%) |
| 1 or 2 Children | 485 (100.0%) | 0 (0.0%) |
| 3 or 4 Children | 19 (100.0%) | 0 (0.0%) |
| 5 or more Children | 0 (0.0%) | 0 (0.0%) |
| Total | 1,460 (100.0%) | 0 (0.0%) |
Income Below Poverty Among Single-Parent Households in Pleasure Point
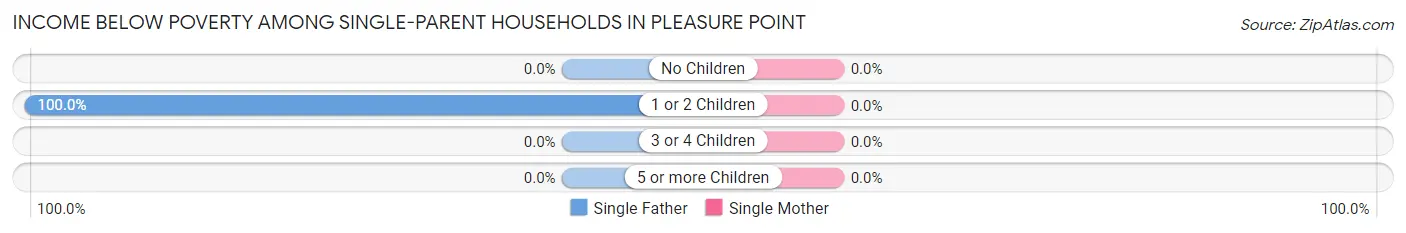
| Children | Single Father | Single Mother |
| No Children | 0 (0.0%) | 0 (0.0%) |
| 1 or 2 Children | 41 (100.0%) | 0 (0.0%) |
| 3 or 4 Children | 0 (0.0%) | 0 (0.0%) |
| 5 or more Children | 0 (0.0%) | 0 (0.0%) |
| Total | 41 (57.8%) | 0 (0.0%) |
Income Below Poverty Among Married-Couple vs Single-Parent Households in Pleasure Point
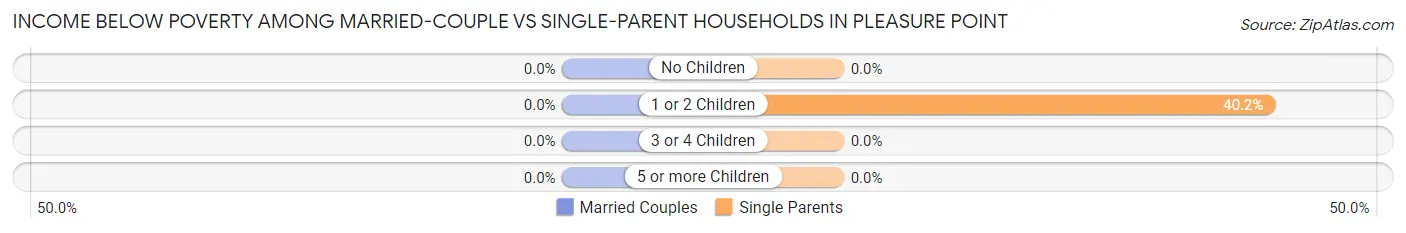
| Children | Married-Couple Families | Single-Parent Households |
| No Children | 0 (0.0%) | 0 (0.0%) |
| 1 or 2 Children | 0 (0.0%) | 41 (40.2%) |
| 3 or 4 Children | 0 (0.0%) | 0 (0.0%) |
| 5 or more Children | 0 (0.0%) | 0 (0.0%) |
| Total | 0 (0.0%) | 41 (23.4%) |
Race in Pleasure Point
The most populous races in Pleasure Point are White / Caucasian (4,530 | 76.7%), Hispanic or Latino (1,113 | 18.8%), and Two or more Races (733 | 12.4%).
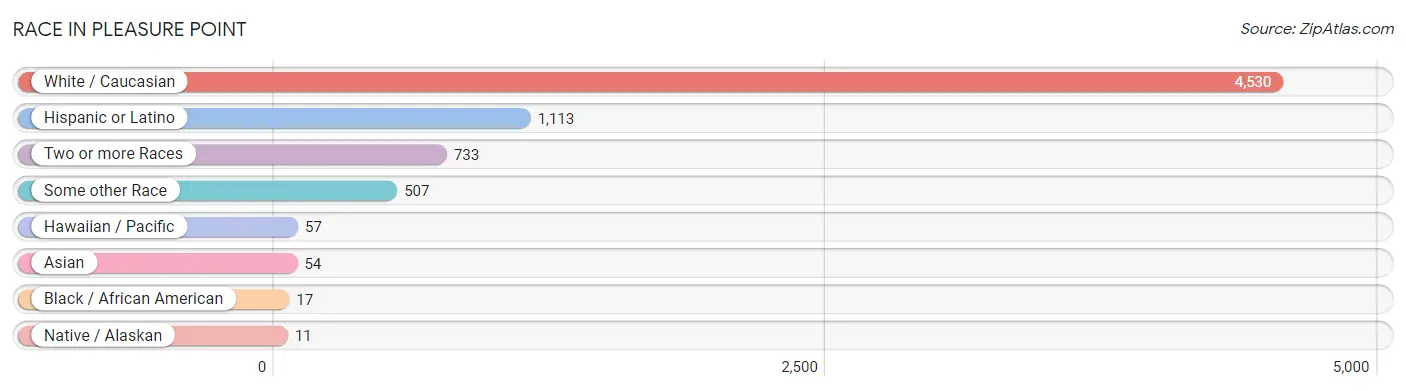
| Race | # Population | % Population |
| Asian | 54 | 0.9% |
| Black / African American | 17 | 0.3% |
| Hawaiian / Pacific | 57 | 1.0% |
| Hispanic or Latino | 1,113 | 18.8% |
| Native / Alaskan | 11 | 0.2% |
| White / Caucasian | 4,530 | 76.7% |
| Two or more Races | 733 | 12.4% |
| Some other Race | 507 | 8.6% |
| Total | 5,909 | 100.0% |
Ancestry in Pleasure Point
The most populous ancestries reported in Pleasure Point are Irish (975 | 16.5%), German (788 | 13.3%), English (776 | 13.1%), Mexican (746 | 12.6%), and Italian (427 | 7.2%), together accounting for 62.8% of all Pleasure Point residents.
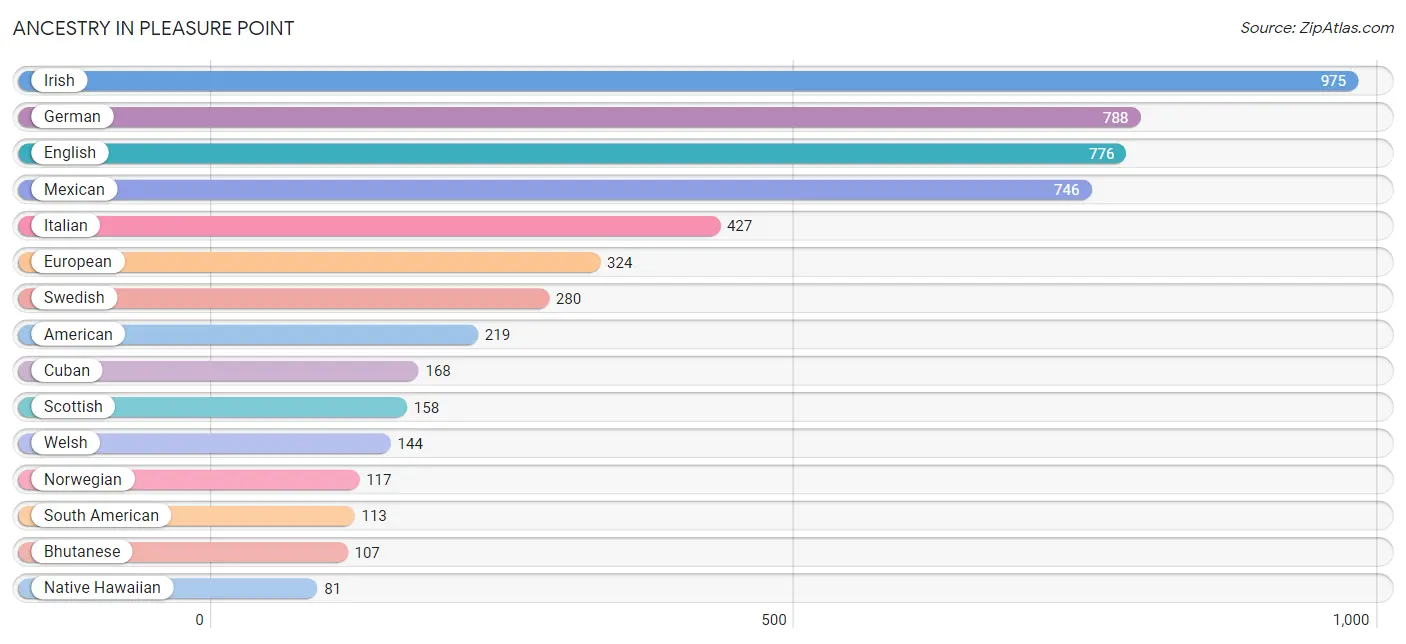
| Ancestry | # Population | % Population |
| American | 219 | 3.7% |
| Australian | 18 | 0.3% |
| Bhutanese | 107 | 1.8% |
| British | 45 | 0.8% |
| Canadian | 32 | 0.5% |
| Celtic | 11 | 0.2% |
| Cherokee | 64 | 1.1% |
| Colombian | 59 | 1.0% |
| Cuban | 168 | 2.8% |
| Czech | 24 | 0.4% |
| Danish | 37 | 0.6% |
| Dutch | 34 | 0.6% |
| Eastern European | 21 | 0.4% |
| English | 776 | 13.1% |
| European | 324 | 5.5% |
| Finnish | 50 | 0.9% |
| French | 73 | 1.2% |
| French Canadian | 51 | 0.9% |
| German | 788 | 13.3% |
| Iranian | 46 | 0.8% |
| Irish | 975 | 16.5% |
| Italian | 427 | 7.2% |
| Laotian | 19 | 0.3% |
| Lithuanian | 38 | 0.6% |
| Mexican | 746 | 12.6% |
| Native Hawaiian | 81 | 1.4% |
| Northern European | 53 | 0.9% |
| Norwegian | 117 | 2.0% |
| Pennsylvania German | 21 | 0.4% |
| Peruvian | 38 | 0.6% |
| Polish | 78 | 1.3% |
| Portuguese | 80 | 1.3% |
| Puerto Rican | 66 | 1.1% |
| Scandinavian | 43 | 0.7% |
| Scotch-Irish | 39 | 0.7% |
| Scottish | 158 | 2.7% |
| Sioux | 41 | 0.7% |
| Slovak | 20 | 0.3% |
| South American | 113 | 1.9% |
| Spanish | 20 | 0.3% |
| Swedish | 280 | 4.7% |
| Swiss | 58 | 1.0% |
| Thai | 54 | 0.9% |
| Turkish | 9 | 0.2% |
| Ukrainian | 9 | 0.2% |
| Uruguayan | 16 | 0.3% |
| Welsh | 144 | 2.4% | View All 47 Rows |
Immigrants in Pleasure Point
The most numerous immigrant groups reported in Pleasure Point came from Latin America (255 | 4.3%), Central America (201 | 3.4%), Mexico (188 | 3.2%), Europe (137 | 2.3%), and Northern Europe (90 | 1.5%), together accounting for 14.7% of all Pleasure Point residents.
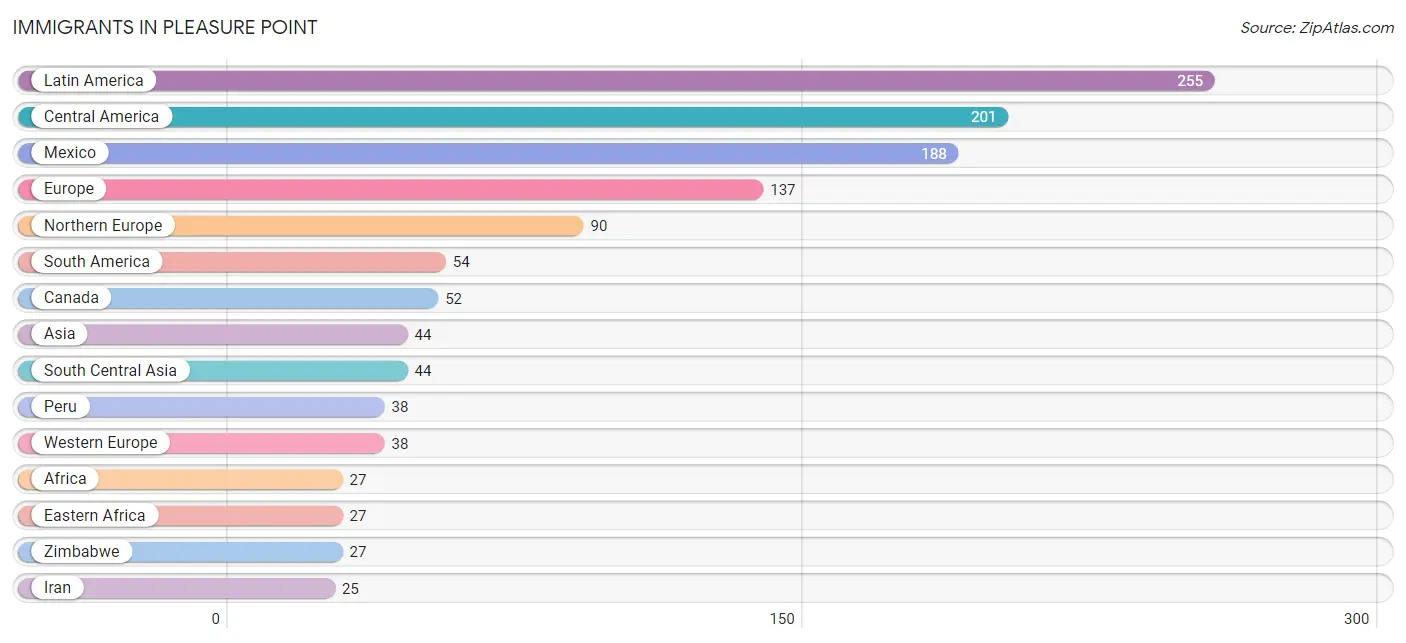
| Immigration Origin | # Population | % Population |
| Africa | 27 | 0.5% |
| Asia | 44 | 0.7% |
| Australia | 22 | 0.4% |
| Canada | 52 | 0.9% |
| Central America | 201 | 3.4% |
| Eastern Africa | 27 | 0.5% |
| Eastern Europe | 9 | 0.2% |
| Europe | 137 | 2.3% |
| Guatemala | 13 | 0.2% |
| India | 19 | 0.3% |
| Iran | 25 | 0.4% |
| Latin America | 255 | 4.3% |
| Mexico | 188 | 3.2% |
| Netherlands | 19 | 0.3% |
| Northern Europe | 90 | 1.5% |
| Oceania | 22 | 0.4% |
| Peru | 38 | 0.6% |
| South America | 54 | 0.9% |
| South Central Asia | 44 | 0.7% |
| Sweden | 15 | 0.3% |
| Switzerland | 19 | 0.3% |
| Ukraine | 9 | 0.2% |
| Uruguay | 16 | 0.3% |
| Western Europe | 38 | 0.6% |
| Zimbabwe | 27 | 0.5% | View All 25 Rows |
Sex and Age in Pleasure Point
Sex and Age in Pleasure Point
The most populous age groups in Pleasure Point are 45 to 49 Years (351 | 12.7%) for men and 40 to 44 Years (421 | 13.4%) for women.
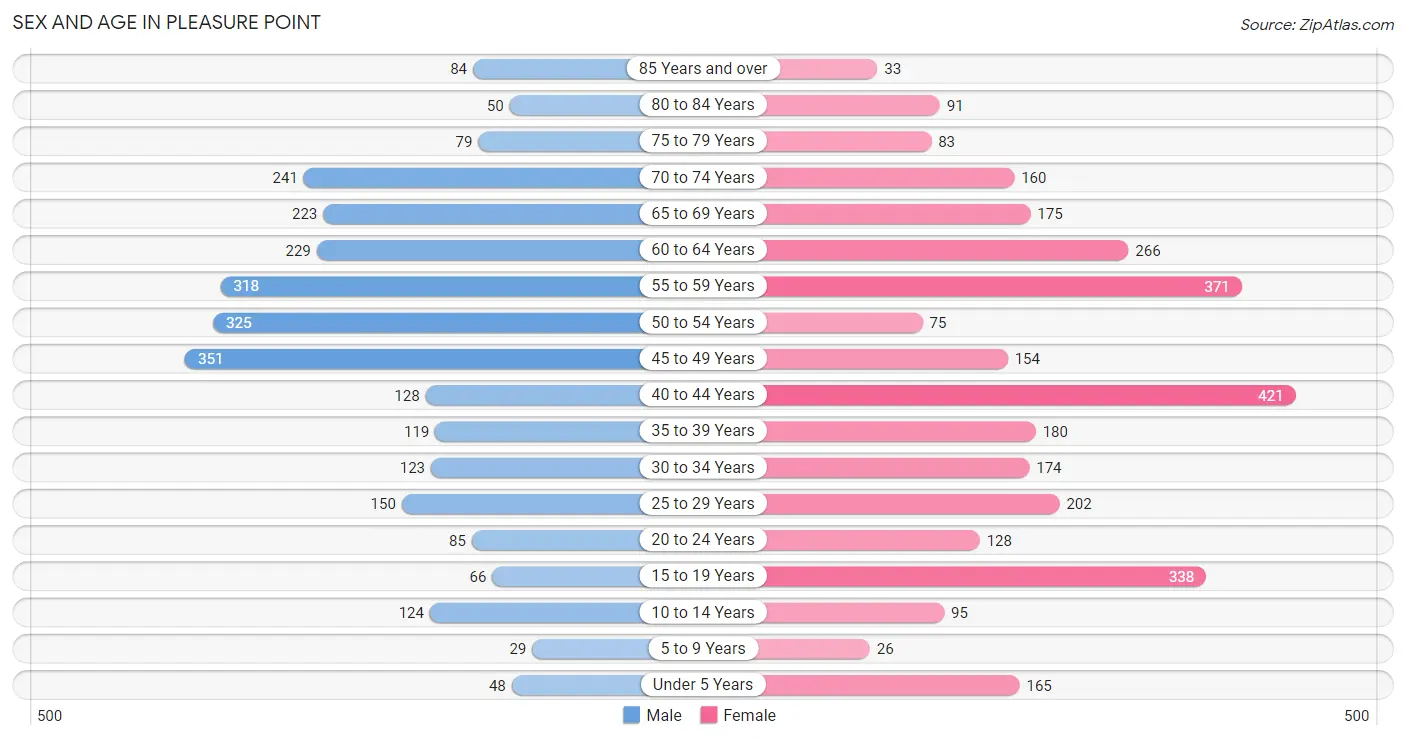
| Age Bracket | Male | Female |
| Under 5 Years | 48 (1.7%) | 165 (5.3%) |
| 5 to 9 Years | 29 (1.1%) | 26 (0.8%) |
| 10 to 14 Years | 124 (4.5%) | 95 (3.0%) |
| 15 to 19 Years | 66 (2.4%) | 338 (10.8%) |
| 20 to 24 Years | 85 (3.1%) | 128 (4.1%) |
| 25 to 29 Years | 150 (5.4%) | 202 (6.4%) |
| 30 to 34 Years | 123 (4.4%) | 174 (5.6%) |
| 35 to 39 Years | 119 (4.3%) | 180 (5.7%) |
| 40 to 44 Years | 128 (4.6%) | 421 (13.4%) |
| 45 to 49 Years | 351 (12.7%) | 154 (4.9%) |
| 50 to 54 Years | 325 (11.7%) | 75 (2.4%) |
| 55 to 59 Years | 318 (11.5%) | 371 (11.8%) |
| 60 to 64 Years | 229 (8.3%) | 266 (8.5%) |
| 65 to 69 Years | 223 (8.0%) | 175 (5.6%) |
| 70 to 74 Years | 241 (8.7%) | 160 (5.1%) |
| 75 to 79 Years | 79 (2.9%) | 83 (2.6%) |
| 80 to 84 Years | 50 (1.8%) | 91 (2.9%) |
| 85 Years and over | 84 (3.0%) | 33 (1.1%) |
| Total | 2,772 (100.0%) | 3,137 (100.0%) |
Families and Households in Pleasure Point
Median Family Size in Pleasure Point
The median family size in Pleasure Point is 2.66 persons per family, with single female/mother families (104 | 6.4%) accounting for the largest median family size of 3.33 persons per family. On the other hand, single male/father families (71 | 4.3%) represent the smallest median family size with 2.27 persons per family.
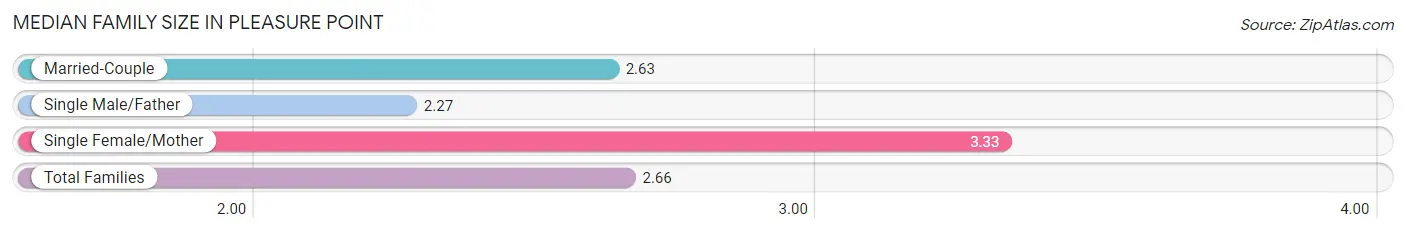
| Family Type | # Families | Family Size |
| Married-Couple | 1,460 (89.3%) | 2.63 |
| Single Male/Father | 71 (4.3%) | 2.27 |
| Single Female/Mother | 104 (6.4%) | 3.33 |
| Total Families | 1,635 (100.0%) | 2.66 |
Median Household Size in Pleasure Point
The median household size in Pleasure Point is 2.21 persons per household, with single female/mother households (104 | 3.9%) accounting for the largest median household size of 3.99 persons per household. non-family households (1,036 | 38.8%) represent the smallest median household size with 1.35 persons per household.
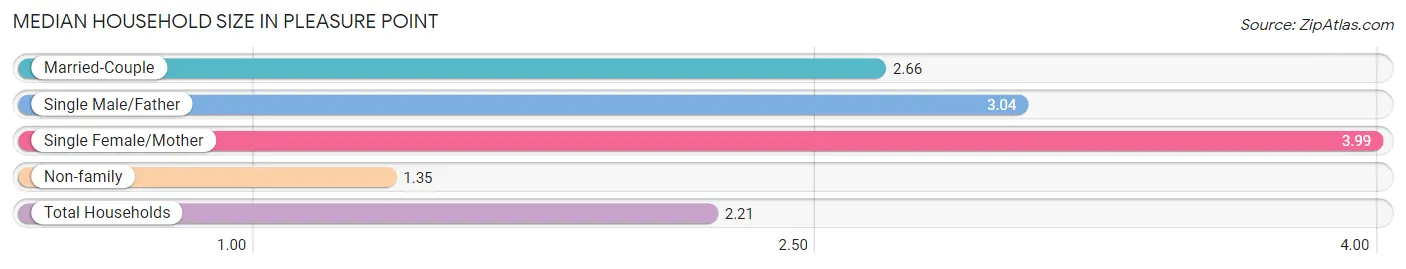
| Household Type | # Households | Household Size |
| Married-Couple | 1,460 (54.7%) | 2.66 |
| Single Male/Father | 71 (2.7%) | 3.04 |
| Single Female/Mother | 104 (3.9%) | 3.99 |
| Non-family | 1,036 (38.8%) | 1.35 |
| Total Households | 2,671 (100.0%) | 2.21 |
Household Size by Marriage Status in Pleasure Point
Out of a total of 2,671 households in Pleasure Point, 1,635 (61.2%) are family households, while 1,036 (38.8%) are nonfamily households. The most numerous type of family households are 2-person households, comprising 833, and the most common type of nonfamily households are 1-person households, comprising 741.
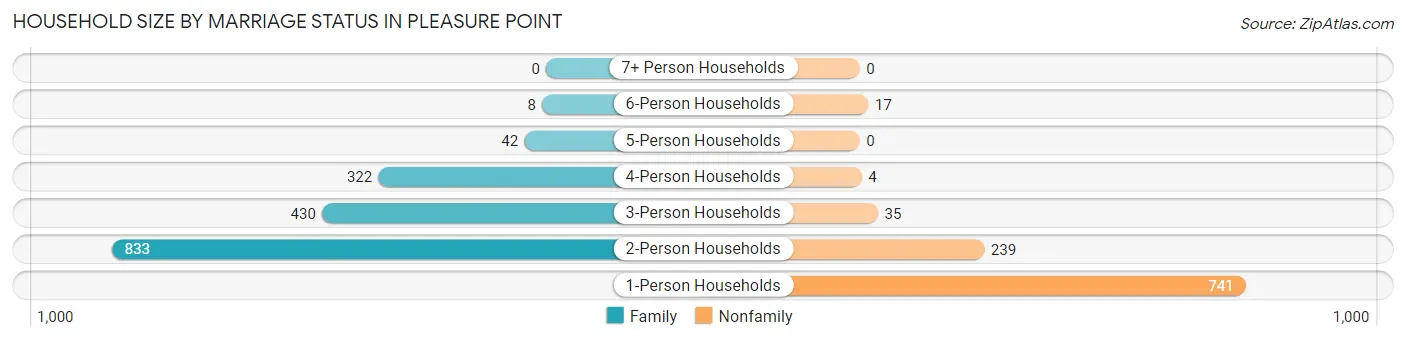
| Household Size | Family Households | Nonfamily Households |
| 1-Person Households | - | 741 (27.7%) |
| 2-Person Households | 833 (31.2%) | 239 (8.9%) |
| 3-Person Households | 430 (16.1%) | 35 (1.3%) |
| 4-Person Households | 322 (12.1%) | 4 (0.2%) |
| 5-Person Households | 42 (1.6%) | 0 (0.0%) |
| 6-Person Households | 8 (0.3%) | 17 (0.6%) |
| 7+ Person Households | 0 (0.0%) | 0 (0.0%) |
| Total | 1,635 (61.2%) | 1,036 (38.8%) |
Female Fertility in Pleasure Point
Fertility by Age in Pleasure Point
Average fertility rate in Pleasure Point is 19.0 births per 1,000 women. Women in the age bracket of 20 to 34 years have the highest fertility rate with 48.0 births per 1,000 women. Women in the age bracket of 20 to 34 years acount for 80.0% of all women with births.
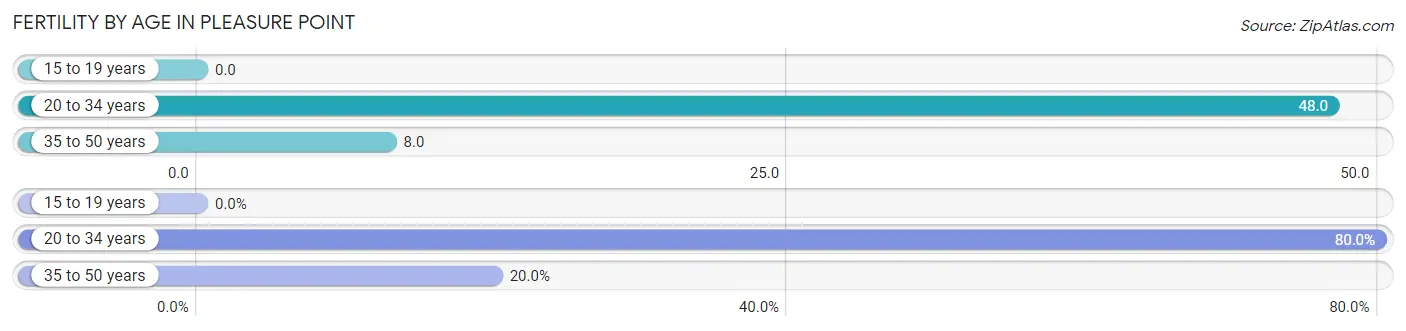
| Age Bracket | Women with Births | Births / 1,000 Women |
| 15 to 19 years | 0 (0.0%) | 0.0 |
| 20 to 34 years | 24 (80.0%) | 48.0 |
| 35 to 50 years | 6 (20.0%) | 8.0 |
| Total | 30 (100.0%) | 19.0 |
Fertility by Age by Marriage Status in Pleasure Point
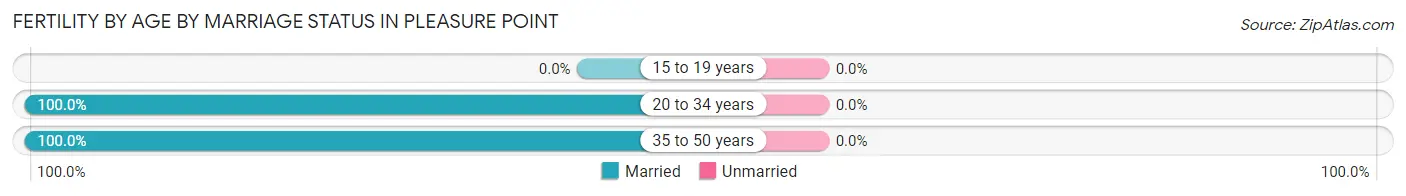
| Age Bracket | Married | Unmarried |
| 15 to 19 years | 0 (0.0%) | 0 (0.0%) |
| 20 to 34 years | 24 (100.0%) | 0 (0.0%) |
| 35 to 50 years | 6 (100.0%) | 0 (0.0%) |
| Total | 30 (100.0%) | 0 (0.0%) |
Fertility by Education in Pleasure Point
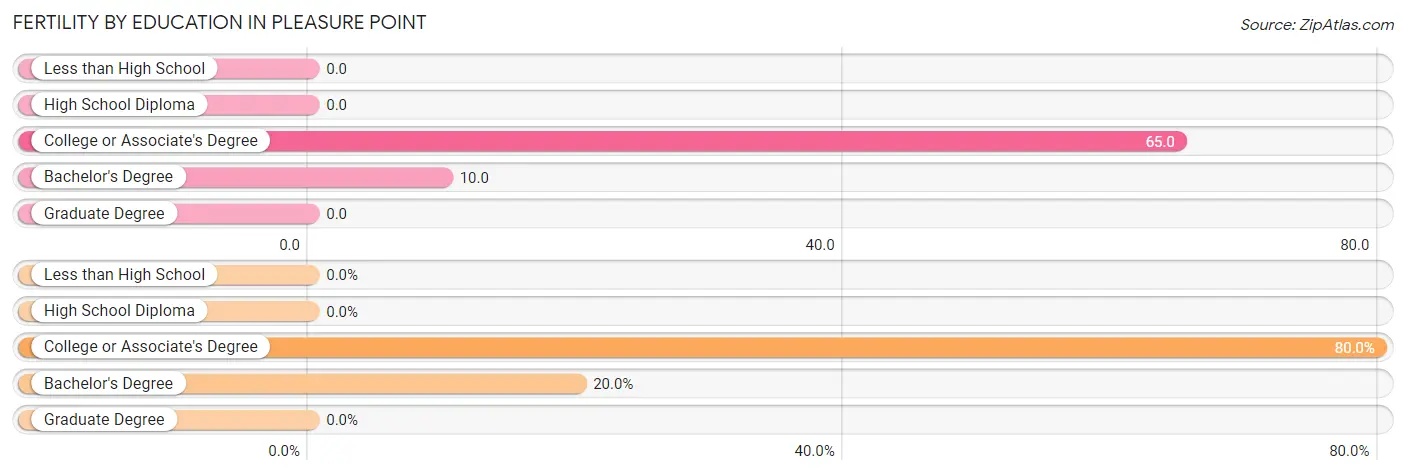
| Educational Attainment | Women with Births | Births / 1,000 Women |
| Less than High School | 0 (0.0%) | 0.0 |
| High School Diploma | 0 (0.0%) | 0.0 |
| College or Associate's Degree | 24 (80.0%) | 65.0 |
| Bachelor's Degree | 6 (20.0%) | 10.0 |
| Graduate Degree | 0 (0.0%) | 0.0 |
| Total | 30 (100.0%) | 19.0 |
Fertility by Education by Marriage Status in Pleasure Point
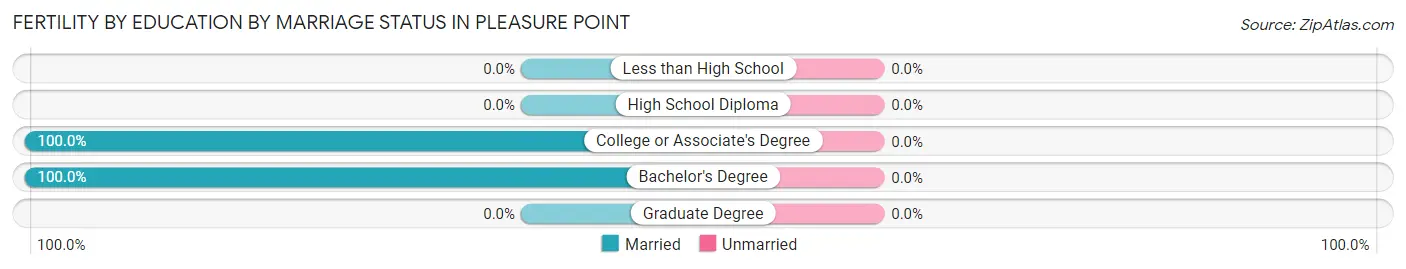
| Educational Attainment | Married | Unmarried |
| Less than High School | 0 (0.0%) | 0 (0.0%) |
| High School Diploma | 0 (0.0%) | 0 (0.0%) |
| College or Associate's Degree | 24 (100.0%) | 0 (0.0%) |
| Bachelor's Degree | 6 (100.0%) | 0 (0.0%) |
| Graduate Degree | 0 (0.0%) | 0 (0.0%) |
| Total | 30 (100.0%) | 0 (0.0%) |
Employment Characteristics in Pleasure Point
Employment by Class of Employer in Pleasure Point
Among the 3,331 employed individuals in Pleasure Point, private company employees (2,051 | 61.6%), local government employees (414 | 12.4%), and self-employed (incorporated) (260 | 7.8%) make up the most common classes of employment.
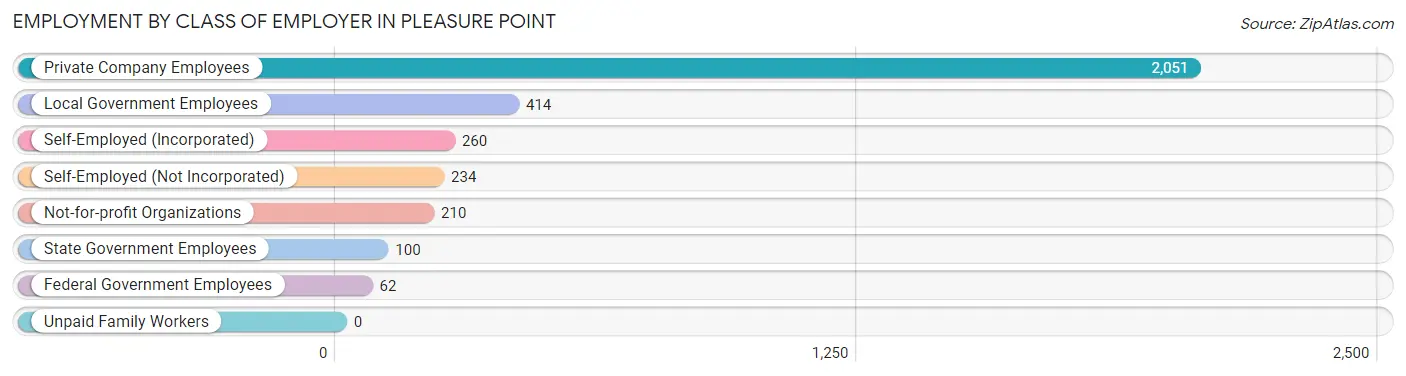
| Employer Class | # Employees | % Employees |
| Private Company Employees | 2,051 | 61.6% |
| Self-Employed (Incorporated) | 260 | 7.8% |
| Self-Employed (Not Incorporated) | 234 | 7.0% |
| Not-for-profit Organizations | 210 | 6.3% |
| Local Government Employees | 414 | 12.4% |
| State Government Employees | 100 | 3.0% |
| Federal Government Employees | 62 | 1.9% |
| Unpaid Family Workers | 0 | 0.0% |
| Total | 3,331 | 100.0% |
Employment Status by Age in Pleasure Point
According to the labor force statistics for Pleasure Point, out of the total population over 16 years of age (5,283), 67.8% or 3,582 individuals are in the labor force, with 3.0% or 107 of them unemployed. The age group with the highest labor force participation rate is 30 to 34 years, with 93.9% or 279 individuals in the labor force. Within the labor force, the 25 to 29 years age range has the highest percentage of unemployed individuals, with 11.9% or 35 of them being unemployed.
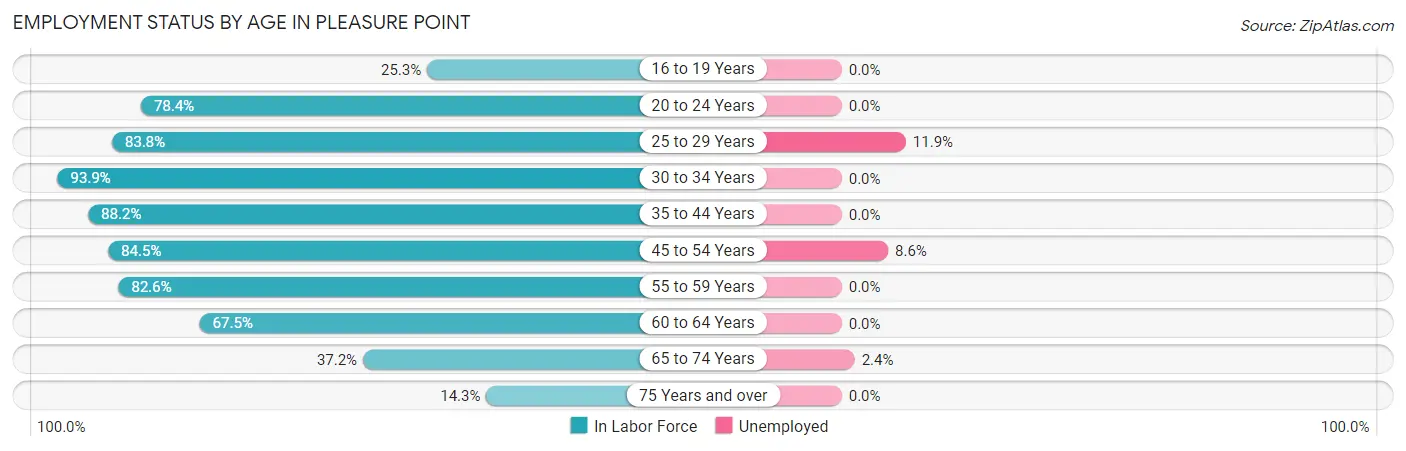
| Age Bracket | In Labor Force | Unemployed |
| 16 to 19 Years | 67 (25.3%) | 0 (0.0%) |
| 20 to 24 Years | 167 (78.4%) | 0 (0.0%) |
| 25 to 29 Years | 295 (83.8%) | 35 (11.9%) |
| 30 to 34 Years | 279 (93.9%) | 0 (0.0%) |
| 35 to 44 Years | 748 (88.2%) | 0 (0.0%) |
| 45 to 54 Years | 765 (84.5%) | 66 (8.6%) |
| 55 to 59 Years | 569 (82.6%) | 0 (0.0%) |
| 60 to 64 Years | 334 (67.5%) | 0 (0.0%) |
| 65 to 74 Years | 297 (37.2%) | 7 (2.4%) |
| 75 Years and over | 60 (14.3%) | 0 (0.0%) |
| Total | 3,582 (67.8%) | 107 (3.0%) |
Employment Status by Educational Attainment in Pleasure Point
According to labor force statistics for Pleasure Point, 83.4% of individuals (2,991) out of the total population between 25 and 64 years of age (3,586) are in the labor force, with 3.4% or 102 of them being unemployed. The group with the highest labor force participation rate are those with the educational attainment of bachelor's degree or higher, with 89.5% or 1,769 individuals in the labor force. Within the labor force, individuals with less than high school education have the highest percentage of unemployment, with 23.9% or 42 of them being unemployed.
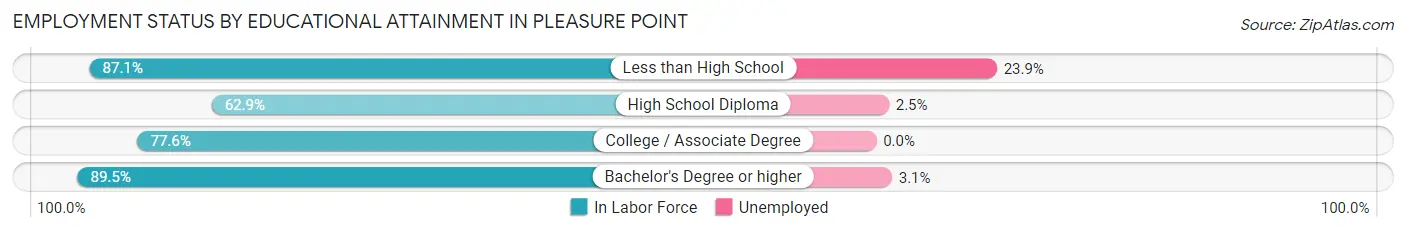
| Educational Attainment | In Labor Force | Unemployed |
| Less than High School | 176 (87.1%) | 48 (23.9%) |
| High School Diploma | 198 (62.9%) | 8 (2.5%) |
| College / Associate Degree | 847 (77.6%) | 0 (0.0%) |
| Bachelor's Degree or higher | 1,769 (89.5%) | 61 (3.1%) |
| Total | 2,991 (83.4%) | 122 (3.4%) |
Employment Occupations by Sex in Pleasure Point
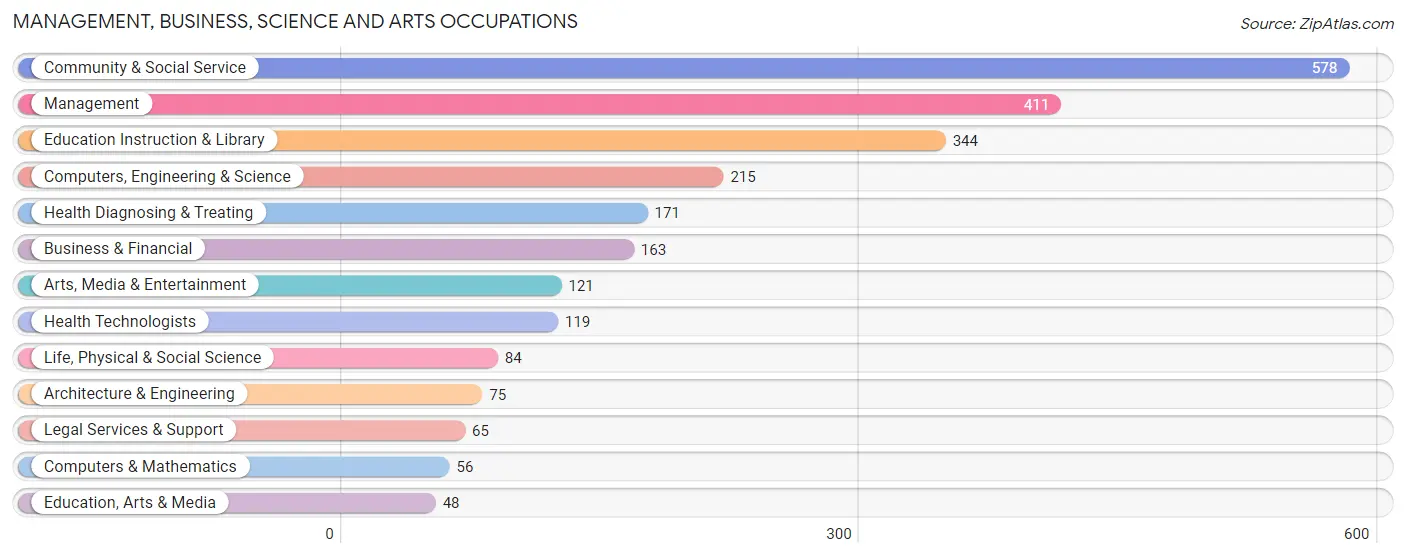
Management, Business, Science and Arts Occupations
The most common Management, Business, Science and Arts occupations in Pleasure Point are Community & Social Service (578 | 16.6%), Management (411 | 11.8%), Education Instruction & Library (344 | 9.9%), Computers, Engineering & Science (215 | 6.2%), and Health Diagnosing & Treating (171 | 4.9%).
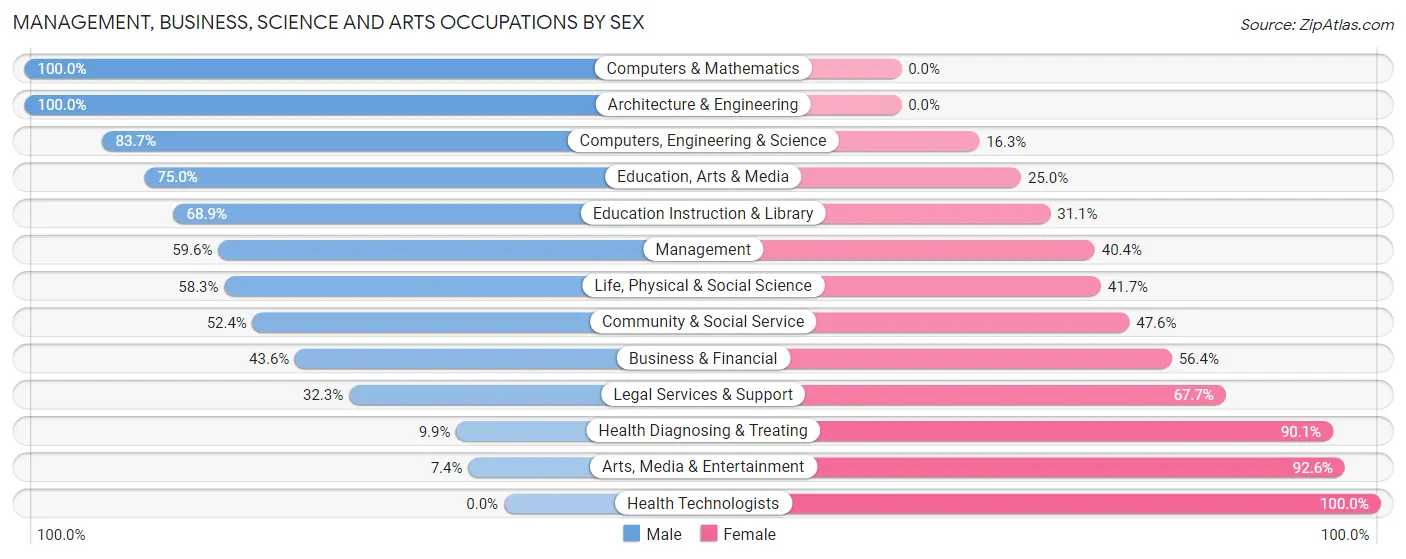
Management, Business, Science and Arts Occupations by Sex
Within the Management, Business, Science and Arts occupations in Pleasure Point, the most male-oriented occupations are Computers & Mathematics (100.0%), Architecture & Engineering (100.0%), and Computers, Engineering & Science (83.7%), while the most female-oriented occupations are Health Technologists (100.0%), Arts, Media & Entertainment (92.6%), and Health Diagnosing & Treating (90.1%).
| Occupation | Male | Female |
| Management | 245 (59.6%) | 166 (40.4%) |
| Business & Financial | 71 (43.6%) | 92 (56.4%) |
| Computers, Engineering & Science | 180 (83.7%) | 35 (16.3%) |
| Computers & Mathematics | 56 (100.0%) | 0 (0.0%) |
| Architecture & Engineering | 75 (100.0%) | 0 (0.0%) |
| Life, Physical & Social Science | 49 (58.3%) | 35 (41.7%) |
| Community & Social Service | 303 (52.4%) | 275 (47.6%) |
| Education, Arts & Media | 36 (75.0%) | 12 (25.0%) |
| Legal Services & Support | 21 (32.3%) | 44 (67.7%) |
| Education Instruction & Library | 237 (68.9%) | 107 (31.1%) |
| Arts, Media & Entertainment | 9 (7.4%) | 112 (92.6%) |
| Health Diagnosing & Treating | 17 (9.9%) | 154 (90.1%) |
| Health Technologists | 0 (0.0%) | 119 (100.0%) |
| Total (Category) | 816 (53.1%) | 722 (46.9%) |
| Total (Overall) | 1,730 (49.8%) | 1,743 (50.2%) |
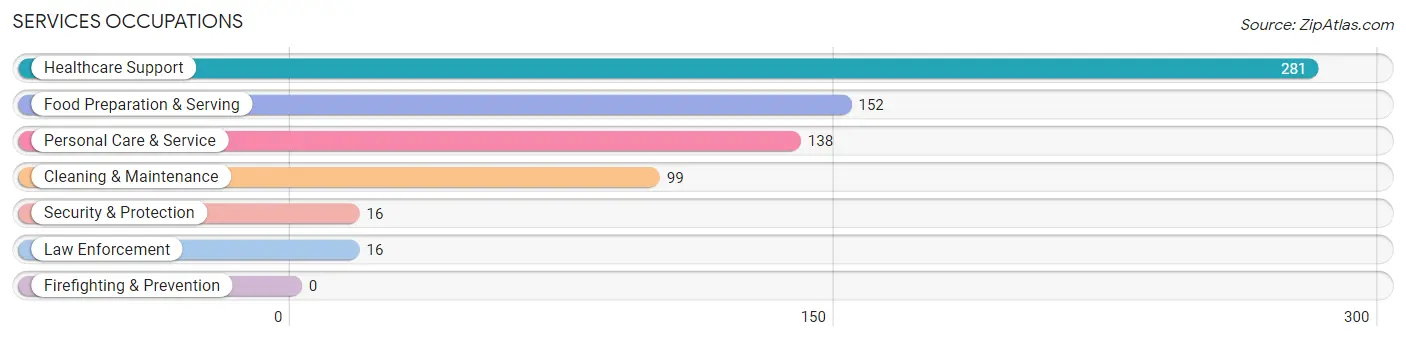
Services Occupations
The most common Services occupations in Pleasure Point are Healthcare Support (281 | 8.1%), Food Preparation & Serving (152 | 4.4%), Personal Care & Service (138 | 4.0%), Cleaning & Maintenance (99 | 2.9%), and Security & Protection (16 | 0.5%).
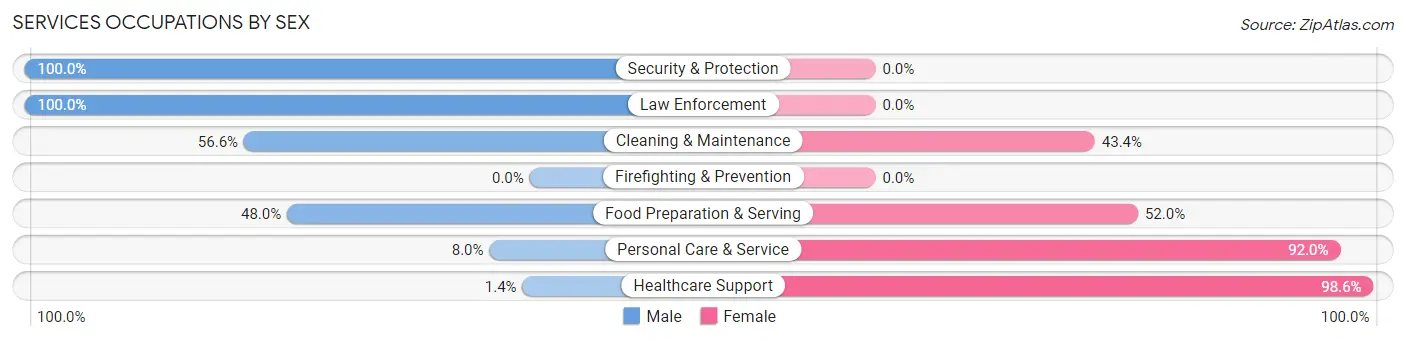
Services Occupations by Sex
Within the Services occupations in Pleasure Point, the most male-oriented occupations are Security & Protection (100.0%), Law Enforcement (100.0%), and Cleaning & Maintenance (56.6%), while the most female-oriented occupations are Healthcare Support (98.6%), Personal Care & Service (92.0%), and Food Preparation & Serving (52.0%).
| Occupation | Male | Female |
| Healthcare Support | 4 (1.4%) | 277 (98.6%) |
| Security & Protection | 16 (100.0%) | 0 (0.0%) |
| Firefighting & Prevention | 0 (0.0%) | 0 (0.0%) |
| Law Enforcement | 16 (100.0%) | 0 (0.0%) |
| Food Preparation & Serving | 73 (48.0%) | 79 (52.0%) |
| Cleaning & Maintenance | 56 (56.6%) | 43 (43.4%) |
| Personal Care & Service | 11 (8.0%) | 127 (92.0%) |
| Total (Category) | 160 (23.3%) | 526 (76.7%) |
| Total (Overall) | 1,730 (49.8%) | 1,743 (50.2%) |
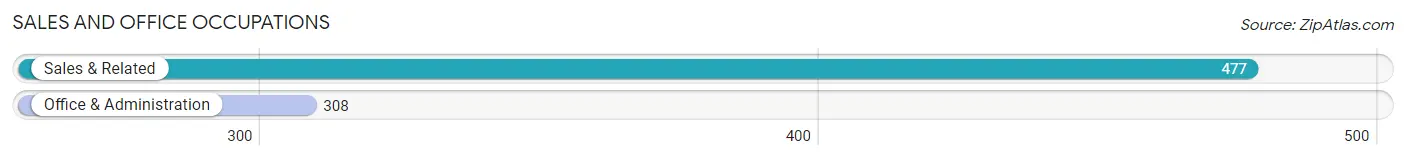
Sales and Office Occupations
The most common Sales and Office occupations in Pleasure Point are Sales & Related (477 | 13.7%), and Office & Administration (308 | 8.9%).
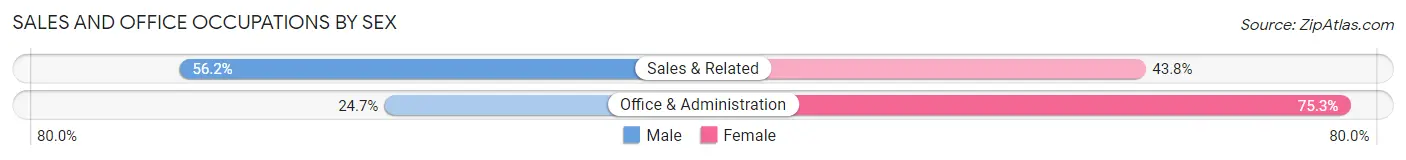
Sales and Office Occupations by Sex
| Occupation | Male | Female |
| Sales & Related | 268 (56.2%) | 209 (43.8%) |
| Office & Administration | 76 (24.7%) | 232 (75.3%) |
| Total (Category) | 344 (43.8%) | 441 (56.2%) |
| Total (Overall) | 1,730 (49.8%) | 1,743 (50.2%) |
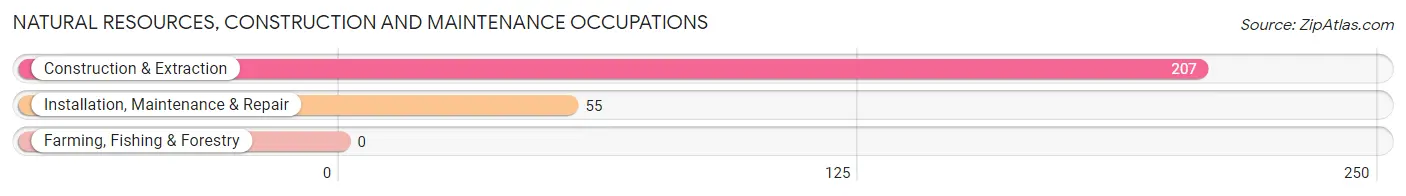
Natural Resources, Construction and Maintenance Occupations
The most common Natural Resources, Construction and Maintenance occupations in Pleasure Point are Construction & Extraction (207 | 6.0%), and Installation, Maintenance & Repair (55 | 1.6%).
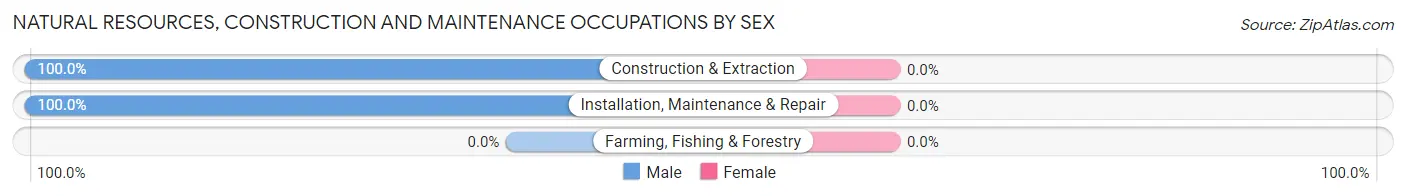
Natural Resources, Construction and Maintenance Occupations by Sex
| Occupation | Male | Female |
| Farming, Fishing & Forestry | 0 (0.0%) | 0 (0.0%) |
| Construction & Extraction | 207 (100.0%) | 0 (0.0%) |
| Installation, Maintenance & Repair | 55 (100.0%) | 0 (0.0%) |
| Total (Category) | 262 (100.0%) | 0 (0.0%) |
| Total (Overall) | 1,730 (49.8%) | 1,743 (50.2%) |
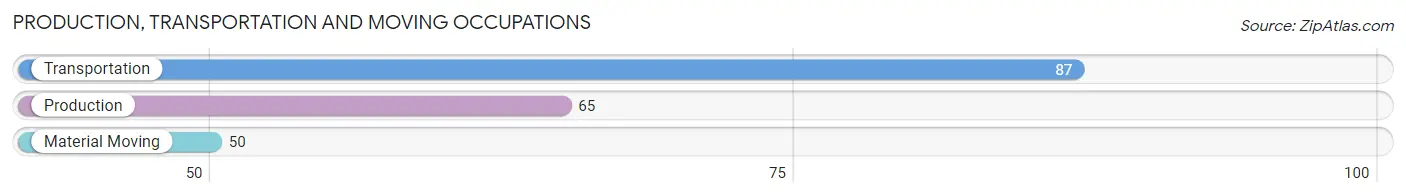
Production, Transportation and Moving Occupations
The most common Production, Transportation and Moving occupations in Pleasure Point are Transportation (87 | 2.5%), Production (65 | 1.9%), and Material Moving (50 | 1.4%).
Production, Transportation and Moving Occupations by Sex
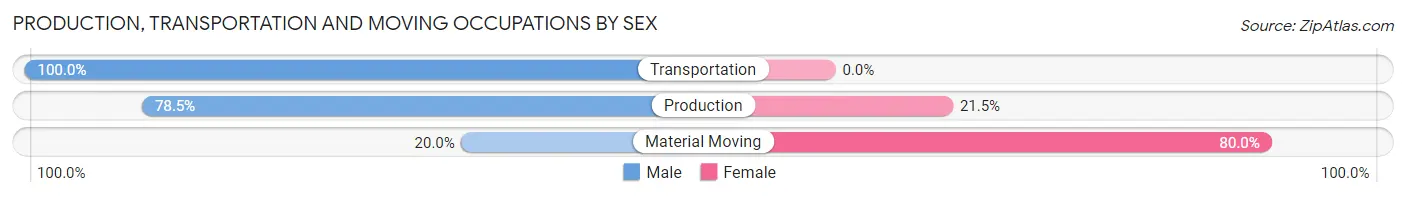
| Occupation | Male | Female |
| Production | 51 (78.5%) | 14 (21.5%) |
| Transportation | 87 (100.0%) | 0 (0.0%) |
| Material Moving | 10 (20.0%) | 40 (80.0%) |
| Total (Category) | 148 (73.3%) | 54 (26.7%) |
| Total (Overall) | 1,730 (49.8%) | 1,743 (50.2%) |
Employment Industries by Sex in Pleasure Point
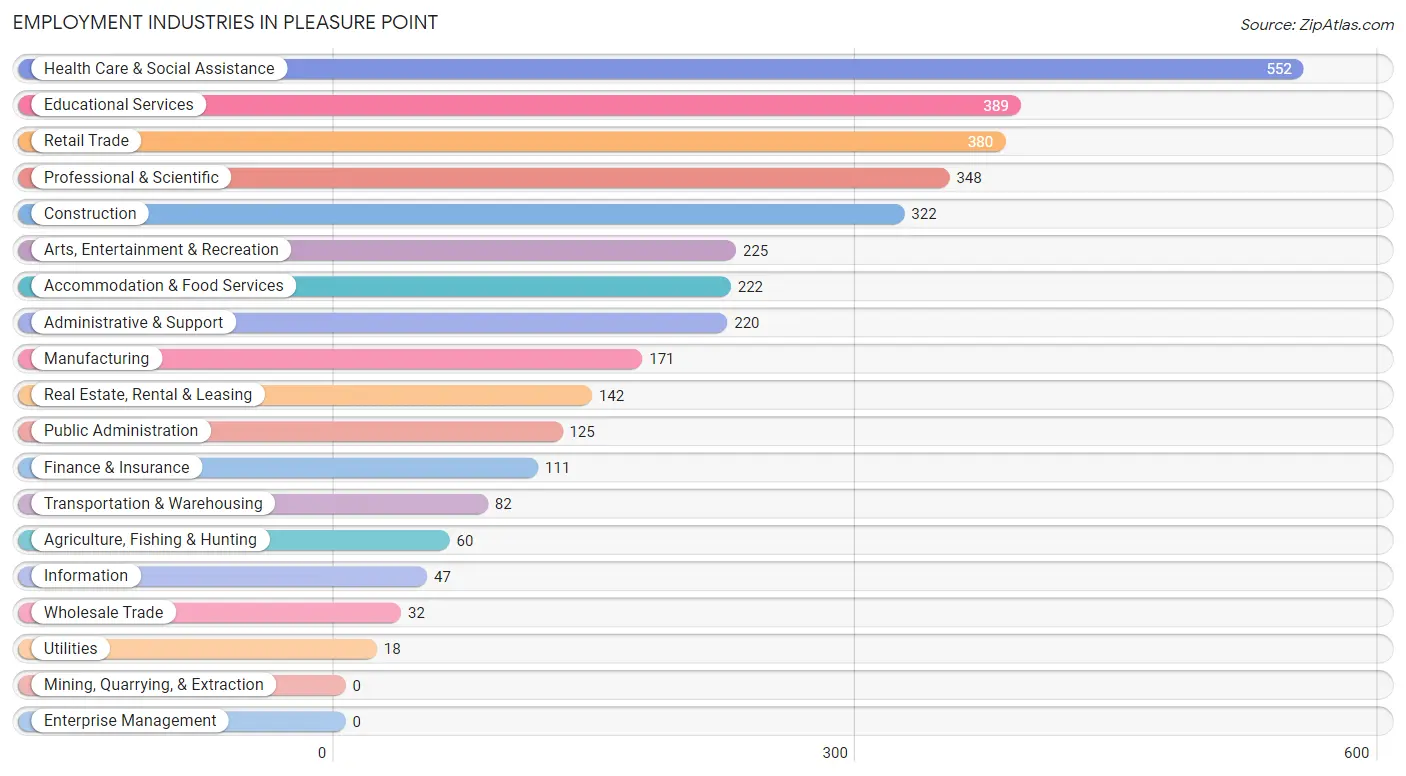
Employment Industries in Pleasure Point
The major employment industries in Pleasure Point include Health Care & Social Assistance (552 | 15.9%), Educational Services (389 | 11.2%), Retail Trade (380 | 10.9%), Professional & Scientific (348 | 10.0%), and Construction (322 | 9.3%).
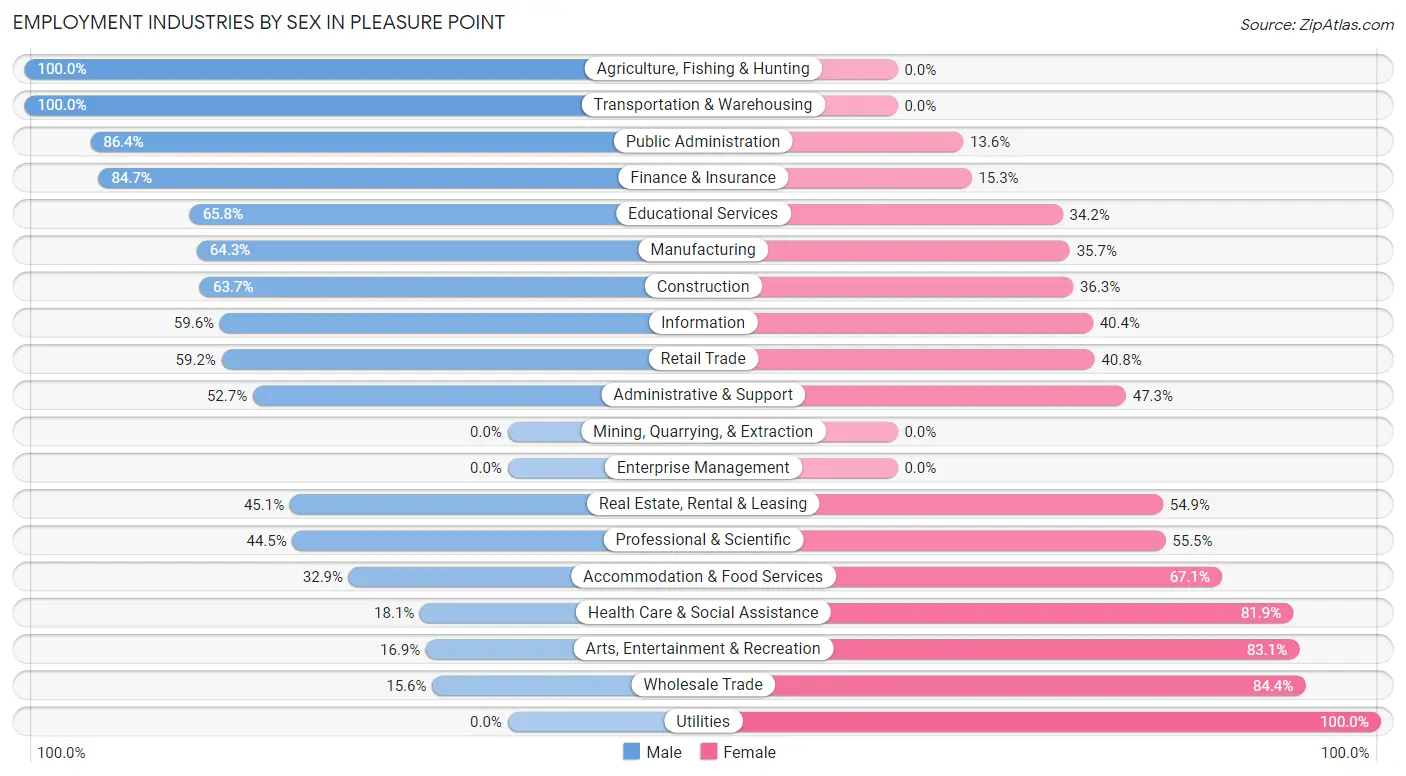
Employment Industries by Sex in Pleasure Point
The Pleasure Point industries that see more men than women are Agriculture, Fishing & Hunting (100.0%), Transportation & Warehousing (100.0%), and Public Administration (86.4%), whereas the industries that tend to have a higher number of women are Utilities (100.0%), Wholesale Trade (84.4%), and Arts, Entertainment & Recreation (83.1%).
| Industry | Male | Female |
| Agriculture, Fishing & Hunting | 60 (100.0%) | 0 (0.0%) |
| Mining, Quarrying, & Extraction | 0 (0.0%) | 0 (0.0%) |
| Construction | 205 (63.7%) | 117 (36.3%) |
| Manufacturing | 110 (64.3%) | 61 (35.7%) |
| Wholesale Trade | 5 (15.6%) | 27 (84.4%) |
| Retail Trade | 225 (59.2%) | 155 (40.8%) |
| Transportation & Warehousing | 82 (100.0%) | 0 (0.0%) |
| Utilities | 0 (0.0%) | 18 (100.0%) |
| Information | 28 (59.6%) | 19 (40.4%) |
| Finance & Insurance | 94 (84.7%) | 17 (15.3%) |
| Real Estate, Rental & Leasing | 64 (45.1%) | 78 (54.9%) |
| Professional & Scientific | 155 (44.5%) | 193 (55.5%) |
| Enterprise Management | 0 (0.0%) | 0 (0.0%) |
| Administrative & Support | 116 (52.7%) | 104 (47.3%) |
| Educational Services | 256 (65.8%) | 133 (34.2%) |
| Health Care & Social Assistance | 100 (18.1%) | 452 (81.9%) |
| Arts, Entertainment & Recreation | 38 (16.9%) | 187 (83.1%) |
| Accommodation & Food Services | 73 (32.9%) | 149 (67.1%) |
| Public Administration | 108 (86.4%) | 17 (13.6%) |
| Total | 1,730 (49.8%) | 1,743 (50.2%) |
Education in Pleasure Point
School Enrollment in Pleasure Point
The most common levels of schooling among the 1,074 students in Pleasure Point are high school (337 | 31.4%), graduate / professional (249 | 23.2%), and middle school (219 | 20.4%).
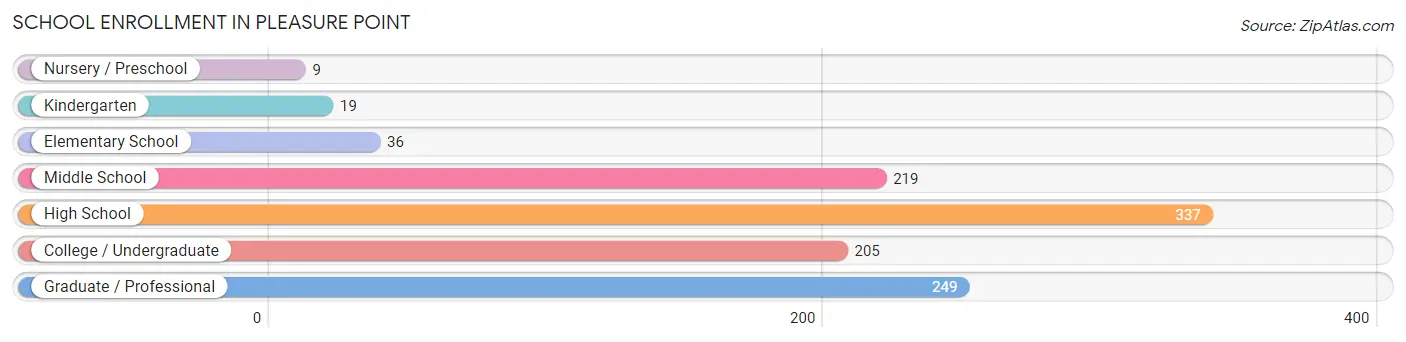
| School Level | # Students | % Students |
| Nursery / Preschool | 9 | 0.8% |
| Kindergarten | 19 | 1.8% |
| Elementary School | 36 | 3.4% |
| Middle School | 219 | 20.4% |
| High School | 337 | 31.4% |
| College / Undergraduate | 205 | 19.1% |
| Graduate / Professional | 249 | 23.2% |
| Total | 1,074 | 100.0% |
School Enrollment by Age by Funding Source in Pleasure Point
Out of a total of 1,074 students who are enrolled in schools in Pleasure Point, 301 (28.0%) attend a private institution, while the remaining 773 (72.0%) are enrolled in public schools. The age group of 35 years and over has the highest likelihood of being enrolled in private schools, with 203 (80.2% in the age bracket) enrolled. Conversely, the age group of 3 to 4 year olds has the lowest likelihood of being enrolled in a private school, with 9 (100.0% in the age bracket) attending a public institution.
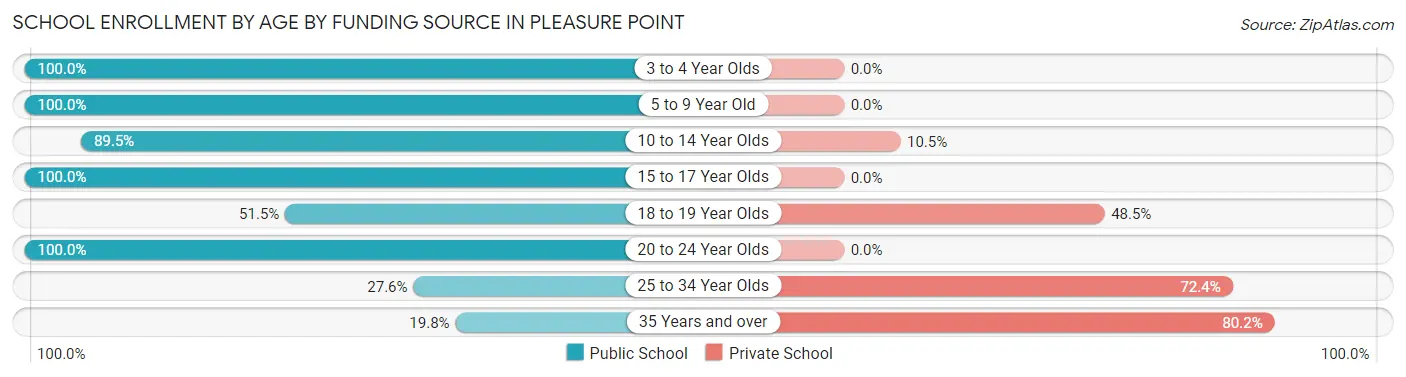
| Age Bracket | Public School | Private School |
| 3 to 4 Year Olds | 9 (100.0%) | 0 (0.0%) |
| 5 to 9 Year Old | 55 (100.0%) | 0 (0.0%) |
| 10 to 14 Year Olds | 196 (89.5%) | 23 (10.5%) |
| 15 to 17 Year Olds | 309 (100.0%) | 0 (0.0%) |
| 18 to 19 Year Olds | 35 (51.5%) | 33 (48.5%) |
| 20 to 24 Year Olds | 103 (100.0%) | 0 (0.0%) |
| 25 to 34 Year Olds | 16 (27.6%) | 42 (72.4%) |
| 35 Years and over | 50 (19.8%) | 203 (80.2%) |
| Total | 773 (72.0%) | 301 (28.0%) |
Educational Attainment by Field of Study in Pleasure Point
Social sciences (411 | 14.8%), visual & performing arts (354 | 12.8%), literature & languages (297 | 10.7%), science & technology (268 | 9.7%), and business (237 | 8.5%) are the most common fields of study among 2,776 individuals in Pleasure Point who have obtained a bachelor's degree or higher.
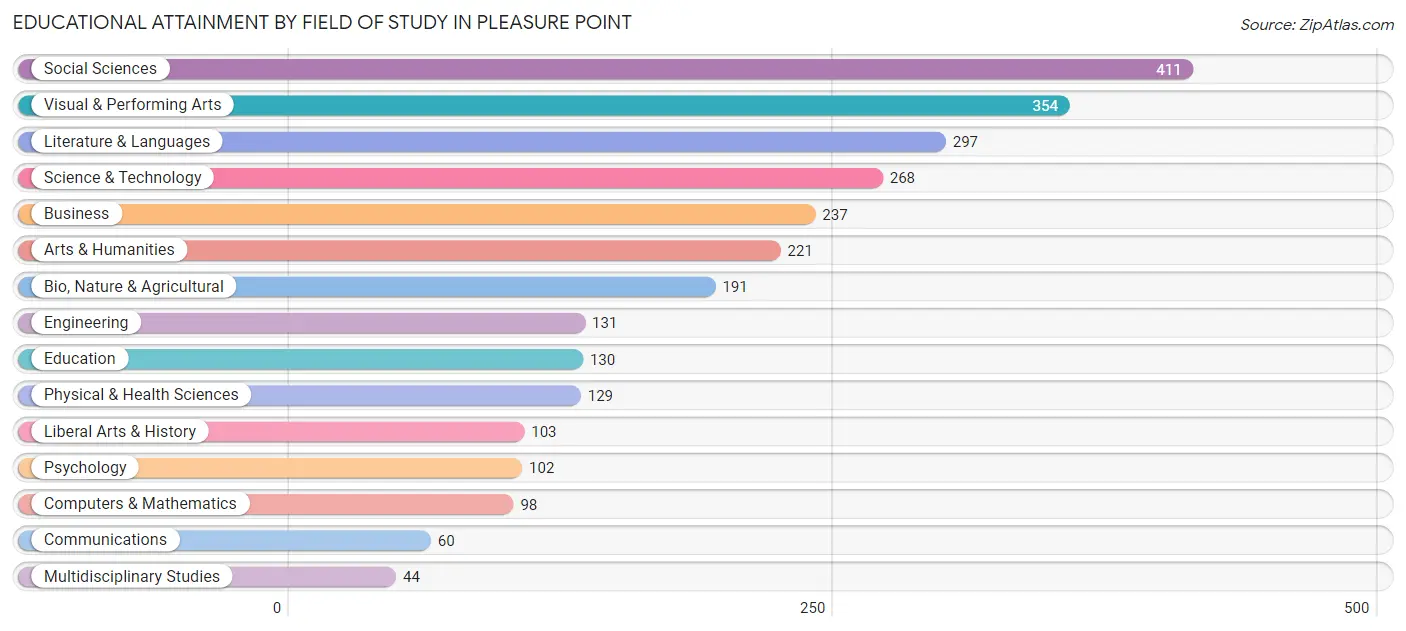
| Field of Study | # Graduates | % Graduates |
| Computers & Mathematics | 98 | 3.5% |
| Bio, Nature & Agricultural | 191 | 6.9% |
| Physical & Health Sciences | 129 | 4.6% |
| Psychology | 102 | 3.7% |
| Social Sciences | 411 | 14.8% |
| Engineering | 131 | 4.7% |
| Multidisciplinary Studies | 44 | 1.6% |
| Science & Technology | 268 | 9.7% |
| Business | 237 | 8.5% |
| Education | 130 | 4.7% |
| Literature & Languages | 297 | 10.7% |
| Liberal Arts & History | 103 | 3.7% |
| Visual & Performing Arts | 354 | 12.8% |
| Communications | 60 | 2.2% |
| Arts & Humanities | 221 | 8.0% |
| Total | 2,776 | 100.0% |
Transportation & Commute in Pleasure Point
Vehicle Availability by Sex in Pleasure Point
The most prevalent vehicle ownership categories in Pleasure Point are males with 2 vehicles (866, accounting for 51.9%) and females with 2 vehicles (712, making up 52.1%).
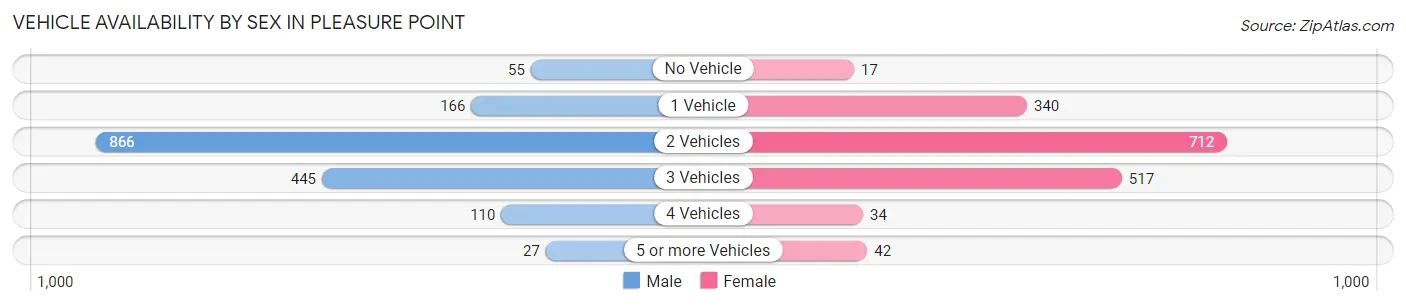
| Vehicles Available | Male | Female |
| No Vehicle | 55 (3.3%) | 17 (1.0%) |
| 1 Vehicle | 166 (10.0%) | 340 (20.5%) |
| 2 Vehicles | 866 (51.9%) | 712 (42.8%) |
| 3 Vehicles | 445 (26.7%) | 517 (31.1%) |
| 4 Vehicles | 110 (6.6%) | 34 (2.1%) |
| 5 or more Vehicles | 27 (1.6%) | 42 (2.5%) |
| Total | 1,669 (100.0%) | 1,662 (100.0%) |
Commute Time in Pleasure Point
The most frequently occuring commute durations in Pleasure Point are 5 to 9 minutes (556 commuters, 20.9%), 10 to 14 minutes (506 commuters, 19.0%), and 20 to 24 minutes (379 commuters, 14.2%).
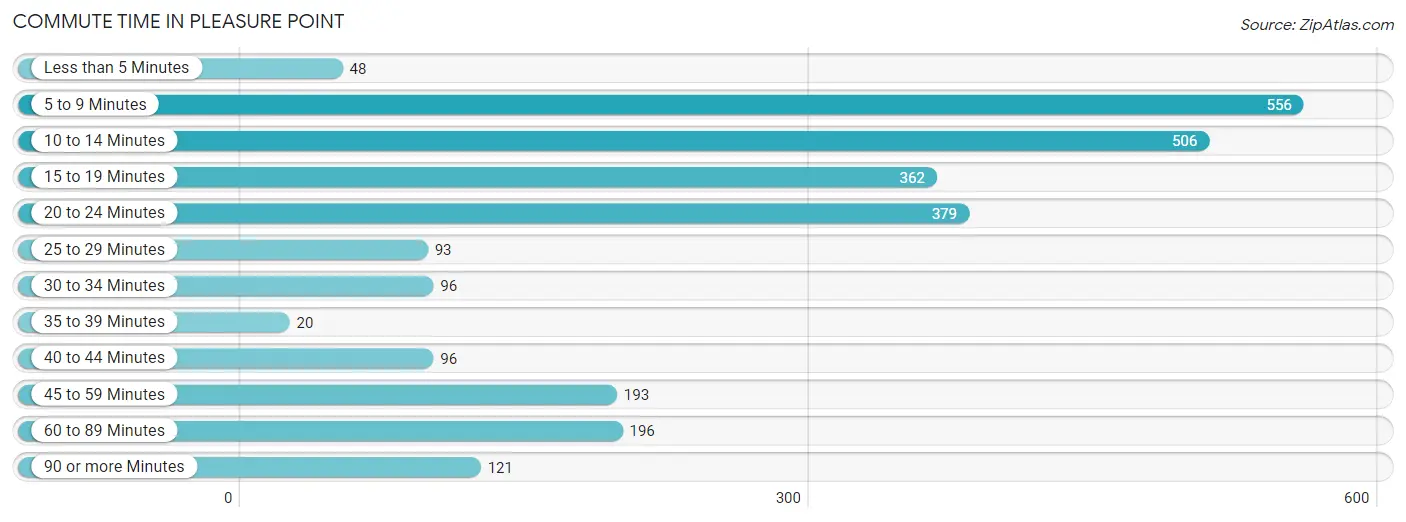
| Commute Time | # Commuters | % Commuters |
| Less than 5 Minutes | 48 | 1.8% |
| 5 to 9 Minutes | 556 | 20.9% |
| 10 to 14 Minutes | 506 | 19.0% |
| 15 to 19 Minutes | 362 | 13.6% |
| 20 to 24 Minutes | 379 | 14.2% |
| 25 to 29 Minutes | 93 | 3.5% |
| 30 to 34 Minutes | 96 | 3.6% |
| 35 to 39 Minutes | 20 | 0.7% |
| 40 to 44 Minutes | 96 | 3.6% |
| 45 to 59 Minutes | 193 | 7.2% |
| 60 to 89 Minutes | 196 | 7.3% |
| 90 or more Minutes | 121 | 4.5% |
Commute Time by Sex in Pleasure Point
The most common commute times in Pleasure Point are 10 to 14 minutes (332 commuters, 25.4%) for males and 5 to 9 minutes (465 commuters, 34.3%) for females.
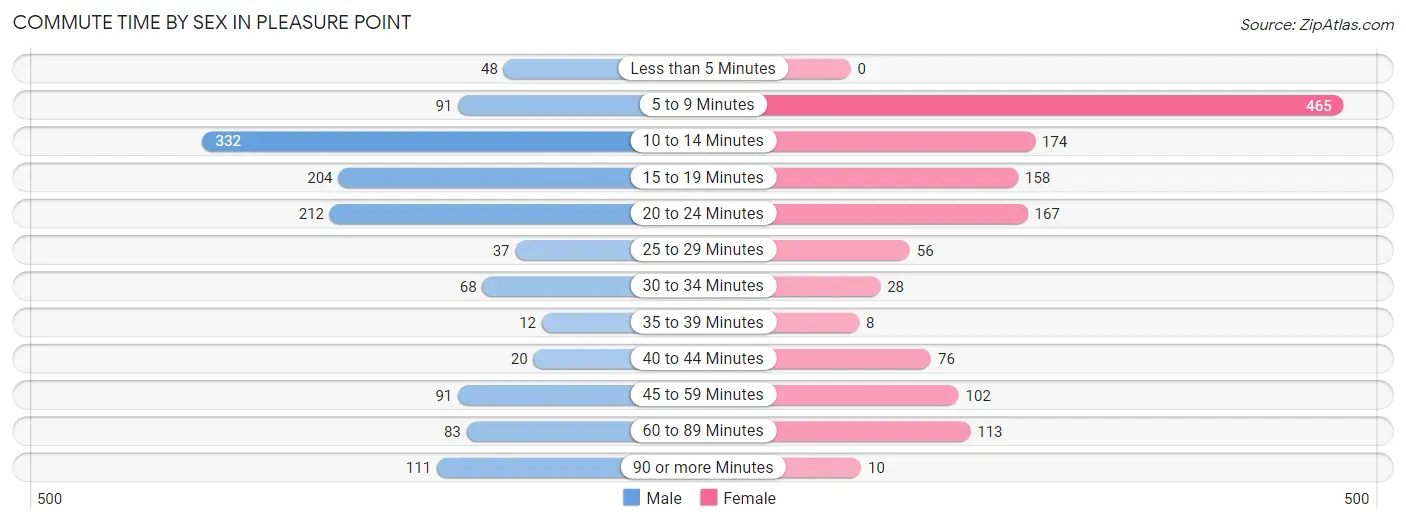
| Commute Time | Male | Female |
| Less than 5 Minutes | 48 (3.7%) | 0 (0.0%) |
| 5 to 9 Minutes | 91 (7.0%) | 465 (34.3%) |
| 10 to 14 Minutes | 332 (25.4%) | 174 (12.8%) |
| 15 to 19 Minutes | 204 (15.6%) | 158 (11.6%) |
| 20 to 24 Minutes | 212 (16.2%) | 167 (12.3%) |
| 25 to 29 Minutes | 37 (2.8%) | 56 (4.1%) |
| 30 to 34 Minutes | 68 (5.2%) | 28 (2.1%) |
| 35 to 39 Minutes | 12 (0.9%) | 8 (0.6%) |
| 40 to 44 Minutes | 20 (1.5%) | 76 (5.6%) |
| 45 to 59 Minutes | 91 (7.0%) | 102 (7.5%) |
| 60 to 89 Minutes | 83 (6.3%) | 113 (8.3%) |
| 90 or more Minutes | 111 (8.5%) | 10 (0.7%) |
Time of Departure to Work by Sex in Pleasure Point
The most frequent times of departure to work in Pleasure Point are 8:00 AM to 8:29 AM (242, 18.5%) for males and 8:00 AM to 8:29 AM (342, 25.2%) for females.
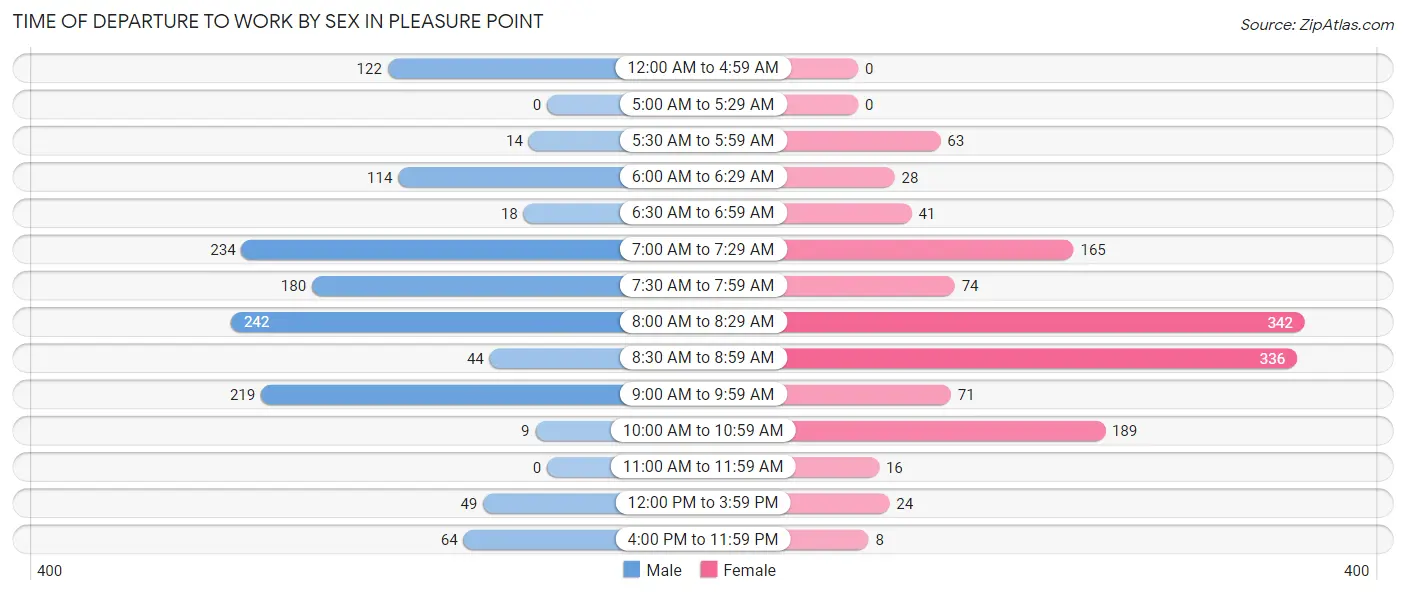
| Time of Departure | Male | Female |
| 12:00 AM to 4:59 AM | 122 (9.3%) | 0 (0.0%) |
| 5:00 AM to 5:29 AM | 0 (0.0%) | 0 (0.0%) |
| 5:30 AM to 5:59 AM | 14 (1.1%) | 63 (4.6%) |
| 6:00 AM to 6:29 AM | 114 (8.7%) | 28 (2.1%) |
| 6:30 AM to 6:59 AM | 18 (1.4%) | 41 (3.0%) |
| 7:00 AM to 7:29 AM | 234 (17.9%) | 165 (12.2%) |
| 7:30 AM to 7:59 AM | 180 (13.8%) | 74 (5.4%) |
| 8:00 AM to 8:29 AM | 242 (18.5%) | 342 (25.2%) |
| 8:30 AM to 8:59 AM | 44 (3.4%) | 336 (24.8%) |
| 9:00 AM to 9:59 AM | 219 (16.7%) | 71 (5.2%) |
| 10:00 AM to 10:59 AM | 9 (0.7%) | 189 (13.9%) |
| 11:00 AM to 11:59 AM | 0 (0.0%) | 16 (1.2%) |
| 12:00 PM to 3:59 PM | 49 (3.7%) | 24 (1.8%) |
| 4:00 PM to 11:59 PM | 64 (4.9%) | 8 (0.6%) |
| Total | 1,309 (100.0%) | 1,357 (100.0%) |
Housing Occupancy in Pleasure Point
Occupancy by Ownership in Pleasure Point
Of the total 2,671 dwellings in Pleasure Point, owner-occupied units account for 1,637 (61.3%), while renter-occupied units make up 1,034 (38.7%).
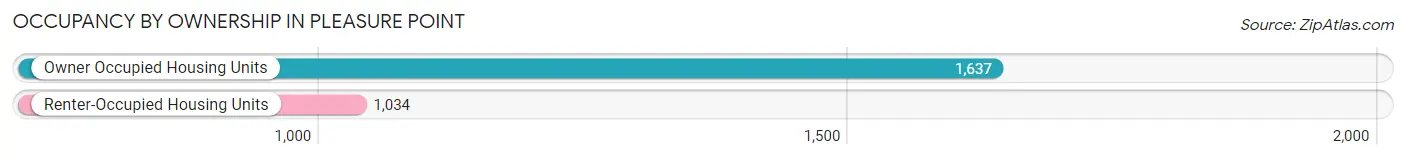
| Occupancy | # Housing Units | % Housing Units |
| Owner Occupied Housing Units | 1,637 | 61.3% |
| Renter-Occupied Housing Units | 1,034 | 38.7% |
| Total Occupied Housing Units | 2,671 | 100.0% |
Occupancy by Household Size in Pleasure Point
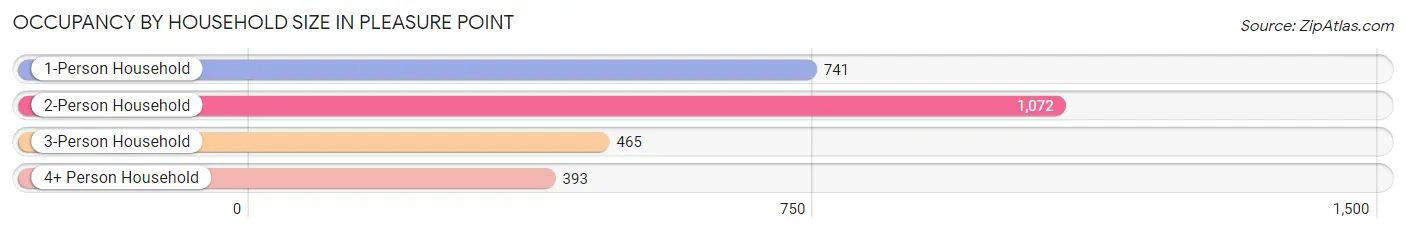
| Household Size | # Housing Units | % Housing Units |
| 1-Person Household | 741 | 27.7% |
| 2-Person Household | 1,072 | 40.1% |
| 3-Person Household | 465 | 17.4% |
| 4+ Person Household | 393 | 14.7% |
| Total Housing Units | 2,671 | 100.0% |
Occupancy by Ownership by Household Size in Pleasure Point
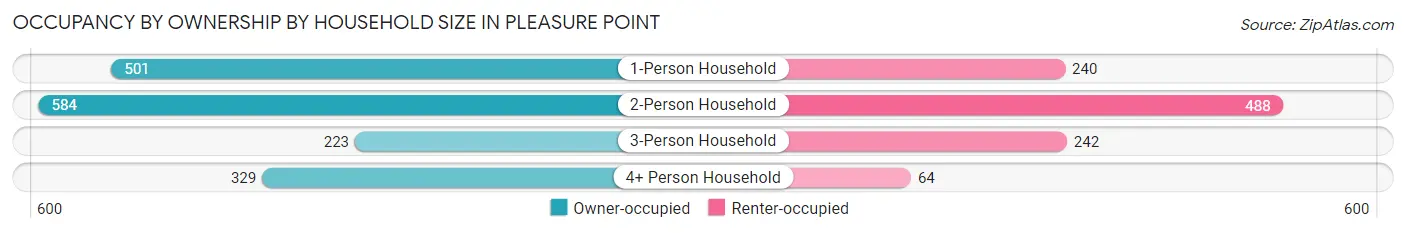
| Household Size | Owner-occupied | Renter-occupied |
| 1-Person Household | 501 (67.6%) | 240 (32.4%) |
| 2-Person Household | 584 (54.5%) | 488 (45.5%) |
| 3-Person Household | 223 (48.0%) | 242 (52.0%) |
| 4+ Person Household | 329 (83.7%) | 64 (16.3%) |
| Total Housing Units | 1,637 (61.3%) | 1,034 (38.7%) |
Occupancy by Educational Attainment in Pleasure Point
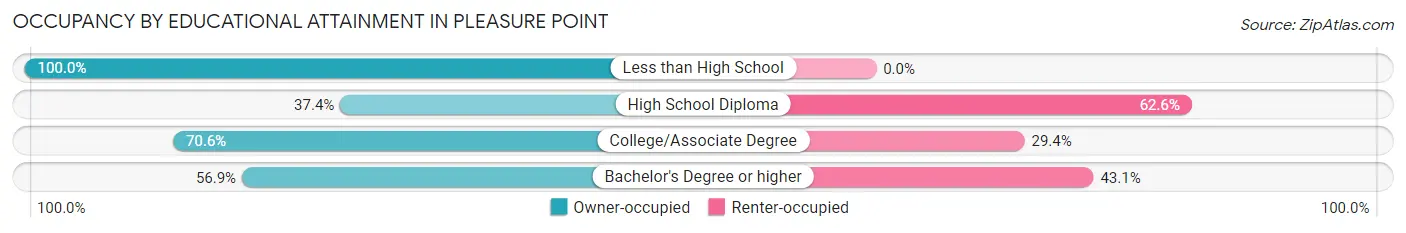
| Household Size | Owner-occupied | Renter-occupied |
| Less than High School | 110 (100.0%) | 0 (0.0%) |
| High School Diploma | 79 (37.4%) | 132 (62.6%) |
| College/Associate Degree | 571 (70.6%) | 238 (29.4%) |
| Bachelor's Degree or higher | 877 (56.9%) | 664 (43.1%) |
Occupancy by Age of Householder in Pleasure Point
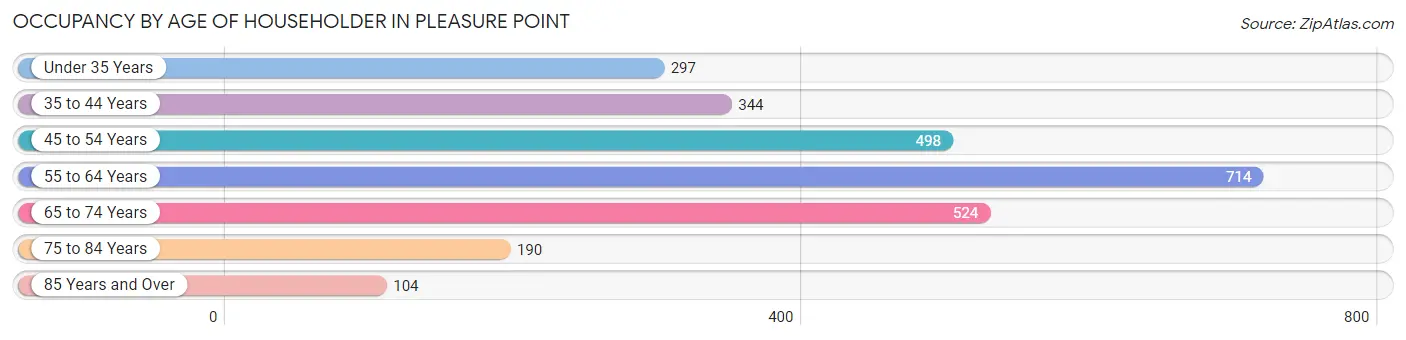
| Age Bracket | # Households | % Households |
| Under 35 Years | 297 | 11.1% |
| 35 to 44 Years | 344 | 12.9% |
| 45 to 54 Years | 498 | 18.6% |
| 55 to 64 Years | 714 | 26.7% |
| 65 to 74 Years | 524 | 19.6% |
| 75 to 84 Years | 190 | 7.1% |
| 85 Years and Over | 104 | 3.9% |
| Total | 2,671 | 100.0% |
Housing Finances in Pleasure Point
Median Income by Occupancy in Pleasure Point
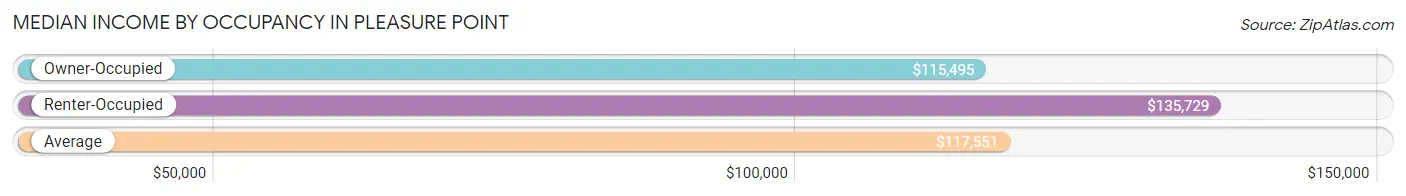
| Occupancy Type | # Households | Median Income |
| Owner-Occupied | 1,637 (61.3%) | $115,495 |
| Renter-Occupied | 1,034 (38.7%) | $135,729 |
| Average | 2,671 (100.0%) | $117,551 |
Occupancy by Householder Income Bracket in Pleasure Point
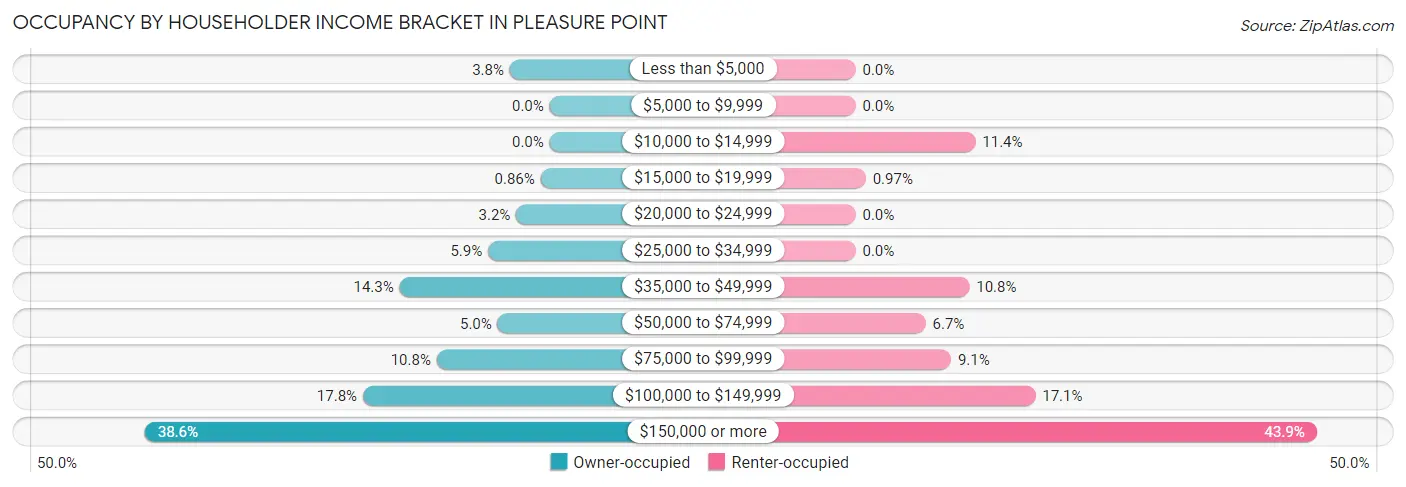
| Income Bracket | Owner-occupied | Renter-occupied |
| Less than $5,000 | 62 (3.8%) | 0 (0.0%) |
| $5,000 to $9,999 | 0 (0.0%) | 0 (0.0%) |
| $10,000 to $14,999 | 0 (0.0%) | 118 (11.4%) |
| $15,000 to $19,999 | 14 (0.9%) | 10 (1.0%) |
| $20,000 to $24,999 | 52 (3.2%) | 0 (0.0%) |
| $25,000 to $34,999 | 96 (5.9%) | 0 (0.0%) |
| $35,000 to $49,999 | 234 (14.3%) | 112 (10.8%) |
| $50,000 to $74,999 | 81 (5.0%) | 69 (6.7%) |
| $75,000 to $99,999 | 176 (10.7%) | 94 (9.1%) |
| $100,000 to $149,999 | 291 (17.8%) | 177 (17.1%) |
| $150,000 or more | 631 (38.6%) | 454 (43.9%) |
| Total | 1,637 (100.0%) | 1,034 (100.0%) |
Monthly Housing Cost Tiers in Pleasure Point
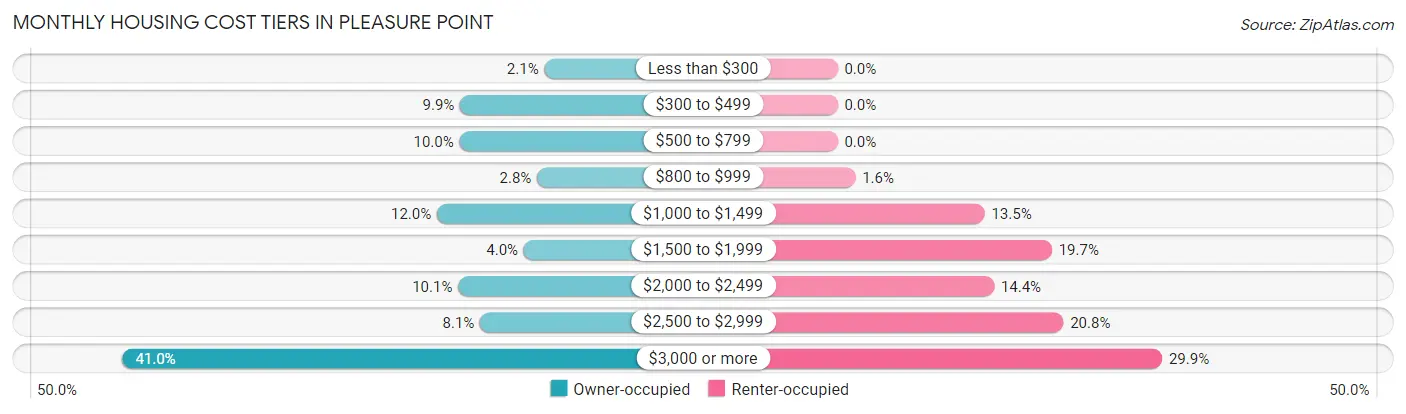
| Monthly Cost | Owner-occupied | Renter-occupied |
| Less than $300 | 35 (2.1%) | 0 (0.0%) |
| $300 to $499 | 162 (9.9%) | 0 (0.0%) |
| $500 to $799 | 163 (10.0%) | 0 (0.0%) |
| $800 to $999 | 46 (2.8%) | 17 (1.6%) |
| $1,000 to $1,499 | 197 (12.0%) | 140 (13.5%) |
| $1,500 to $1,999 | 66 (4.0%) | 204 (19.7%) |
| $2,000 to $2,499 | 165 (10.1%) | 149 (14.4%) |
| $2,500 to $2,999 | 132 (8.1%) | 215 (20.8%) |
| $3,000 or more | 671 (41.0%) | 309 (29.9%) |
| Total | 1,637 (100.0%) | 1,034 (100.0%) |
Physical Housing Characteristics in Pleasure Point
Housing Structures in Pleasure Point
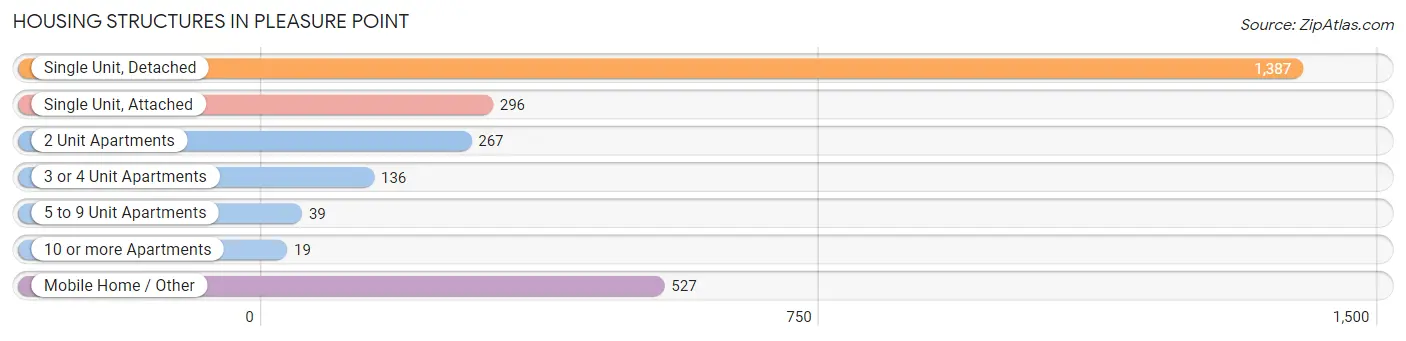
| Structure Type | # Housing Units | % Housing Units |
| Single Unit, Detached | 1,387 | 51.9% |
| Single Unit, Attached | 296 | 11.1% |
| 2 Unit Apartments | 267 | 10.0% |
| 3 or 4 Unit Apartments | 136 | 5.1% |
| 5 to 9 Unit Apartments | 39 | 1.5% |
| 10 or more Apartments | 19 | 0.7% |
| Mobile Home / Other | 527 | 19.7% |
| Total | 2,671 | 100.0% |
Housing Structures by Occupancy in Pleasure Point
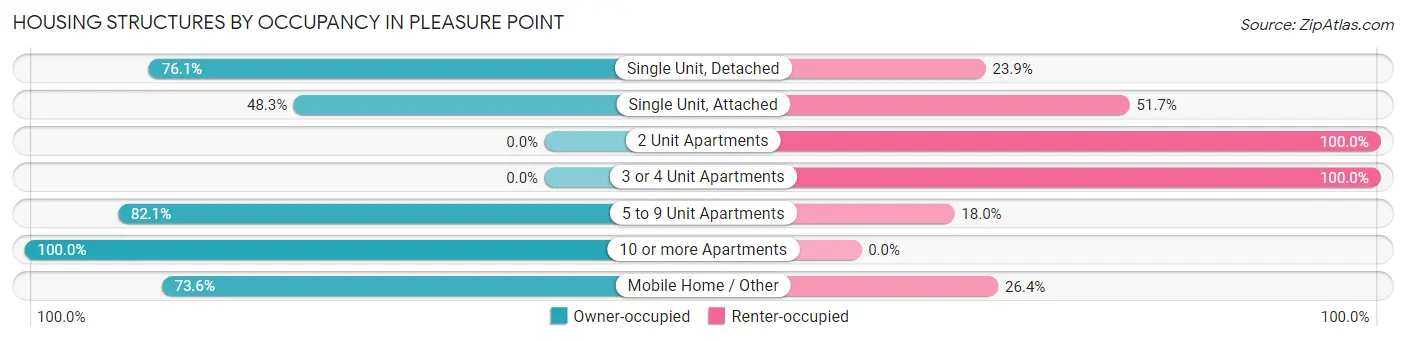
| Structure Type | Owner-occupied | Renter-occupied |
| Single Unit, Detached | 1,055 (76.1%) | 332 (23.9%) |
| Single Unit, Attached | 143 (48.3%) | 153 (51.7%) |
| 2 Unit Apartments | 0 (0.0%) | 267 (100.0%) |
| 3 or 4 Unit Apartments | 0 (0.0%) | 136 (100.0%) |
| 5 to 9 Unit Apartments | 32 (82.1%) | 7 (17.9%) |
| 10 or more Apartments | 19 (100.0%) | 0 (0.0%) |
| Mobile Home / Other | 388 (73.6%) | 139 (26.4%) |
| Total | 1,637 (61.3%) | 1,034 (38.7%) |
Housing Structures by Number of Rooms in Pleasure Point
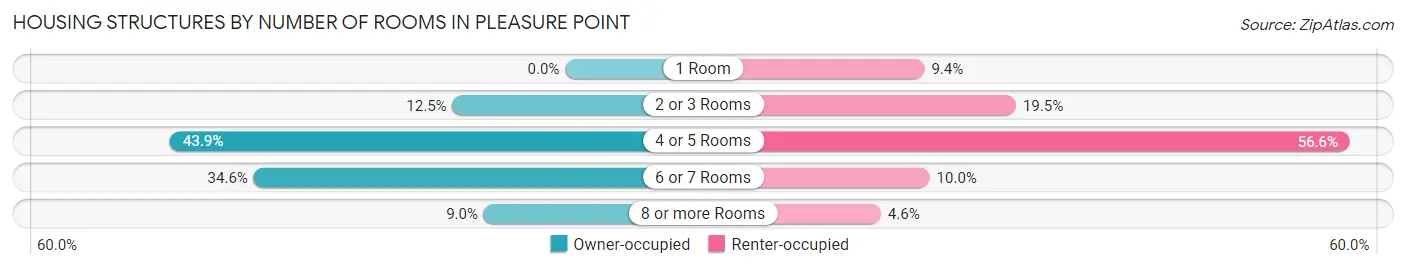
| Number of Rooms | Owner-occupied | Renter-occupied |
| 1 Room | 0 (0.0%) | 97 (9.4%) |
| 2 or 3 Rooms | 205 (12.5%) | 202 (19.5%) |
| 4 or 5 Rooms | 718 (43.9%) | 585 (56.6%) |
| 6 or 7 Rooms | 566 (34.6%) | 103 (10.0%) |
| 8 or more Rooms | 148 (9.0%) | 47 (4.5%) |
| Total | 1,637 (100.0%) | 1,034 (100.0%) |
Housing Structure by Heating Type in Pleasure Point
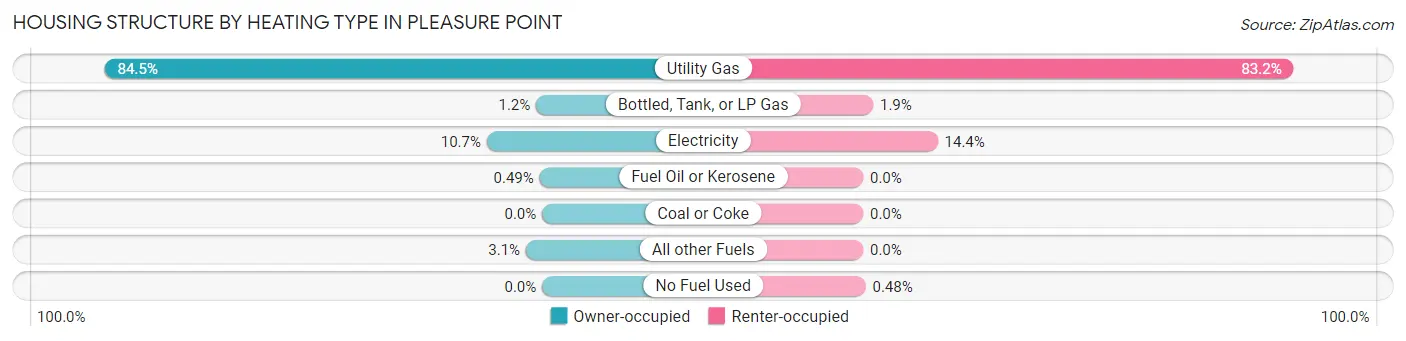
| Heating Type | Owner-occupied | Renter-occupied |
| Utility Gas | 1,384 (84.5%) | 860 (83.2%) |
| Bottled, Tank, or LP Gas | 19 (1.2%) | 20 (1.9%) |
| Electricity | 175 (10.7%) | 149 (14.4%) |
| Fuel Oil or Kerosene | 8 (0.5%) | 0 (0.0%) |
| Coal or Coke | 0 (0.0%) | 0 (0.0%) |
| All other Fuels | 51 (3.1%) | 0 (0.0%) |
| No Fuel Used | 0 (0.0%) | 5 (0.5%) |
| Total | 1,637 (100.0%) | 1,034 (100.0%) |
Household Vehicle Usage in Pleasure Point
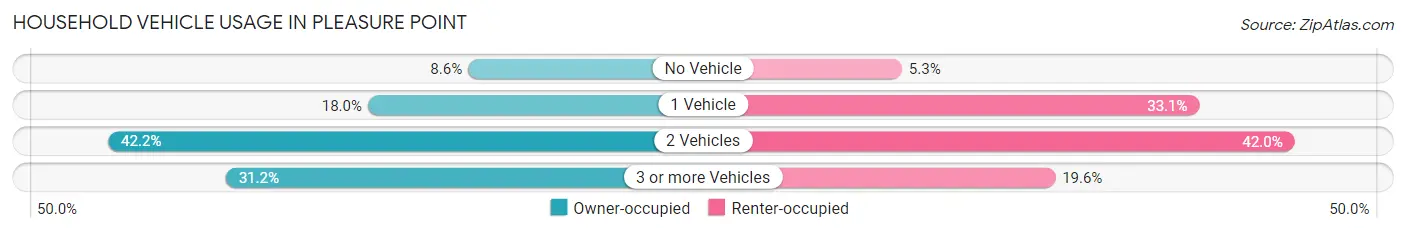
| Vehicles per Household | Owner-occupied | Renter-occupied |
| No Vehicle | 141 (8.6%) | 55 (5.3%) |
| 1 Vehicle | 294 (18.0%) | 342 (33.1%) |
| 2 Vehicles | 691 (42.2%) | 434 (42.0%) |
| 3 or more Vehicles | 511 (31.2%) | 203 (19.6%) |
| Total | 1,637 (100.0%) | 1,034 (100.0%) |
Real Estate & Mortgages in Pleasure Point
Real Estate and Mortgage Overview in Pleasure Point
| Characteristic | Without Mortgage | With Mortgage |
| Housing Units | 496 | 1,141 |
| Median Property Value | $363,500 | $1,362,400 |
| Median Household Income | - | - |
| Monthly Housing Costs | $671 | $628 |
| Real Estate Taxes | $1,250 | $82 |
Property Value by Mortgage Status in Pleasure Point
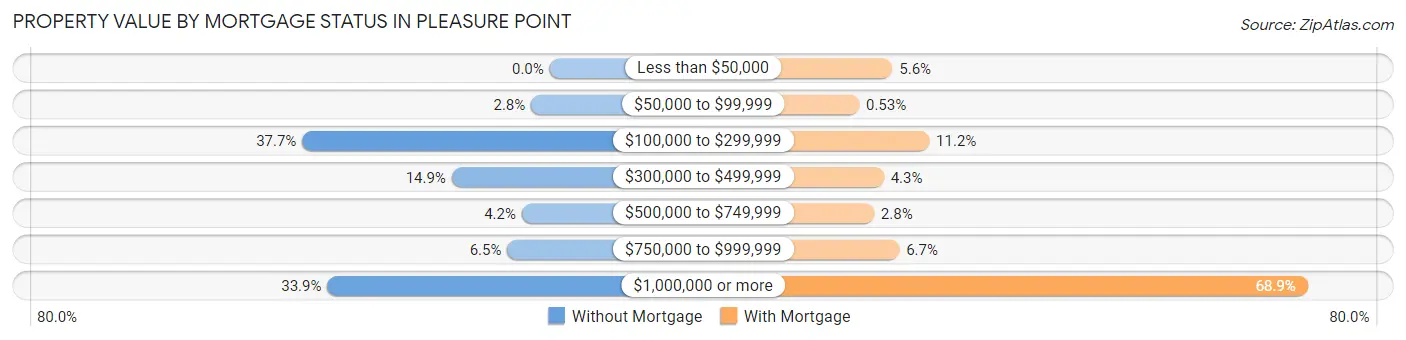
| Property Value | Without Mortgage | With Mortgage |
| Less than $50,000 | 0 (0.0%) | 64 (5.6%) |
| $50,000 to $99,999 | 14 (2.8%) | 6 (0.5%) |
| $100,000 to $299,999 | 187 (37.7%) | 128 (11.2%) |
| $300,000 to $499,999 | 74 (14.9%) | 49 (4.3%) |
| $500,000 to $749,999 | 21 (4.2%) | 32 (2.8%) |
| $750,000 to $999,999 | 32 (6.5%) | 76 (6.7%) |
| $1,000,000 or more | 168 (33.9%) | 786 (68.9%) |
| Total | 496 (100.0%) | 1,141 (100.0%) |
Household Income by Mortgage Status in Pleasure Point
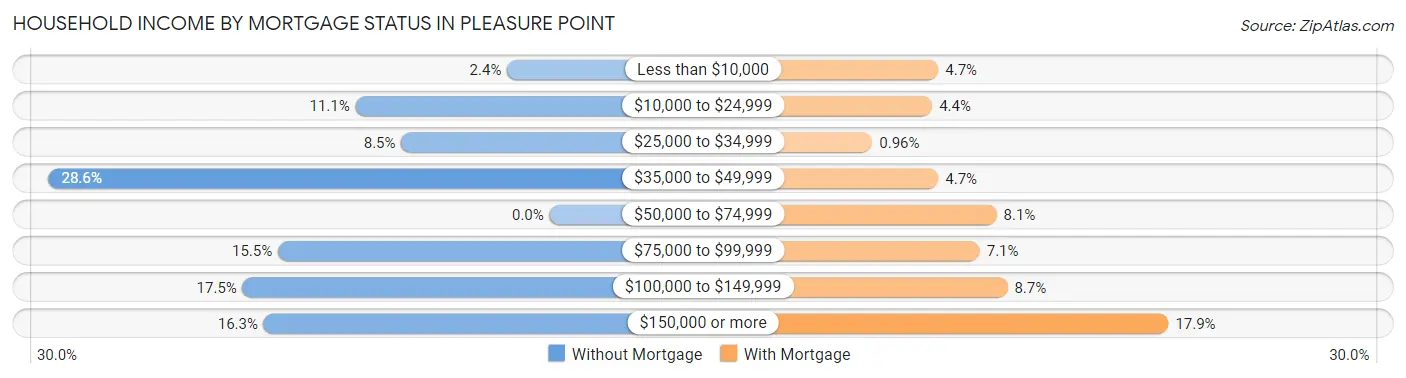
| Household Income | Without Mortgage | With Mortgage |
| Less than $10,000 | 12 (2.4%) | 54 (4.7%) |
| $10,000 to $24,999 | 55 (11.1%) | 50 (4.4%) |
| $25,000 to $34,999 | 42 (8.5%) | 11 (1.0%) |
| $35,000 to $49,999 | 142 (28.6%) | 54 (4.7%) |
| $50,000 to $74,999 | 0 (0.0%) | 92 (8.1%) |
| $75,000 to $99,999 | 77 (15.5%) | 81 (7.1%) |
| $100,000 to $149,999 | 87 (17.5%) | 99 (8.7%) |
| $150,000 or more | 81 (16.3%) | 204 (17.9%) |
| Total | 496 (100.0%) | 1,141 (100.0%) |
Property Value to Household Income Ratio in Pleasure Point
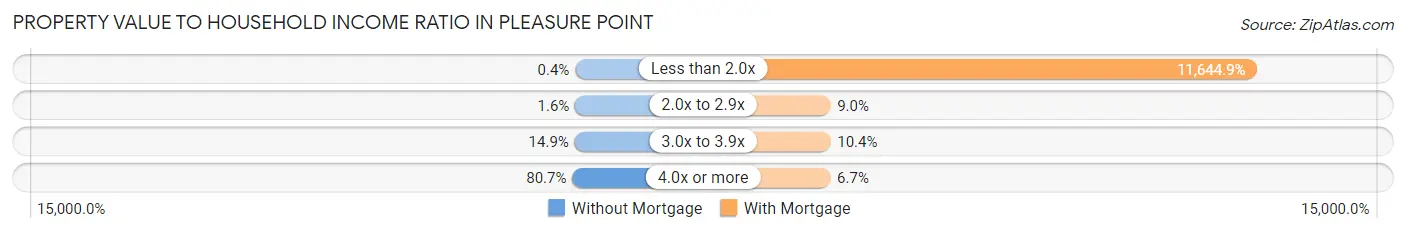
| Value-to-Income Ratio | Without Mortgage | With Mortgage |
| Less than 2.0x | 2 (0.4%) | 132,868 (11,644.9%) |
| 2.0x to 2.9x | 8 (1.6%) | 103 (9.0%) |
| 3.0x to 3.9x | 74 (14.9%) | 119 (10.4%) |
| 4.0x or more | 400 (80.6%) | 76 (6.7%) |
| Total | 496 (100.0%) | 1,141 (100.0%) |
Real Estate Taxes by Mortgage Status in Pleasure Point
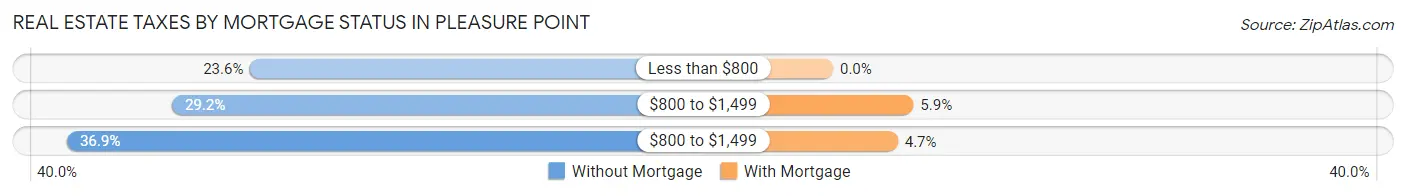
| Property Taxes | Without Mortgage | With Mortgage |
| Less than $800 | 117 (23.6%) | 0 (0.0%) |
| $800 to $1,499 | 145 (29.2%) | 67 (5.9%) |
| $800 to $1,499 | 183 (36.9%) | 54 (4.7%) |
| Total | 496 (100.0%) | 1,141 (100.0%) |
Health & Disability in Pleasure Point
Health Insurance Coverage by Age in Pleasure Point
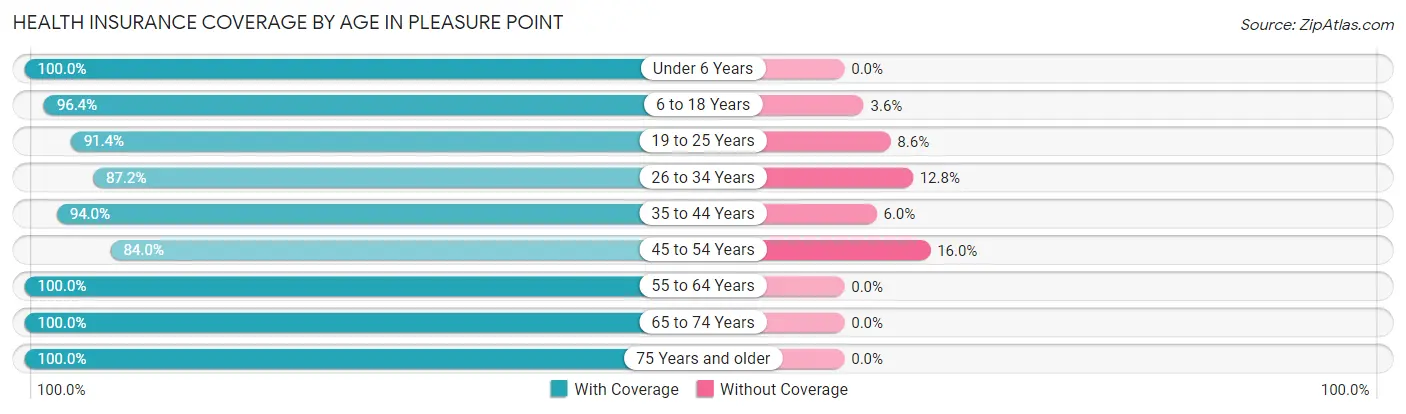
| Age Bracket | With Coverage | Without Coverage |
| Under 6 Years | 213 (100.0%) | 0 (0.0%) |
| 6 to 18 Years | 589 (96.4%) | 22 (3.6%) |
| 19 to 25 Years | 319 (91.4%) | 30 (8.6%) |
| 26 to 34 Years | 506 (87.2%) | 74 (12.8%) |
| 35 to 44 Years | 797 (94.0%) | 51 (6.0%) |
| 45 to 54 Years | 760 (84.0%) | 145 (16.0%) |
| 55 to 64 Years | 1,184 (100.0%) | 0 (0.0%) |
| 65 to 74 Years | 799 (100.0%) | 0 (0.0%) |
| 75 Years and older | 420 (100.0%) | 0 (0.0%) |
| Total | 5,587 (94.6%) | 322 (5.4%) |
Health Insurance Coverage by Citizenship Status in Pleasure Point
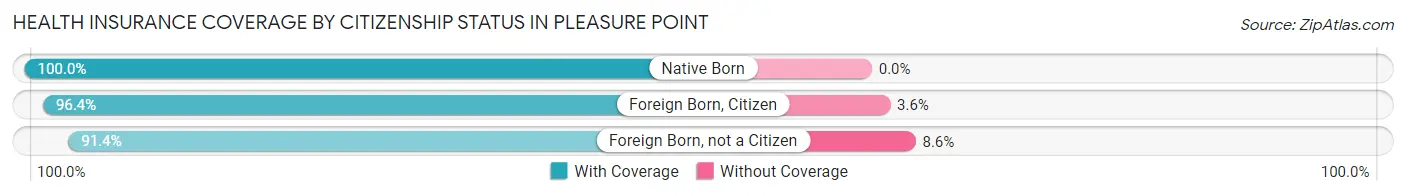
| Citizenship Status | With Coverage | Without Coverage |
| Native Born | 213 (100.0%) | 0 (0.0%) |
| Foreign Born, Citizen | 589 (96.4%) | 22 (3.6%) |
| Foreign Born, not a Citizen | 319 (91.4%) | 30 (8.6%) |
Health Insurance Coverage by Household Income in Pleasure Point
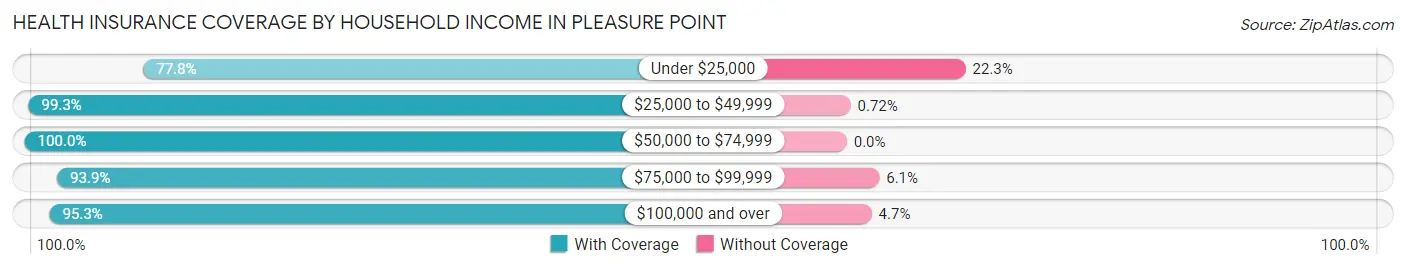
| Household Income | With Coverage | Without Coverage |
| Under $25,000 | 339 (77.7%) | 97 (22.3%) |
| $25,000 to $49,999 | 685 (99.3%) | 5 (0.7%) |
| $50,000 to $74,999 | 252 (100.0%) | 0 (0.0%) |
| $75,000 to $99,999 | 586 (93.9%) | 38 (6.1%) |
| $100,000 and over | 3,725 (95.3%) | 182 (4.7%) |
Public vs Private Health Insurance Coverage by Age in Pleasure Point
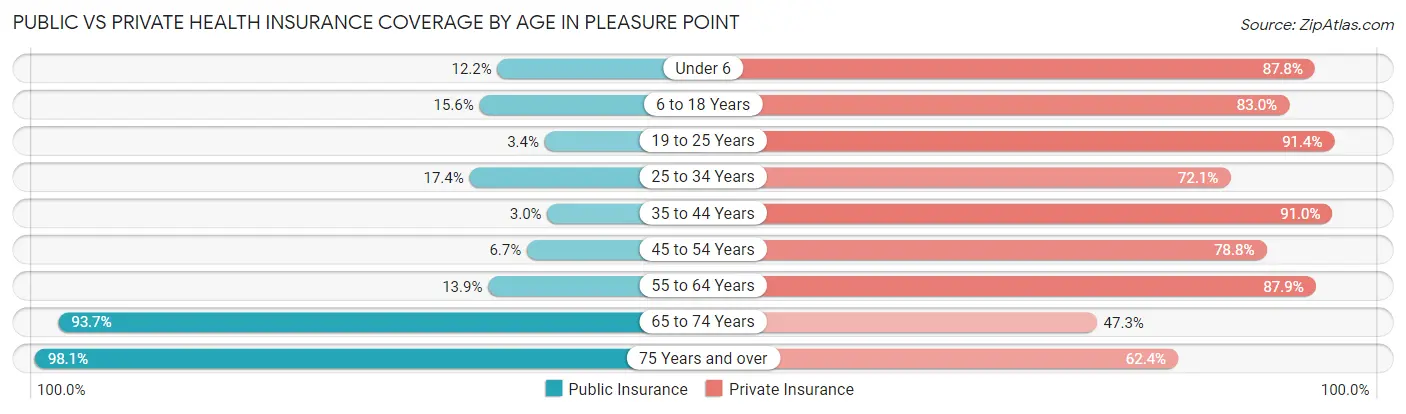
| Age Bracket | Public Insurance | Private Insurance |
| Under 6 | 26 (12.2%) | 187 (87.8%) |
| 6 to 18 Years | 95 (15.5%) | 507 (83.0%) |
| 19 to 25 Years | 12 (3.4%) | 319 (91.4%) |
| 25 to 34 Years | 101 (17.4%) | 418 (72.1%) |
| 35 to 44 Years | 25 (2.9%) | 772 (91.0%) |
| 45 to 54 Years | 61 (6.7%) | 713 (78.8%) |
| 55 to 64 Years | 165 (13.9%) | 1,041 (87.9%) |
| 65 to 74 Years | 749 (93.7%) | 378 (47.3%) |
| 75 Years and over | 412 (98.1%) | 262 (62.4%) |
| Total | 1,646 (27.9%) | 4,597 (77.8%) |
Disability Status by Sex by Age in Pleasure Point
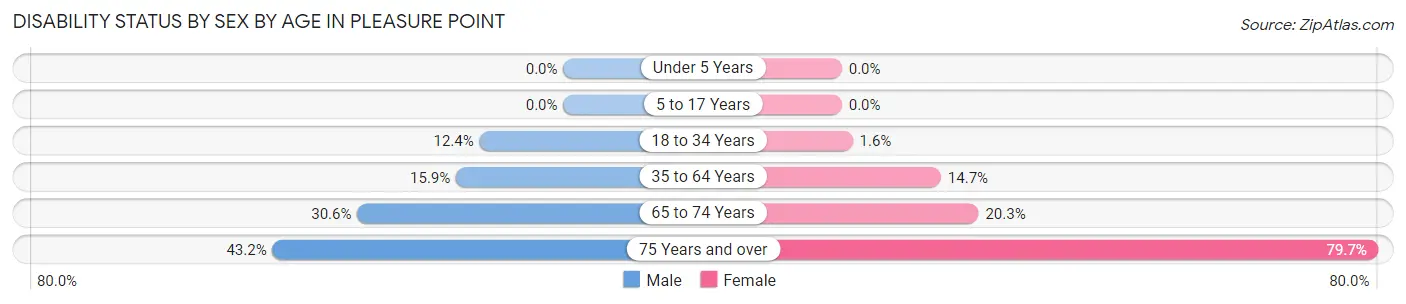
| Age Bracket | Male | Female |
| Under 5 Years | 0 (0.0%) | 0 (0.0%) |
| 5 to 17 Years | 0 (0.0%) | 0 (0.0%) |
| 18 to 34 Years | 49 (12.4%) | 9 (1.6%) |
| 35 to 64 Years | 234 (15.9%) | 216 (14.7%) |
| 65 to 74 Years | 142 (30.6%) | 68 (20.3%) |
| 75 Years and over | 92 (43.2%) | 165 (79.7%) |
Disability Class by Sex by Age in Pleasure Point
Disability Class: Hearing Difficulty
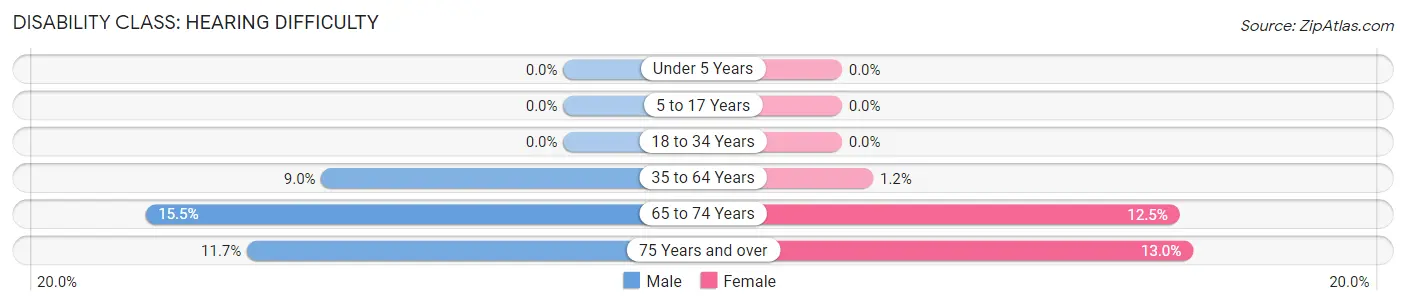
| Age Bracket | Male | Female |
| Under 5 Years | 0 (0.0%) | 0 (0.0%) |
| 5 to 17 Years | 0 (0.0%) | 0 (0.0%) |
| 18 to 34 Years | 0 (0.0%) | 0 (0.0%) |
| 35 to 64 Years | 132 (9.0%) | 17 (1.2%) |
| 65 to 74 Years | 72 (15.5%) | 42 (12.5%) |
| 75 Years and over | 25 (11.7%) | 27 (13.0%) |
Disability Class: Vision Difficulty
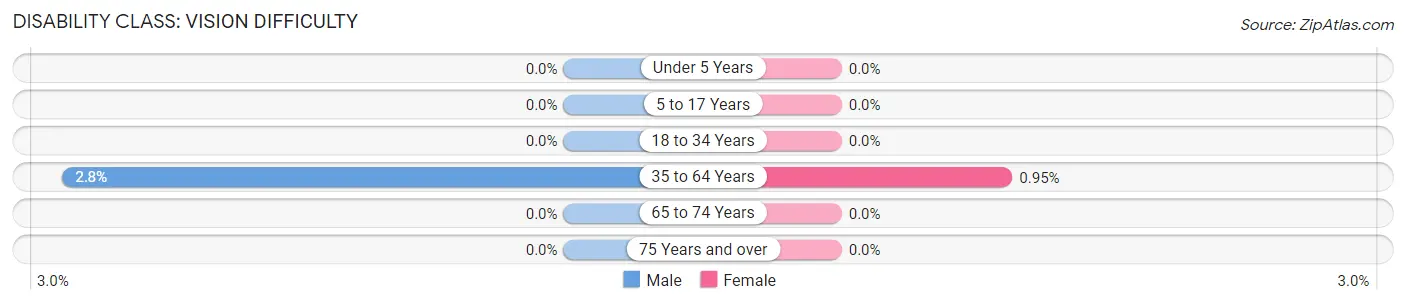
| Age Bracket | Male | Female |
| Under 5 Years | 0 (0.0%) | 0 (0.0%) |
| 5 to 17 Years | 0 (0.0%) | 0 (0.0%) |
| 18 to 34 Years | 0 (0.0%) | 0 (0.0%) |
| 35 to 64 Years | 41 (2.8%) | 14 (0.9%) |
| 65 to 74 Years | 0 (0.0%) | 0 (0.0%) |
| 75 Years and over | 0 (0.0%) | 0 (0.0%) |
Disability Class: Cognitive Difficulty
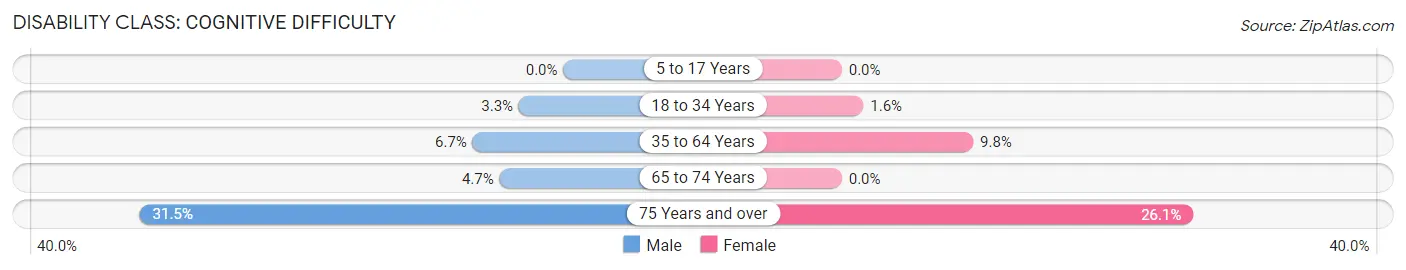
| Age Bracket | Male | Female |
| 5 to 17 Years | 0 (0.0%) | 0 (0.0%) |
| 18 to 34 Years | 13 (3.3%) | 9 (1.6%) |
| 35 to 64 Years | 99 (6.7%) | 143 (9.8%) |
| 65 to 74 Years | 22 (4.7%) | 0 (0.0%) |
| 75 Years and over | 67 (31.5%) | 54 (26.1%) |
Disability Class: Ambulatory Difficulty
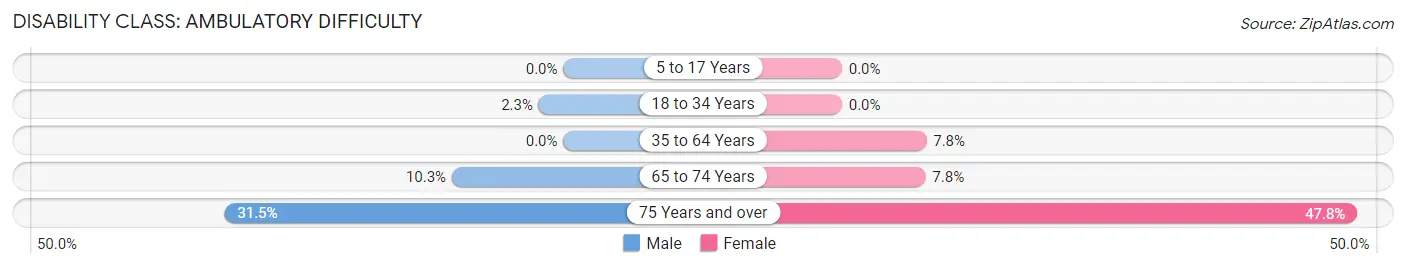
| Age Bracket | Male | Female |
| 5 to 17 Years | 0 (0.0%) | 0 (0.0%) |
| 18 to 34 Years | 9 (2.3%) | 0 (0.0%) |
| 35 to 64 Years | 0 (0.0%) | 115 (7.8%) |
| 65 to 74 Years | 48 (10.3%) | 26 (7.8%) |
| 75 Years and over | 67 (31.5%) | 99 (47.8%) |
Disability Class: Self-Care Difficulty
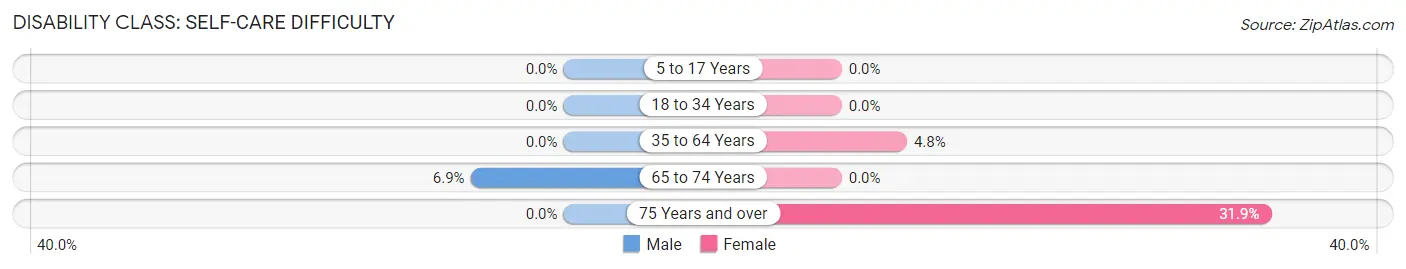
| Age Bracket | Male | Female |
| 5 to 17 Years | 0 (0.0%) | 0 (0.0%) |
| 18 to 34 Years | 0 (0.0%) | 0 (0.0%) |
| 35 to 64 Years | 0 (0.0%) | 71 (4.8%) |
| 65 to 74 Years | 32 (6.9%) | 0 (0.0%) |
| 75 Years and over | 0 (0.0%) | 66 (31.9%) |
Technology Access in Pleasure Point
Computing Device Access in Pleasure Point
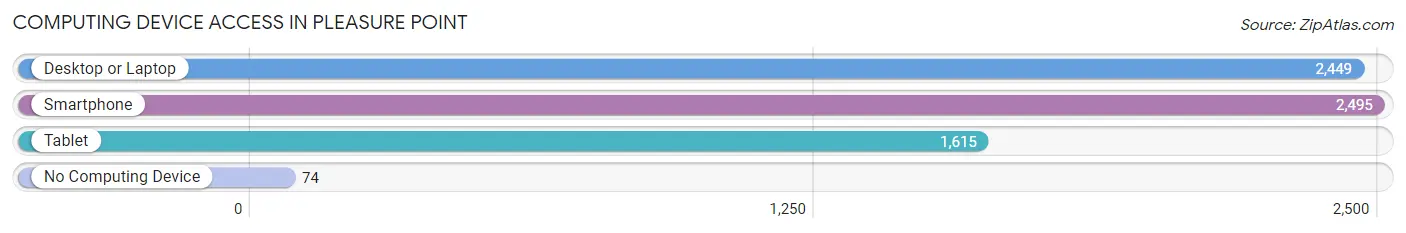
| Device Type | # Households | % Households |
| Desktop or Laptop | 2,449 | 91.7% |
| Smartphone | 2,495 | 93.4% |
| Tablet | 1,615 | 60.5% |
| No Computing Device | 74 | 2.8% |
| Total | 2,671 | 100.0% |
Internet Access in Pleasure Point
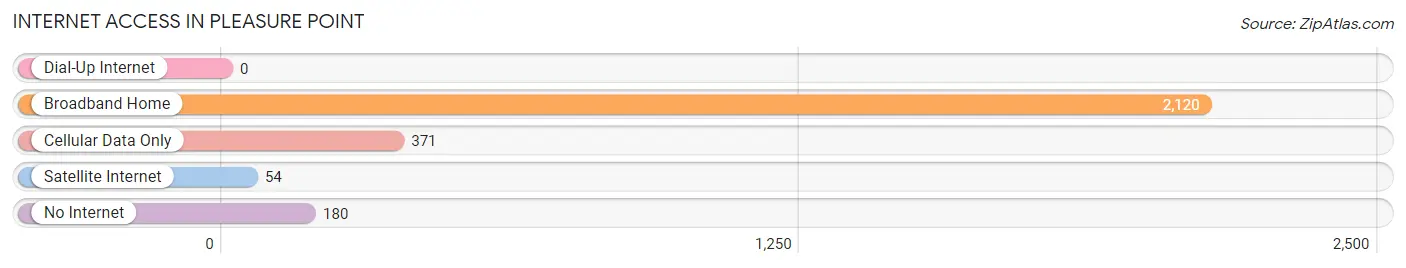
| Internet Type | # Households | % Households |
| Dial-Up Internet | 0 | 0.0% |
| Broadband Home | 2,120 | 79.4% |
| Cellular Data Only | 371 | 13.9% |
| Satellite Internet | 54 | 2.0% |
| No Internet | 180 | 6.7% |
| Total | 2,671 | 100.0% |
Pleasure Point Summary
Pleasure Point is a small beach community located in Santa Cruz County, California. It is situated on the Monterey Bay, just south of the city of Santa Cruz. The area is known for its surfing, fishing, and other outdoor activities. It is also home to a variety of restaurants, shops, and other businesses.
Geography
Pleasure Point is located on the Monterey Bay, just south of the city of Santa Cruz. The area is bordered by the San Lorenzo River to the north, the Santa Cruz Mountains to the east, and the Pacific Ocean to the west. The area is characterized by its sandy beaches, rocky cliffs, and rolling hills. The climate is mild, with temperatures ranging from the mid-50s to the mid-70s throughout the year.
Economy
Pleasure Point is primarily a residential community, with a few small businesses located in the area. The primary industries in the area are tourism, fishing, and retail. The area is home to a variety of restaurants, shops, and other businesses catering to tourists and locals alike. The area is also home to a number of surf shops, which cater to the local surfing community.
Demographics
As of the 2010 census, the population of Pleasure Point was 2,845. The racial makeup of the area was 79.3% White, 0.7% African American, 0.3% Native American, 8.2% Asian, 0.2% Pacific Islander, 8.2% from other races, and 3.2% from two or more races. The median household income in the area was $68,945, and the median family income was $77,945.
History
Pleasure Point was originally inhabited by the Ohlone people, who lived in the area for thousands of years before the arrival of Europeans. The area was first explored by Spanish settlers in the late 1700s, and the area was later settled by American settlers in the mid-1800s. The area was originally known as “Pleasure Point” due to its scenic beauty and abundance of recreational activities. The area was officially incorporated as a town in 1891.
In the early 1900s, the area became a popular destination for tourists and surfers. The area was home to a number of surf shops, restaurants, and other businesses catering to the growing number of visitors. The area was also home to a number of fishing boats, which provided a livelihood for many of the local residents.
In the late 20th century, the area experienced a period of rapid growth and development. The area was home to a number of new businesses, including restaurants, shops, and other businesses catering to the growing number of visitors. The area also experienced a surge in residential development, with a number of new homes being built in the area.
Today, Pleasure Point is a popular destination for tourists and locals alike. The area is home to a variety of restaurants, shops, and other businesses catering to the local community. The area is also home to a number of surf shops, which cater to the local surfing community. The area is also home to a number of fishing boats, which provide a livelihood for many of the local residents.
Common Questions
What is Per Capita Income in Pleasure Point?
Per Capita income in Pleasure Point is $68,752.
What is the Median Family Income in Pleasure Point?
Median Family Income in Pleasure Point is $137,378.
What is the Median Household income in Pleasure Point?
Median Household Income in Pleasure Point is $117,551.
What is Income or Wage Gap in Pleasure Point?
Income or Wage Gap in Pleasure Point is 33.3%.
Women in Pleasure Point earn 66.7 cents for every dollar earned by a man.
What is Inequality or Gini Index in Pleasure Point?
Inequality or Gini Index in Pleasure Point is 0.45.
What is the Total Population of Pleasure Point?
Total Population of Pleasure Point is 5,909.
What is the Total Male Population of Pleasure Point?
Total Male Population of Pleasure Point is 2,772.
What is the Total Female Population of Pleasure Point?
Total Female Population of Pleasure Point is 3,137.
What is the Ratio of Males per 100 Females in Pleasure Point?
There are 88.36 Males per 100 Females in Pleasure Point.
What is the Ratio of Females per 100 Males in Pleasure Point?
There are 113.17 Females per 100 Males in Pleasure Point.
What is the Median Population Age in Pleasure Point?
Median Population Age in Pleasure Point is 47.0 Years.
What is the Average Family Size in Pleasure Point
Average Family Size in Pleasure Point is 2.7 People.
What is the Average Household Size in Pleasure Point
Average Household Size in Pleasure Point is 2.2 People.
How Large is the Labor Force in Pleasure Point?
There are 3,582 People in the Labor Forcein in Pleasure Point.
What is the Percentage of People in the Labor Force in Pleasure Point?
67.8% of People are in the Labor Force in Pleasure Point.
What is the Unemployment Rate in Pleasure Point?
Unemployment Rate in Pleasure Point is 3.0%.