Cities with the Highest Percentage of Population with a Degree in Visual and Performing Arts in West Virginia
RELATED REPORTS & OPTIONS
Visual and Performing Arts
West Virginia
Compare Cities
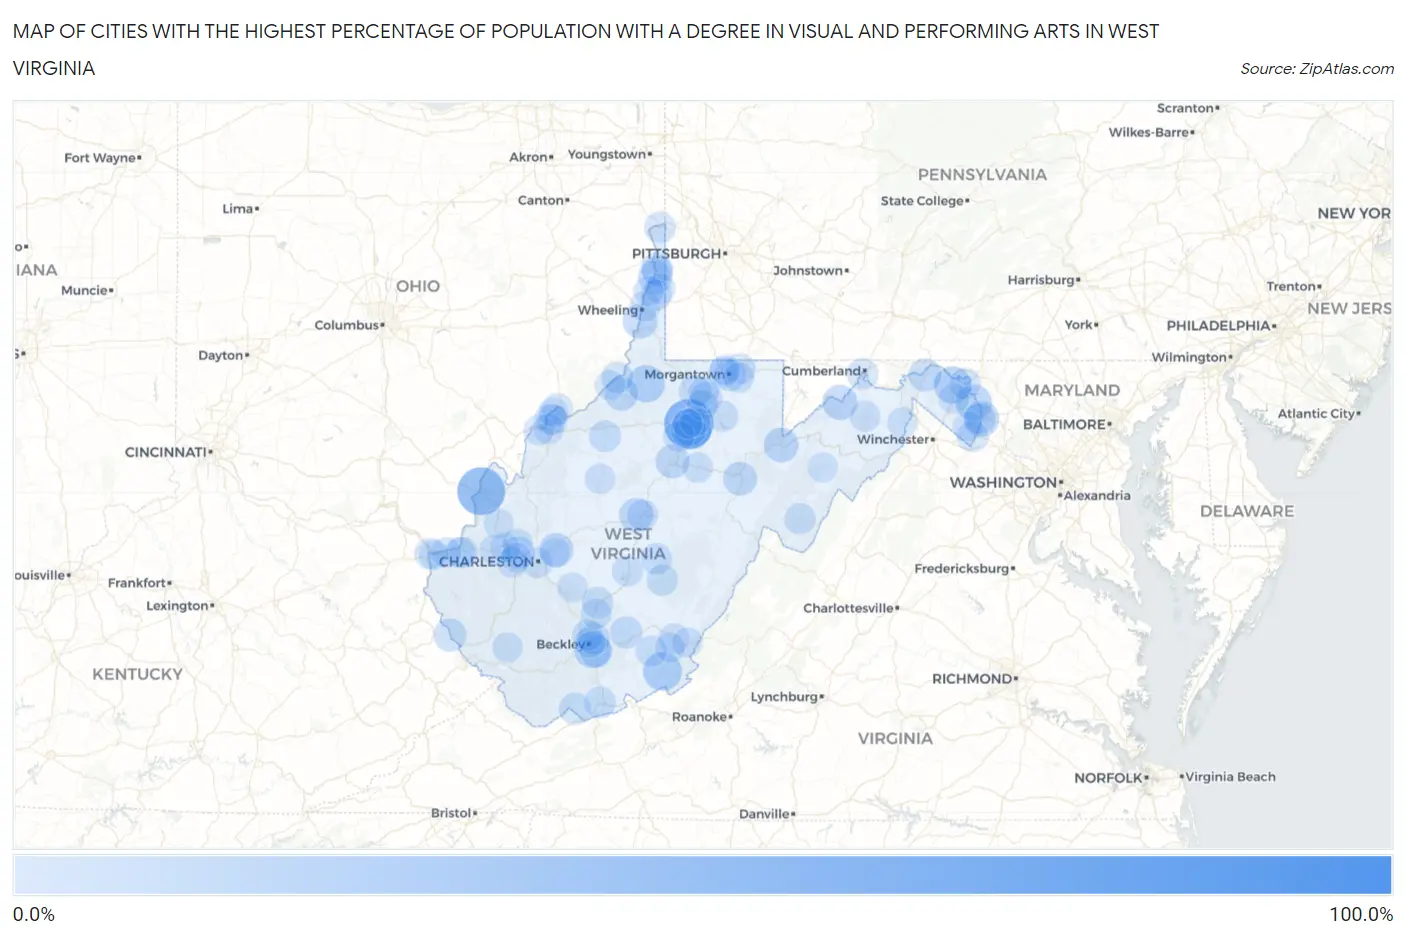
Map of Cities with the Highest Percentage of Population with a Degree in Visual and Performing Arts in West Virginia
0.0%
100.0%
Cities with the Highest Percentage of Population with a Degree in Visual and Performing Arts in West Virginia
| City | % Graduates | vs State | vs National | |
| 1. | East View | 100.0% | 2.9%(+97.1)#1 | 4.3%(+95.7)#6 |
| 2. | Despard | 54.5% | 2.9%(+51.6)#2 | 4.3%(+50.3)#96 |
| 3. | Henderson | 50.0% | 2.9%(+47.1)#3 | 4.3%(+45.7)#113 |
| 4. | Anmoore | 30.8% | 2.9%(+27.9)#4 | 4.3%(+26.5)#299 |
| 5. | Union | 25.0% | 2.9%(+22.1)#5 | 4.3%(+20.7)#421 |
| 6. | West Dunbar | 24.2% | 2.9%(+21.3)#6 | 4.3%(+20.0)#458 |
| 7. | Malden | 21.5% | 2.9%(+18.6)#7 | 4.3%(+17.3)#549 |
| 8. | Pine Grove | 20.8% | 2.9%(+17.9)#8 | 4.3%(+16.6)#582 |
| 9. | Hedgesville | 20.7% | 2.9%(+17.8)#9 | 4.3%(+16.4)#590 |
| 10. | Beaver | 19.0% | 2.9%(+16.1)#10 | 4.3%(+14.7)#713 |
| 11. | Shepherdstown | 17.7% | 2.9%(+14.8)#11 | 4.3%(+13.4)#800 |
| 12. | Harpers Ferry | 17.3% | 2.9%(+14.4)#12 | 4.3%(+13.0)#830 |
| 13. | Keyser | 15.3% | 2.9%(+12.4)#13 | 4.3%(+11.1)#1,033 |
| 14. | Thomas | 14.4% | 2.9%(+11.5)#14 | 4.3%(+10.1)#1,133 |
| 15. | Mcmechen | 13.7% | 2.9%(+10.8)#15 | 4.3%(+9.46)#1,237 |
| 16. | Elkview | 12.9% | 2.9%(+10.00)#16 | 4.3%(+8.65)#1,357 |
| 17. | Gassaway | 12.2% | 2.9%(+9.31)#17 | 4.3%(+7.96)#1,478 |
| 18. | Middlebourne | 11.8% | 2.9%(+8.86)#18 | 4.3%(+7.51)#1,573 |
| 19. | Wellsburg | 11.7% | 2.9%(+8.81)#19 | 4.3%(+7.46)#1,585 |
| 20. | Weston | 11.7% | 2.9%(+8.76)#20 | 4.3%(+7.41)#1,594 |
| 21. | Elkins | 11.6% | 2.9%(+8.73)#21 | 4.3%(+7.39)#1,596 |
| 22. | Bath Berkeley Springs | 9.9% | 2.9%(+7.03)#22 | 4.3%(+5.68)#2,094 |
| 23. | Kermit | 9.5% | 2.9%(+6.62)#23 | 4.3%(+5.27)#2,241 |
| 24. | Daniels | 8.4% | 2.9%(+5.46)#24 | 4.3%(+4.12)#2,754 |
| 25. | Nitro | 8.2% | 2.9%(+5.26)#25 | 4.3%(+3.92)#2,881 |
| 26. | Meadow Bridge | 7.9% | 2.9%(+4.99)#26 | 4.3%(+3.64)#3,030 |
| 27. | Stanaford | 7.7% | 2.9%(+4.84)#27 | 4.3%(+3.50)#3,124 |
| 28. | Farmington | 7.7% | 2.9%(+4.78)#28 | 4.3%(+3.44)#3,157 |
| 29. | Morgantown | 7.3% | 2.9%(+4.35)#29 | 4.3%(+3.01)#3,482 |
| 30. | Fairmont | 7.2% | 2.9%(+4.30)#30 | 4.3%(+2.95)#3,522 |
| 31. | Stonewood | 7.2% | 2.9%(+4.25)#31 | 4.3%(+2.91)#3,550 |
| 32. | Bramwell | 7.1% | 2.9%(+4.24)#32 | 4.3%(+2.89)#3,601 |
| 33. | Harrisville | 7.0% | 2.9%(+4.07)#33 | 4.3%(+2.72)#3,721 |
| 34. | Follansbee | 6.3% | 2.9%(+3.36)#34 | 4.3%(+2.02)#4,409 |
| 35. | Camden On Gauley | 6.2% | 2.9%(+3.34)#35 | 4.3%(+2.00)#4,459 |
| 36. | Princeton | 6.2% | 2.9%(+3.34)#36 | 4.3%(+1.99)#4,465 |
| 37. | Barboursville | 6.1% | 2.9%(+3.19)#37 | 4.3%(+1.84)#4,598 |
| 38. | Paden City | 6.0% | 2.9%(+3.11)#38 | 4.3%(+1.76)#4,710 |
| 39. | Chester | 5.9% | 2.9%(+2.96)#39 | 4.3%(+1.62)#4,871 |
| 40. | Fayetteville | 5.8% | 2.9%(+2.84)#40 | 4.3%(+1.50)#5,006 |
| 41. | West Milford | 5.7% | 2.9%(+2.81)#41 | 4.3%(+1.46)#5,049 |
| 42. | Falling Waters | 5.6% | 2.9%(+2.70)#42 | 4.3%(+1.35)#5,175 |
| 43. | Franklin | 5.5% | 2.9%(+2.60)#43 | 4.3%(+1.26)#5,298 |
| 44. | Grafton | 5.5% | 2.9%(+2.60)#44 | 4.3%(+1.25)#5,303 |
| 45. | Richwood | 5.4% | 2.9%(+2.47)#45 | 4.3%(+1.13)#5,475 |
| 46. | Shannondale | 5.2% | 2.9%(+2.33)#46 | 4.3%(+0.987)#5,666 |
| 47. | Prosperity | 5.2% | 2.9%(+2.31)#47 | 4.3%(+0.970)#5,686 |
| 48. | Carpendale | 5.1% | 2.9%(+2.22)#48 | 4.3%(+0.876)#5,803 |
| 49. | Ranson Corporation | 5.1% | 2.9%(+2.18)#49 | 4.3%(+0.835)#5,860 |
| 50. | Alderson | 5.0% | 2.9%(+2.04)#50 | 4.3%(+0.698)#6,083 |
| 51. | Sutton | 4.9% | 2.9%(+1.97)#51 | 4.3%(+0.626)#6,209 |
| 52. | White Hall | 4.9% | 2.9%(+1.95)#52 | 4.3%(+0.602)#6,252 |
| 53. | Hurricane | 4.8% | 2.9%(+1.85)#53 | 4.3%(+0.501)#6,446 |
| 54. | Kenova | 4.7% | 2.9%(+1.81)#54 | 4.3%(+0.463)#6,504 |
| 55. | Bolivar | 4.7% | 2.9%(+1.78)#55 | 4.3%(+0.435)#6,556 |
| 56. | Hooverson Heights | 4.5% | 2.9%(+1.62)#56 | 4.3%(+0.279)#6,864 |
| 57. | West Liberty | 4.4% | 2.9%(+1.47)#57 | 4.3%(+0.127)#7,128 |
| 58. | Summersville | 4.4% | 2.9%(+1.47)#58 | 4.3%(+0.126)#7,130 |
| 59. | Cheat Lake | 4.2% | 2.9%(+1.32)#59 | 4.3%(-0.021)#7,445 |
| 60. | Wheeling | 4.2% | 2.9%(+1.30)#60 | 4.3%(-0.043)#7,487 |
| 61. | Charleston | 4.2% | 2.9%(+1.28)#61 | 4.3%(-0.068)#7,537 |
| 62. | Romney | 4.2% | 2.9%(+1.27)#62 | 4.3%(-0.070)#7,540 |
| 63. | Martinsburg | 4.0% | 2.9%(+1.13)#63 | 4.3%(-0.213)#7,843 |
| 64. | Westover | 4.0% | 2.9%(+1.10)#64 | 4.3%(-0.248)#7,913 |
| 65. | Newark | 4.0% | 2.9%(+1.09)#65 | 4.3%(-0.252)#7,935 |
| 66. | Beckley | 3.9% | 2.9%(+1.03)#66 | 4.3%(-0.314)#8,060 |
| 67. | Lewisburg | 3.8% | 2.9%(+0.939)#67 | 4.3%(-0.406)#8,270 |
| 68. | Williamstown | 3.8% | 2.9%(+0.928)#68 | 4.3%(-0.416)#8,323 |
| 69. | Tornado | 3.8% | 2.9%(+0.897)#69 | 4.3%(-0.448)#8,387 |
| 70. | Vienna | 3.6% | 2.9%(+0.731)#70 | 4.3%(-0.613)#8,733 |
| 71. | Bethany | 3.5% | 2.9%(+0.639)#71 | 4.3%(-0.706)#8,979 |
| 72. | Buckhannon | 3.5% | 2.9%(+0.622)#72 | 4.3%(-0.723)#9,014 |
| 73. | Parkersburg | 3.4% | 2.9%(+0.502)#73 | 4.3%(-0.842)#9,294 |
| 74. | Brookhaven | 3.4% | 2.9%(+0.443)#74 | 4.3%(-0.902)#9,457 |
| 75. | Barrackville | 3.3% | 2.9%(+0.371)#75 | 4.3%(-0.973)#9,642 |
| 76. | North Hills | 3.3% | 2.9%(+0.357)#76 | 4.3%(-0.988)#9,684 |
| 77. | Pea Ridge | 3.2% | 2.9%(+0.340)#77 | 4.3%(-1.00)#9,732 |
| 78. | Blennerhassett | 3.1% | 2.9%(+0.176)#78 | 4.3%(-1.17)#10,131 |
| 79. | Huntington | 3.0% | 2.9%(+0.127)#79 | 4.3%(-1.22)#10,253 |
| 80. | Oak Hill | 2.9% | 2.9%(-0.006)#80 | 4.3%(-1.35)#10,601 |
| 81. | White Sulphur Springs | 2.9% | 2.9%(-0.015)#81 | 4.3%(-1.36)#10,628 |
| 82. | Man | 2.8% | 2.9%(-0.110)#82 | 4.3%(-1.45)#10,867 |
| 83. | Windsor Heights | 2.8% | 2.9%(-0.130)#83 | 4.3%(-1.47)#10,939 |
| 84. | Capon Bridge | 2.8% | 2.9%(-0.130)#84 | 4.3%(-1.47)#10,940 |
| 85. | Star City | 2.8% | 2.9%(-0.139)#85 | 4.3%(-1.48)#10,956 |
| 86. | Poca | 2.7% | 2.9%(-0.160)#86 | 4.3%(-1.50)#11,014 |
| 87. | Grantsville | 2.7% | 2.9%(-0.205)#87 | 4.3%(-1.55)#11,121 |
| 88. | Teays Valley | 2.6% | 2.9%(-0.273)#88 | 4.3%(-1.62)#11,301 |
| 89. | Sistersville | 2.6% | 2.9%(-0.317)#89 | 4.3%(-1.66)#11,406 |
| 90. | Buffalo | 2.6% | 2.9%(-0.343)#90 | 4.3%(-1.69)#11,474 |
| 91. | Montgomery | 2.5% | 2.9%(-0.369)#91 | 4.3%(-1.71)#11,547 |
| 92. | St Albans | 2.5% | 2.9%(-0.436)#92 | 4.3%(-1.78)#11,733 |
| 93. | Ronceverte | 2.4% | 2.9%(-0.492)#93 | 4.3%(-1.84)#11,870 |
| 94. | Pinch | 2.2% | 2.9%(-0.709)#94 | 4.3%(-2.05)#12,394 |
| 95. | Ceredo | 2.1% | 2.9%(-0.813)#95 | 4.3%(-2.16)#12,659 |
| 96. | Charles Town | 2.1% | 2.9%(-0.852)#96 | 4.3%(-2.20)#12,769 |
| 97. | Petersburg | 2.0% | 2.9%(-0.908)#97 | 4.3%(-2.25)#12,899 |
| 98. | Bridgeport | 2.0% | 2.9%(-0.917)#98 | 4.3%(-2.26)#12,928 |
| 99. | Boaz | 1.9% | 2.9%(-1.04)#99 | 4.3%(-2.39)#13,221 |
| 100. | Clarksburg | 1.8% | 2.9%(-1.09)#100 | 4.3%(-2.44)#13,346 |
Common Questions
What are the Top 10 Cities with the Highest Percentage of Population with a Degree in Visual and Performing Arts in West Virginia?
Top 10 Cities with the Highest Percentage of Population with a Degree in Visual and Performing Arts in West Virginia are:
#1
54.5%
#2
50.0%
#3
30.8%
#4
25.0%
#5
20.8%
#6
20.7%
#7
19.0%
#8
17.7%
#9
17.3%
#10
15.3%
What city has the Highest Percentage of Population with a Degree in Visual and Performing Arts in West Virginia?
Despard has the Highest Percentage of Population with a Degree in Visual and Performing Arts in West Virginia with 54.5%.
What is the Percentage of Population with a Degree in Visual and Performing Arts in the State of West Virginia?
Percentage of Population with a Degree in Visual and Performing Arts in West Virginia is 2.9%.
What is the Percentage of Population with a Degree in Visual and Performing Arts in the United States?
Percentage of Population with a Degree in Visual and Performing Arts in the United States is 4.3%.