Moss Beach, CA Map & Demographics
Moss Beach Map
Moss Beach Overview
$53,619
PER CAPITA INCOME
$150,484
AVG FAMILY INCOME
$116,950
AVG HOUSEHOLD INCOME
49.4%
WAGE / INCOME GAP [ % ]
50.6¢/ $1
WAGE / INCOME GAP [ $ ]
0.42
INEQUALITY / GINI INDEX
3,165
TOTAL POPULATION
1,639
MALE POPULATION
1,526
FEMALE POPULATION
107.40
MALES / 100 FEMALES
93.11
FEMALES / 100 MALES
46.6
MEDIAN AGE
3.4
AVG FAMILY SIZE
2.8
AVG HOUSEHOLD SIZE
1,494
LABOR FORCE [ PEOPLE ]
57.4%
PERCENT IN LABOR FORCE
0.2%
UNEMPLOYMENT RATE
Moss Beach Zip Codes
Moss Beach Area Codes
Income in Moss Beach
Income Overview in Moss Beach
Per Capita Income in Moss Beach is $53,619, while median incomes of families and households are $150,484 and $116,950 respectively.
| Characteristic | Number | Measure |
| Per Capita Income | 3,165 | $53,619 |
| Median Family Income | 752 | $150,484 |
| Mean Family Income | 752 | $185,120 |
| Median Household Income | 1,087 | $116,950 |
| Mean Household Income | 1,087 | $152,729 |
| Income Deficit | 752 | $0 |
| Wage / Income Gap (%) | 3,165 | 49.41% |
| Wage / Income Gap ($) | 3,165 | 50.59¢ per $1 |
| Gini / Inequality Index | 3,165 | 0.42 |
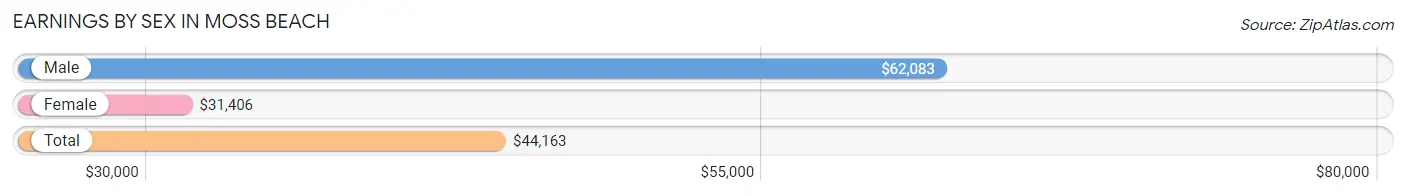
Earnings by Sex in Moss Beach
Average Earnings in Moss Beach are $44,163, $62,083 for men and $31,406 for women, a difference of 49.4%.
| Sex | Number | Average Earnings |
| Male | 817 (50.4%) | $62,083 |
| Female | 803 (49.6%) | $31,406 |
| Total | 1,620 (100.0%) | $44,163 |
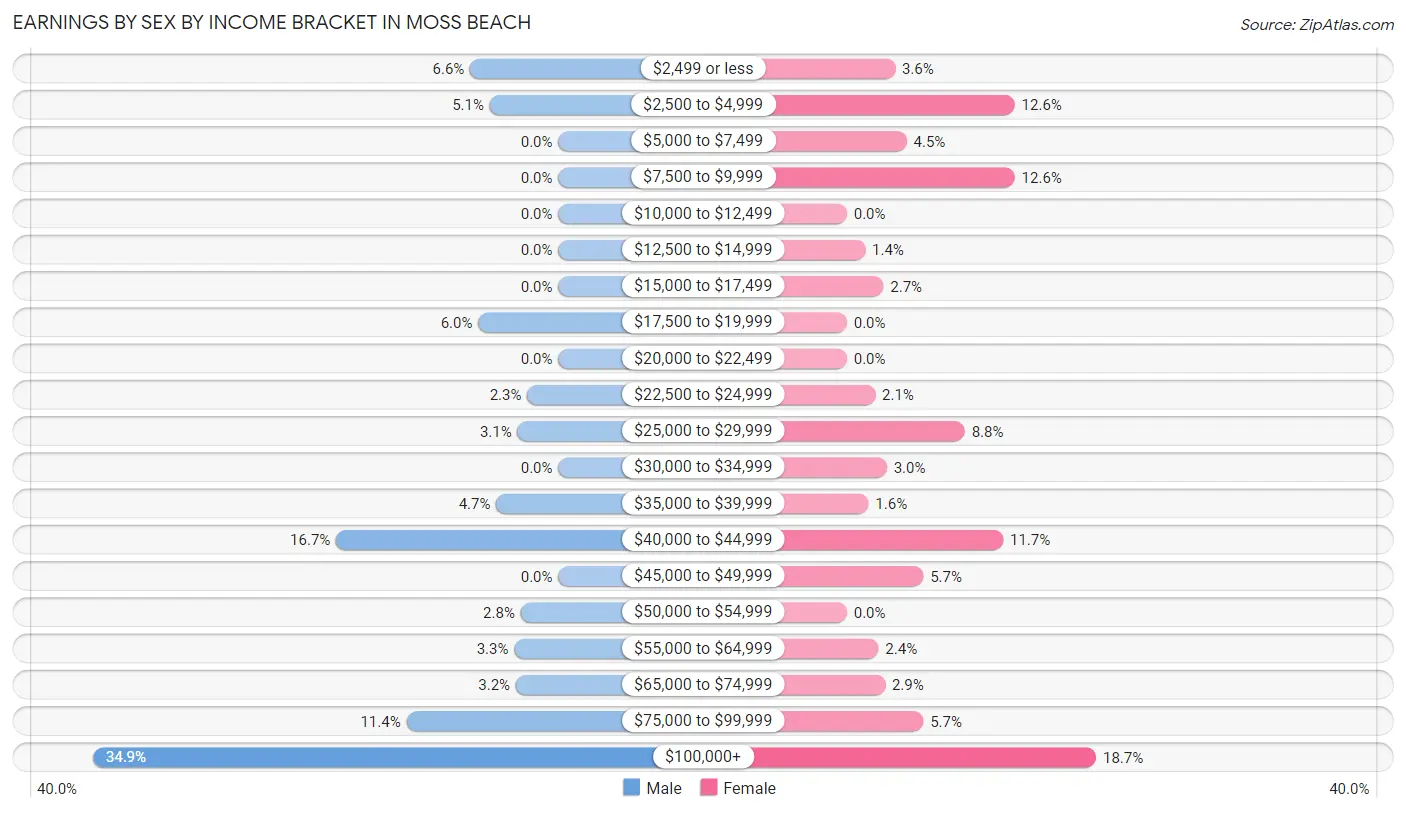
Earnings by Sex by Income Bracket in Moss Beach
The most common earnings brackets in Moss Beach are $100,000+ for men (285 | 34.9%) and $100,000+ for women (150 | 18.7%).
| Income | Male | Female |
| $2,499 or less | 54 (6.6%) | 29 (3.6%) |
| $2,500 to $4,999 | 42 (5.1%) | 101 (12.6%) |
| $5,000 to $7,499 | 0 (0.0%) | 36 (4.5%) |
| $7,500 to $9,999 | 0 (0.0%) | 101 (12.6%) |
| $10,000 to $12,499 | 0 (0.0%) | 0 (0.0%) |
| $12,500 to $14,999 | 0 (0.0%) | 11 (1.4%) |
| $15,000 to $17,499 | 0 (0.0%) | 22 (2.7%) |
| $17,500 to $19,999 | 49 (6.0%) | 0 (0.0%) |
| $20,000 to $22,499 | 0 (0.0%) | 0 (0.0%) |
| $22,500 to $24,999 | 19 (2.3%) | 17 (2.1%) |
| $25,000 to $29,999 | 25 (3.1%) | 71 (8.8%) |
| $30,000 to $34,999 | 0 (0.0%) | 24 (3.0%) |
| $35,000 to $39,999 | 38 (4.6%) | 13 (1.6%) |
| $40,000 to $44,999 | 136 (16.7%) | 94 (11.7%) |
| $45,000 to $49,999 | 0 (0.0%) | 46 (5.7%) |
| $50,000 to $54,999 | 23 (2.8%) | 0 (0.0%) |
| $55,000 to $64,999 | 27 (3.3%) | 19 (2.4%) |
| $65,000 to $74,999 | 26 (3.2%) | 23 (2.9%) |
| $75,000 to $99,999 | 93 (11.4%) | 46 (5.7%) |
| $100,000+ | 285 (34.9%) | 150 (18.7%) |
| Total | 817 (100.0%) | 803 (100.0%) |
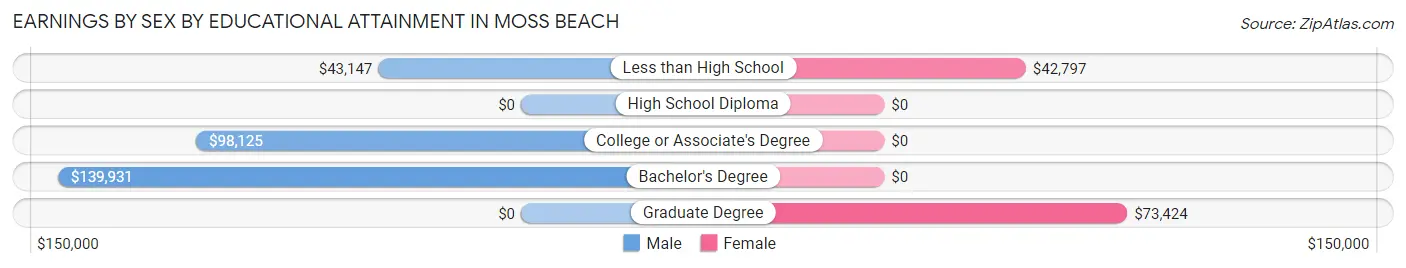
Earnings by Sex by Educational Attainment in Moss Beach
Average earnings in Moss Beach are $76,418 for men and $43,803 for women, a difference of 42.7%. Men with an educational attainment of bachelor's degree enjoy the highest average annual earnings of $139,931, while those with less than high school education earn the least with $43,147. Women with an educational attainment of graduate degree earn the most with the average annual earnings of $73,424, while those with less than high school education have the smallest earnings of $42,797.
| Educational Attainment | Male Income | Female Income |
| Less than High School | $43,147 | $42,797 |
| High School Diploma | - | - |
| College or Associate's Degree | $98,125 | $0 |
| Bachelor's Degree | $139,931 | $0 |
| Graduate Degree | - | - |
| Total | $76,418 | $43,803 |
Family Income in Moss Beach
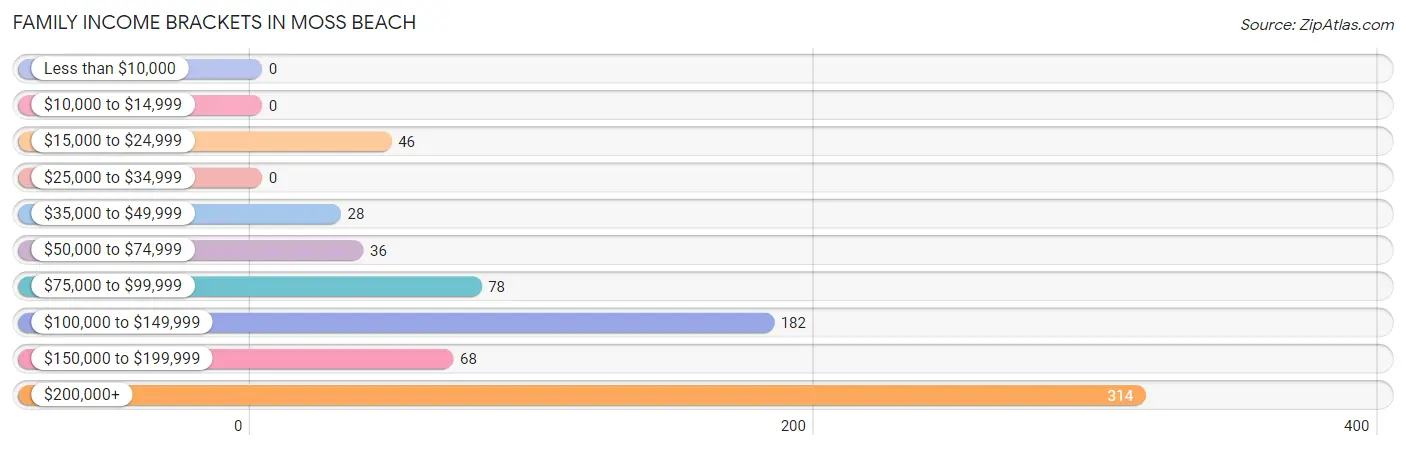
Family Income Brackets in Moss Beach
According to the Moss Beach family income data, there are 314 families falling into the $200,000+ income range, which is the most common income bracket and makes up 41.8% of all families.
| Income Bracket | # Families | % Families |
| Less than $10,000 | 0 | 0.0% |
| $10,000 to $14,999 | 0 | 0.0% |
| $15,000 to $24,999 | 46 | 6.1% |
| $25,000 to $34,999 | 0 | 0.0% |
| $35,000 to $49,999 | 28 | 3.7% |
| $50,000 to $74,999 | 36 | 4.8% |
| $75,000 to $99,999 | 78 | 10.4% |
| $100,000 to $149,999 | 182 | 24.2% |
| $150,000 to $199,999 | 68 | 9.0% |
| $200,000+ | 314 | 41.8% |
Family Income by Famaliy Size in Moss Beach
4-person families (194 | 25.8%) account for the highest median family income in Moss Beach with $250,001 per family, while 4-person families (194 | 25.8%) have the highest median income of $62,500 per family member.

| Income Bracket | # Families | Median Income |
| 2-Person Families | 385 (51.2%) | $111,726 |
| 3-Person Families | 0 (0.0%) | $0 |
| 4-Person Families | 194 (25.8%) | $250,001 |
| 5-Person Families | 137 (18.2%) | $127,141 |
| 6-Person Families | 36 (4.8%) | $0 |
| 7+ Person Families | 0 (0.0%) | $0 |
| Total | 752 (100.0%) | $150,484 |
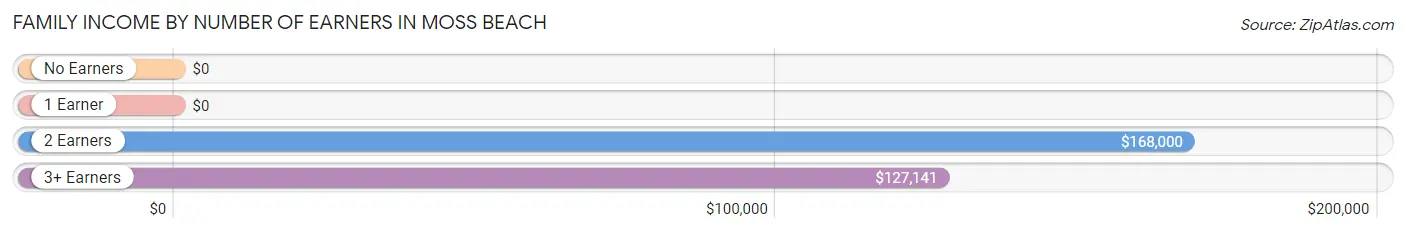
Family Income by Number of Earners in Moss Beach
| Number of Earners | # Families | Median Income |
| No Earners | 35 (4.6%) | $0 |
| 1 Earner | 384 (51.1%) | $0 |
| 2 Earners | 124 (16.5%) | $168,000 |
| 3+ Earners | 209 (27.8%) | $127,141 |
| Total | 752 (100.0%) | $150,484 |
Household Income in Moss Beach
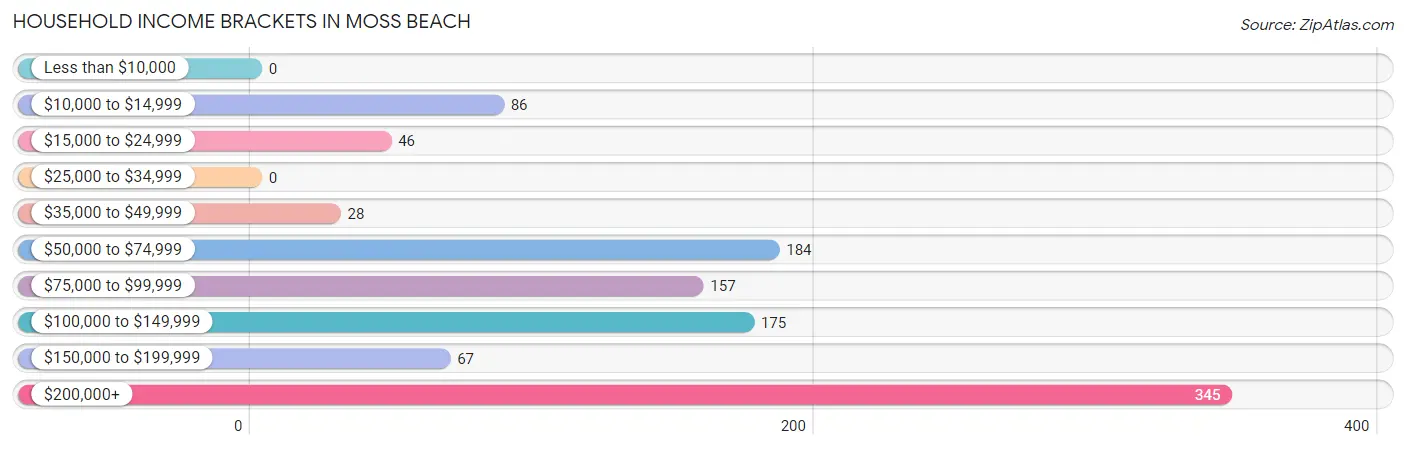
Household Income Brackets in Moss Beach
With 345 households falling in the category, the $200,000+ income range is the most frequent in Moss Beach, accounting for 31.7% of all households.
| Income Bracket | # Households | % Households |
| Less than $10,000 | 0 | 0.0% |
| $10,000 to $14,999 | 86 | 7.9% |
| $15,000 to $24,999 | 46 | 4.2% |
| $25,000 to $34,999 | 0 | 0.0% |
| $35,000 to $49,999 | 28 | 2.6% |
| $50,000 to $74,999 | 184 | 16.9% |
| $75,000 to $99,999 | 157 | 14.4% |
| $100,000 to $149,999 | 175 | 16.1% |
| $150,000 to $199,999 | 67 | 6.2% |
| $200,000+ | 345 | 31.7% |
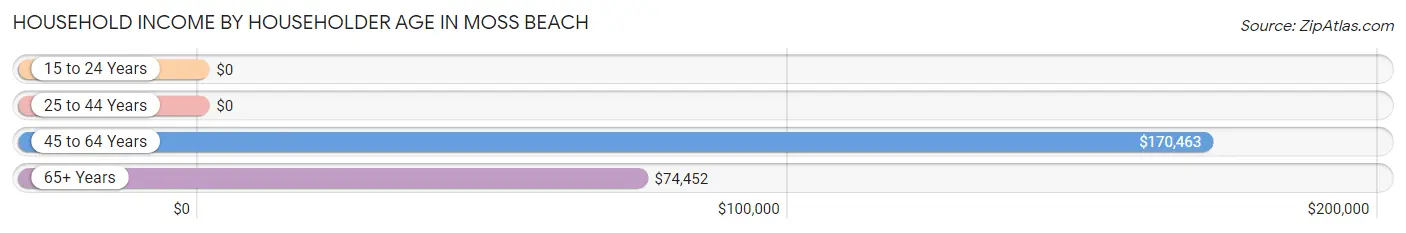
Household Income by Householder Age in Moss Beach
The median household income in Moss Beach is $116,950, with the highest median household income of $170,463 found in the 45 to 64 years age bracket for the primary householder. A total of 438 households (40.3%) fall into this category.
| Income Bracket | # Households | Median Income |
| 15 to 24 Years | 0 (0.0%) | $0 |
| 25 to 44 Years | 190 (17.5%) | $0 |
| 45 to 64 Years | 438 (40.3%) | $170,463 |
| 65+ Years | 459 (42.2%) | $74,452 |
| Total | 1,087 (100.0%) | $116,950 |
Poverty in Moss Beach
Income Below Poverty by Sex and Age in Moss Beach
With 2.8% poverty level for males and 7.9% for females among the residents of Moss Beach, 25 to 34 year old males and 75 year old and over females are the most vulnerable to poverty, with 16 males (25.4%) and 72 females (44.4%) in their respective age groups living below the poverty level.
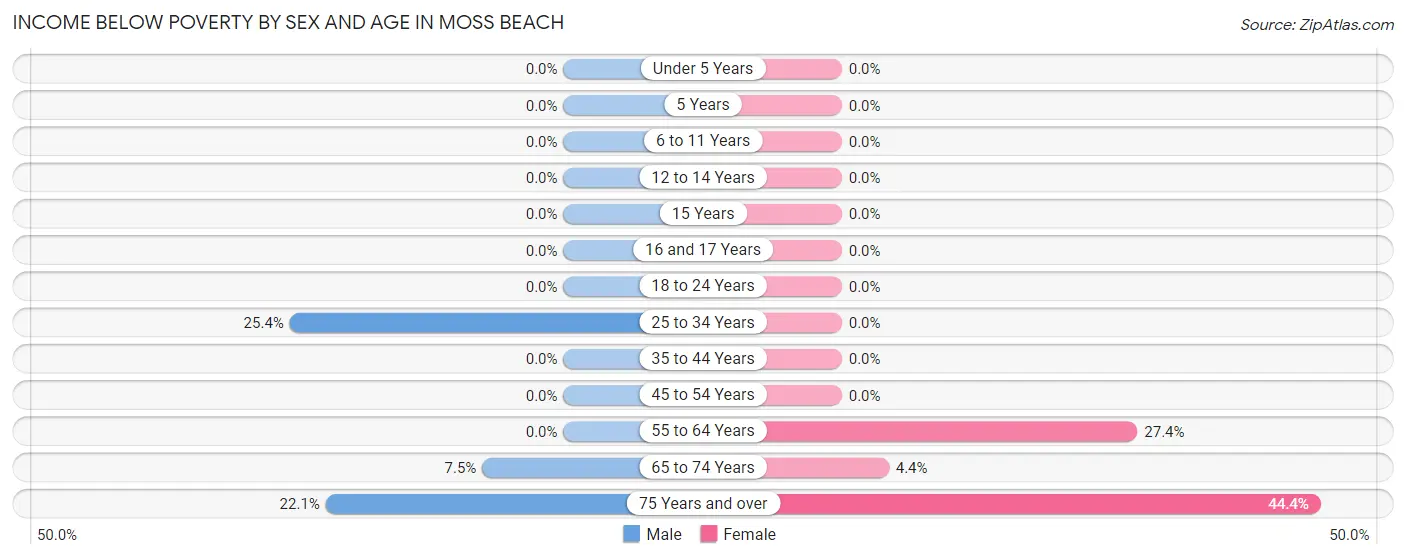
| Age Bracket | Male | Female |
| Under 5 Years | 0 (0.0%) | 0 (0.0%) |
| 5 Years | 0 (0.0%) | 0 (0.0%) |
| 6 to 11 Years | 0 (0.0%) | 0 (0.0%) |
| 12 to 14 Years | 0 (0.0%) | 0 (0.0%) |
| 15 Years | 0 (0.0%) | 0 (0.0%) |
| 16 and 17 Years | 0 (0.0%) | 0 (0.0%) |
| 18 to 24 Years | 0 (0.0%) | 0 (0.0%) |
| 25 to 34 Years | 16 (25.4%) | 0 (0.0%) |
| 35 to 44 Years | 0 (0.0%) | 0 (0.0%) |
| 45 to 54 Years | 0 (0.0%) | 0 (0.0%) |
| 55 to 64 Years | 0 (0.0%) | 31 (27.4%) |
| 65 to 74 Years | 14 (7.5%) | 12 (4.4%) |
| 75 Years and over | 15 (22.1%) | 72 (44.4%) |
| Total | 45 (2.8%) | 115 (7.9%) |
Income Above Poverty by Sex and Age in Moss Beach
According to the poverty statistics in Moss Beach, males aged under 5 years and females aged under 5 years are the age groups that are most secure financially, with 100.0% of males and 100.0% of females in these age groups living above the poverty line.
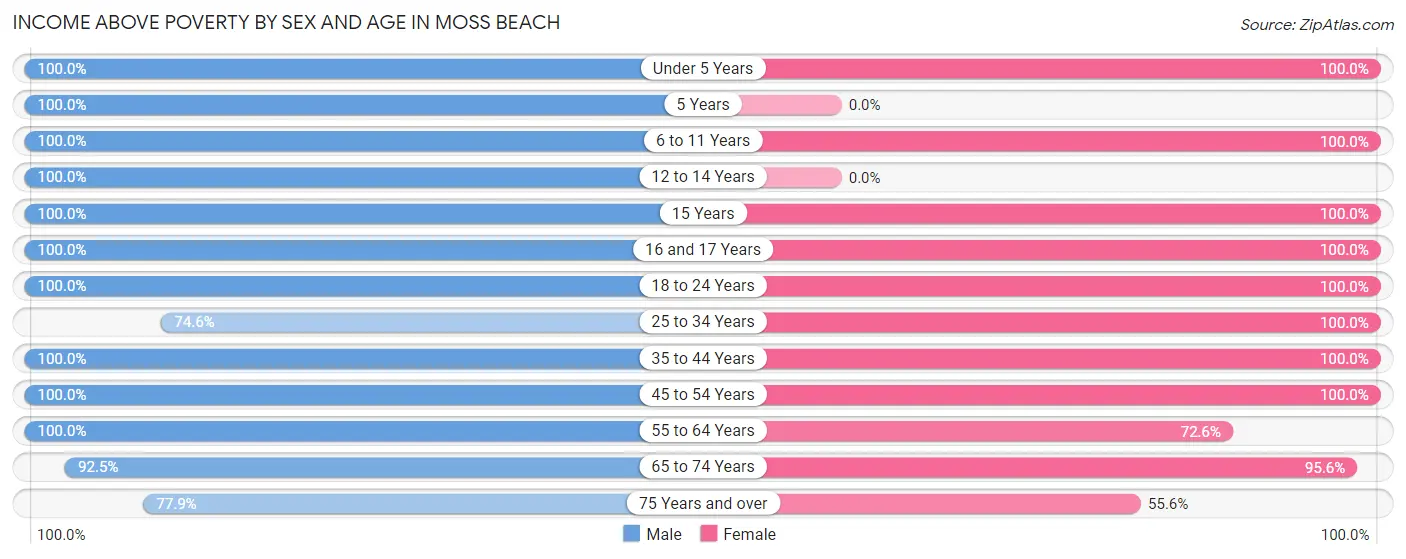
| Age Bracket | Male | Female |
| Under 5 Years | 150 (100.0%) | 63 (100.0%) |
| 5 Years | 37 (100.0%) | 0 (0.0%) |
| 6 to 11 Years | 137 (100.0%) | 38 (100.0%) |
| 12 to 14 Years | 76 (100.0%) | 0 (0.0%) |
| 15 Years | 21 (100.0%) | 40 (100.0%) |
| 16 and 17 Years | 38 (100.0%) | 176 (100.0%) |
| 18 to 24 Years | 166 (100.0%) | 24 (100.0%) |
| 25 to 34 Years | 47 (74.6%) | 127 (100.0%) |
| 35 to 44 Years | 219 (100.0%) | 179 (100.0%) |
| 45 to 54 Years | 280 (100.0%) | 262 (100.0%) |
| 55 to 64 Years | 144 (100.0%) | 82 (72.6%) |
| 65 to 74 Years | 172 (92.5%) | 263 (95.6%) |
| 75 Years and over | 53 (77.9%) | 90 (55.6%) |
| Total | 1,540 (97.2%) | 1,344 (92.1%) |
Income Below Poverty Among Married-Couple Families in Moss Beach
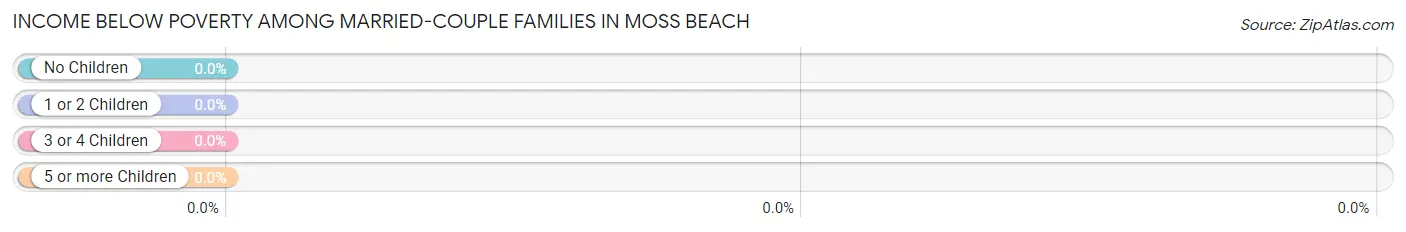
| Children | Above Poverty | Below Poverty |
| No Children | 299 (100.0%) | 0 (0.0%) |
| 1 or 2 Children | 289 (100.0%) | 0 (0.0%) |
| 3 or 4 Children | 36 (100.0%) | 0 (0.0%) |
| 5 or more Children | 0 (0.0%) | 0 (0.0%) |
| Total | 624 (100.0%) | 0 (0.0%) |
Income Below Poverty Among Single-Parent Households in Moss Beach
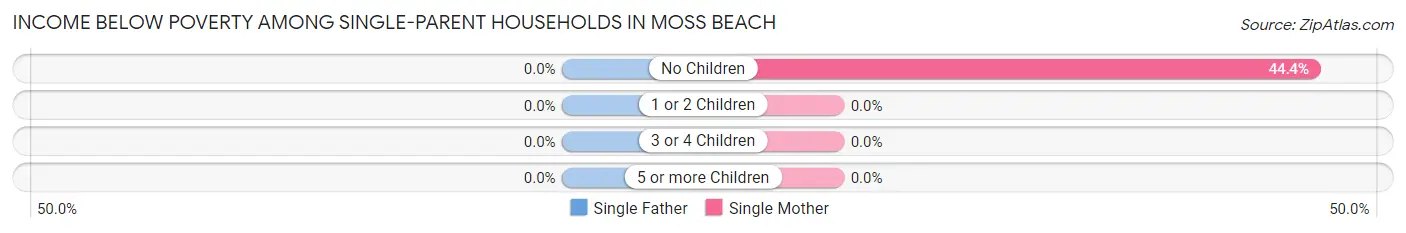
| Children | Single Father | Single Mother |
| No Children | 0 (0.0%) | 12 (44.4%) |
| 1 or 2 Children | 0 (0.0%) | 0 (0.0%) |
| 3 or 4 Children | 0 (0.0%) | 0 (0.0%) |
| 5 or more Children | 0 (0.0%) | 0 (0.0%) |
| Total | 0 (0.0%) | 12 (25.0%) |
Income Below Poverty Among Married-Couple vs Single-Parent Households in Moss Beach
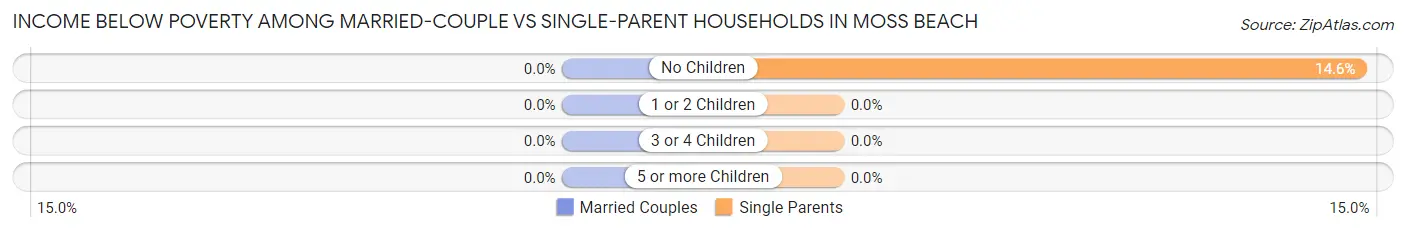
| Children | Married-Couple Families | Single-Parent Households |
| No Children | 0 (0.0%) | 12 (14.6%) |
| 1 or 2 Children | 0 (0.0%) | 0 (0.0%) |
| 3 or 4 Children | 0 (0.0%) | 0 (0.0%) |
| 5 or more Children | 0 (0.0%) | 0 (0.0%) |
| Total | 0 (0.0%) | 12 (9.4%) |
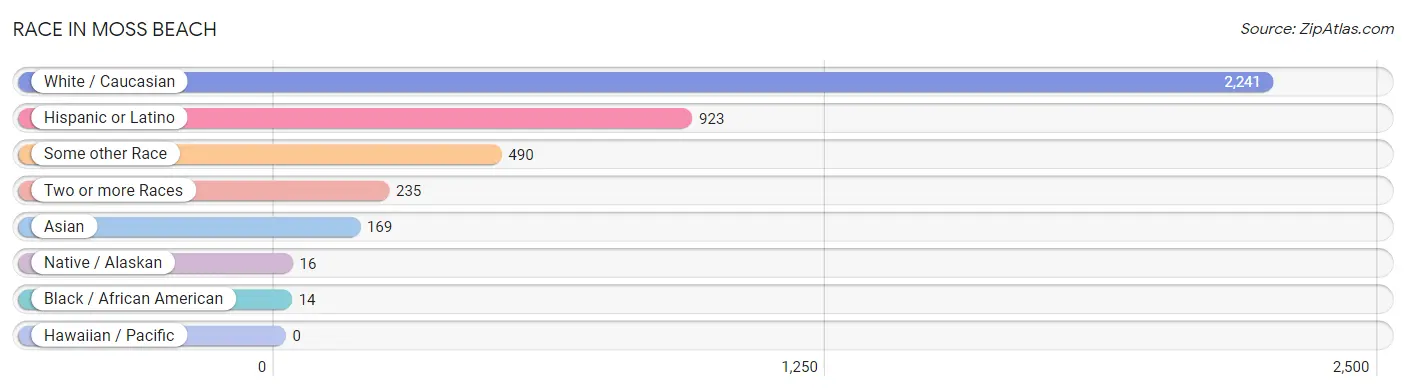
Race in Moss Beach
The most populous races in Moss Beach are White / Caucasian (2,241 | 70.8%), Hispanic or Latino (923 | 29.2%), and Some other Race (490 | 15.5%).
| Race | # Population | % Population |
| Asian | 169 | 5.3% |
| Black / African American | 14 | 0.4% |
| Hawaiian / Pacific | 0 | 0.0% |
| Hispanic or Latino | 923 | 29.2% |
| Native / Alaskan | 16 | 0.5% |
| White / Caucasian | 2,241 | 70.8% |
| Two or more Races | 235 | 7.4% |
| Some other Race | 490 | 15.5% |
| Total | 3,165 | 100.0% |
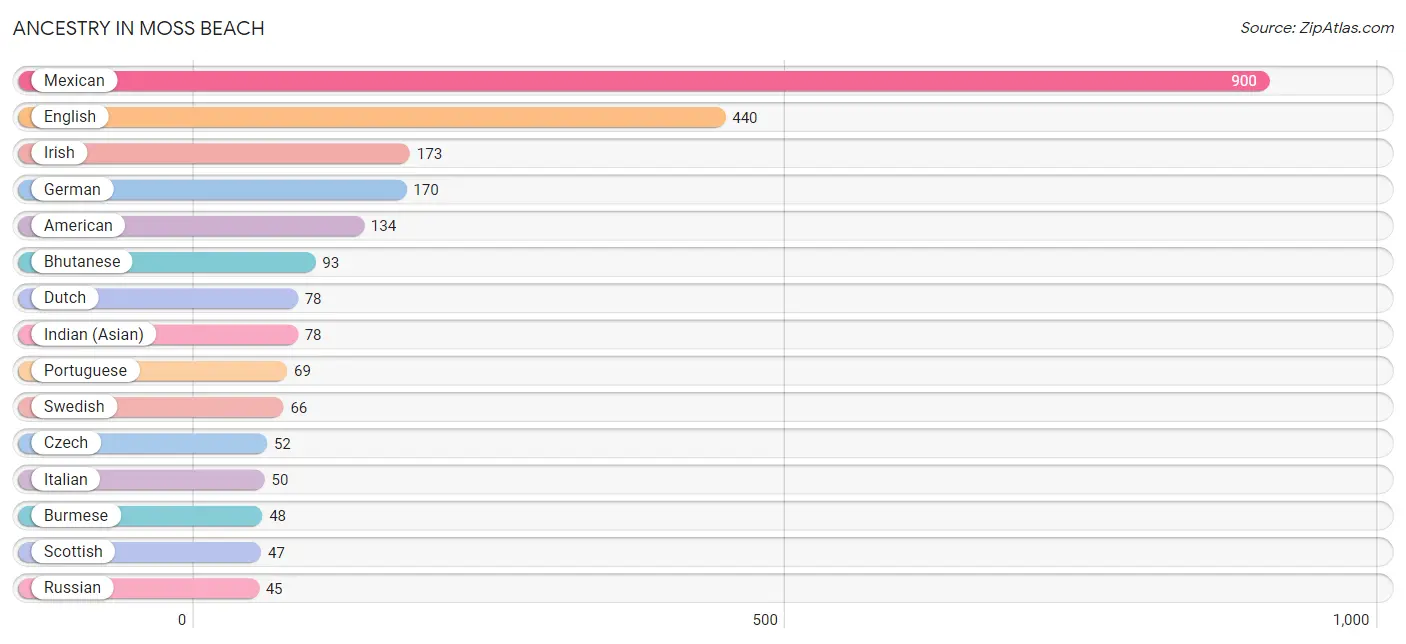
Ancestry in Moss Beach
The most populous ancestries reported in Moss Beach are Mexican (900 | 28.4%), English (440 | 13.9%), Irish (173 | 5.5%), German (170 | 5.4%), and American (134 | 4.2%), together accounting for 57.4% of all Moss Beach residents.
| Ancestry | # Population | % Population |
| American | 134 | 4.2% |
| Belgian | 15 | 0.5% |
| Bhutanese | 93 | 2.9% |
| British | 28 | 0.9% |
| Burmese | 48 | 1.5% |
| Central American | 12 | 0.4% |
| Cherokee | 25 | 0.8% |
| Czech | 52 | 1.6% |
| Dutch | 78 | 2.5% |
| English | 440 | 13.9% |
| European | 36 | 1.1% |
| French Canadian | 23 | 0.7% |
| German | 170 | 5.4% |
| Greek | 24 | 0.8% |
| Guatemalan | 12 | 0.4% |
| Indian (Asian) | 78 | 2.5% |
| Irish | 173 | 5.5% |
| Iroquois | 3 | 0.1% |
| Italian | 50 | 1.6% |
| Korean | 20 | 0.6% |
| Mexican | 900 | 28.4% |
| Norwegian | 25 | 0.8% |
| Polish | 24 | 0.8% |
| Portuguese | 69 | 2.2% |
| Russian | 45 | 1.4% |
| Scotch-Irish | 31 | 1.0% |
| Scottish | 47 | 1.5% |
| Spaniard | 11 | 0.4% |
| Sri Lankan | 5 | 0.2% |
| Swedish | 66 | 2.1% |
| Ukrainian | 21 | 0.7% |
| Welsh | 30 | 0.9% | View All 32 Rows |
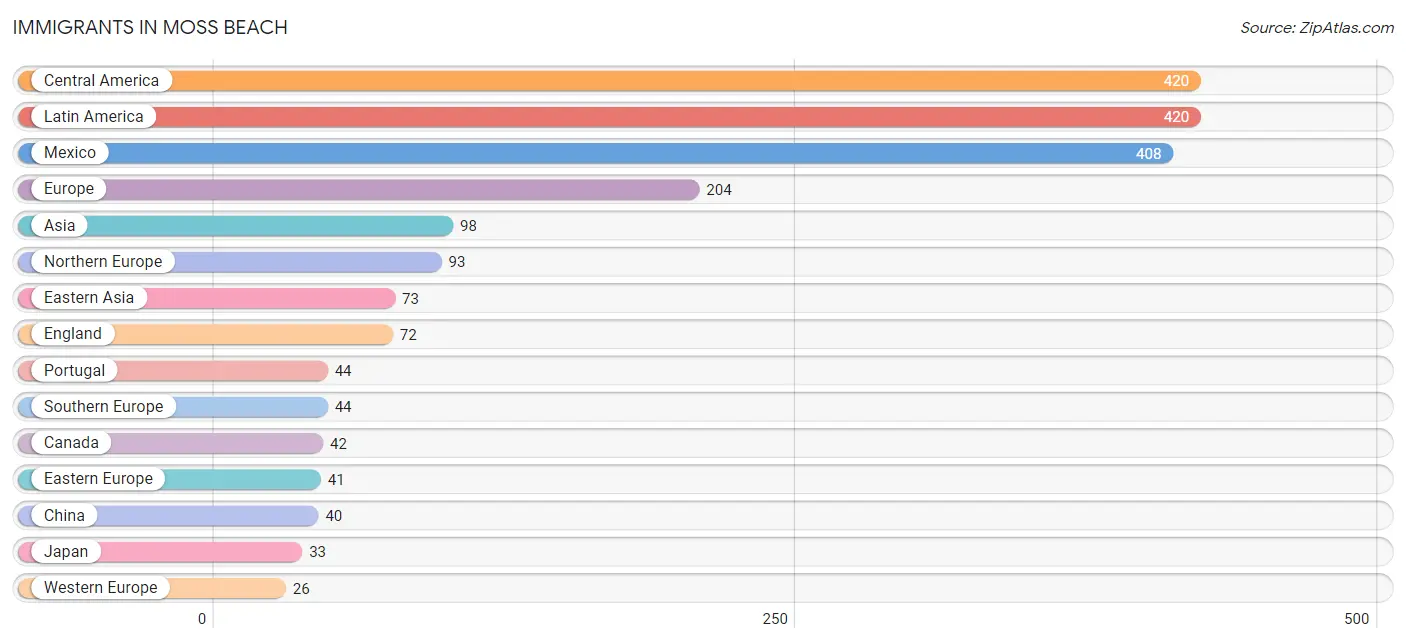
Immigrants in Moss Beach
The most numerous immigrant groups reported in Moss Beach came from Central America (420 | 13.3%), Latin America (420 | 13.3%), Mexico (408 | 12.9%), Europe (204 | 6.5%), and Asia (98 | 3.1%), together accounting for 49.0% of all Moss Beach residents.
| Immigration Origin | # Population | % Population |
| Asia | 98 | 3.1% |
| Canada | 42 | 1.3% |
| Central America | 420 | 13.3% |
| China | 40 | 1.3% |
| Eastern Asia | 73 | 2.3% |
| Eastern Europe | 41 | 1.3% |
| England | 72 | 2.3% |
| Europe | 204 | 6.5% |
| France | 22 | 0.7% |
| Germany | 4 | 0.1% |
| Guatemala | 12 | 0.4% |
| Hong Kong | 13 | 0.4% |
| Japan | 33 | 1.0% |
| Latin America | 420 | 13.3% |
| Mexico | 408 | 12.9% |
| Northern Europe | 93 | 2.9% |
| Philippines | 20 | 0.6% |
| Portugal | 44 | 1.4% |
| Russia | 20 | 0.6% |
| Scotland | 21 | 0.7% |
| South Eastern Asia | 25 | 0.8% |
| Southern Europe | 44 | 1.4% |
| Ukraine | 21 | 0.7% |
| Vietnam | 5 | 0.2% |
| Western Europe | 26 | 0.8% | View All 25 Rows |
Sex and Age in Moss Beach
Sex and Age in Moss Beach
The most populous age groups in Moss Beach are 50 to 54 Years (178 | 10.9%) for men and 15 to 19 Years (216 | 14.1%) for women.
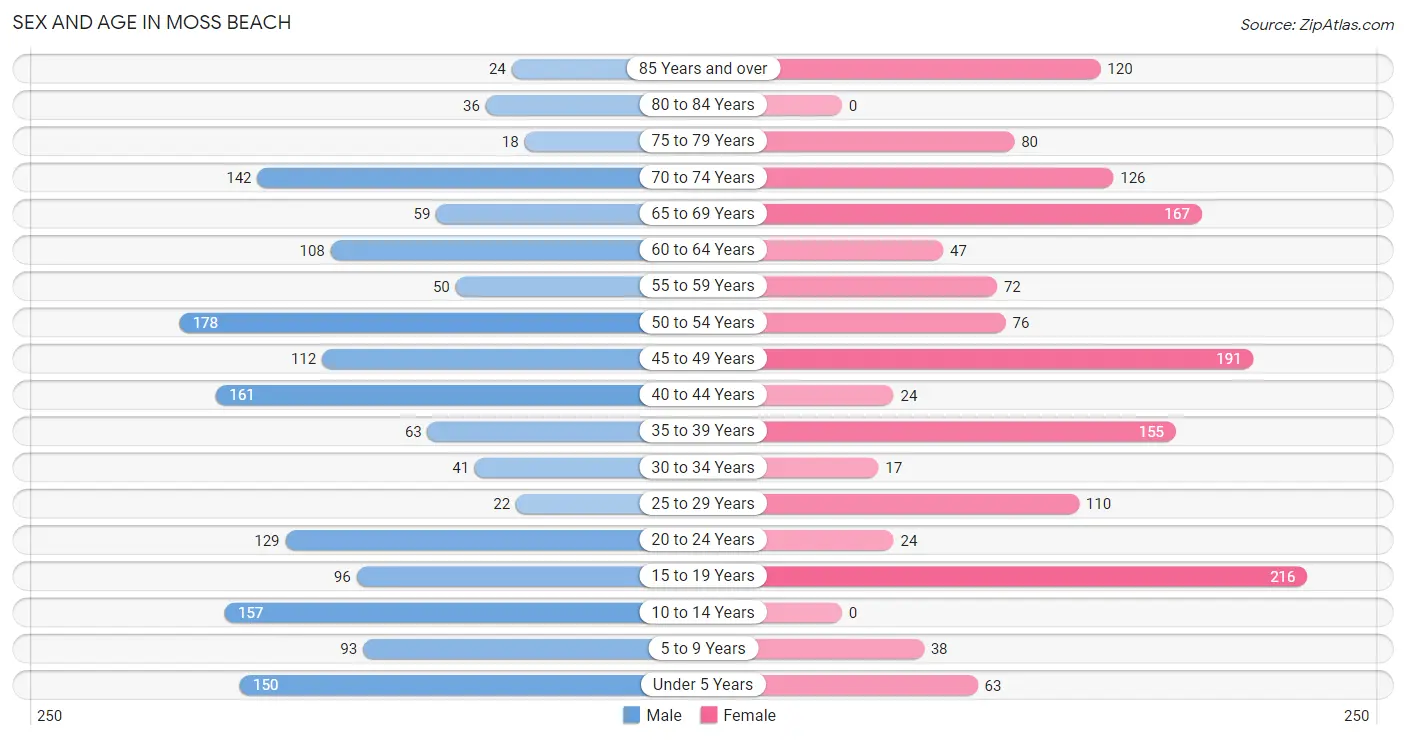
| Age Bracket | Male | Female |
| Under 5 Years | 150 (9.1%) | 63 (4.1%) |
| 5 to 9 Years | 93 (5.7%) | 38 (2.5%) |
| 10 to 14 Years | 157 (9.6%) | 0 (0.0%) |
| 15 to 19 Years | 96 (5.9%) | 216 (14.1%) |
| 20 to 24 Years | 129 (7.9%) | 24 (1.6%) |
| 25 to 29 Years | 22 (1.3%) | 110 (7.2%) |
| 30 to 34 Years | 41 (2.5%) | 17 (1.1%) |
| 35 to 39 Years | 63 (3.8%) | 155 (10.2%) |
| 40 to 44 Years | 161 (9.8%) | 24 (1.6%) |
| 45 to 49 Years | 112 (6.8%) | 191 (12.5%) |
| 50 to 54 Years | 178 (10.9%) | 76 (5.0%) |
| 55 to 59 Years | 50 (3.0%) | 72 (4.7%) |
| 60 to 64 Years | 108 (6.6%) | 47 (3.1%) |
| 65 to 69 Years | 59 (3.6%) | 167 (10.9%) |
| 70 to 74 Years | 142 (8.7%) | 126 (8.3%) |
| 75 to 79 Years | 18 (1.1%) | 80 (5.2%) |
| 80 to 84 Years | 36 (2.2%) | 0 (0.0%) |
| 85 Years and over | 24 (1.5%) | 120 (7.9%) |
| Total | 1,639 (100.0%) | 1,526 (100.0%) |
Families and Households in Moss Beach
Median Family Size in Moss Beach
The median family size in Moss Beach is 3.39 persons per family, with married-couple families (624 | 83.0%) accounting for the largest median family size of 3.59 persons per family. On the other hand, single male/father families (80 | 10.6%) represent the smallest median family size with 2.18 persons per family.
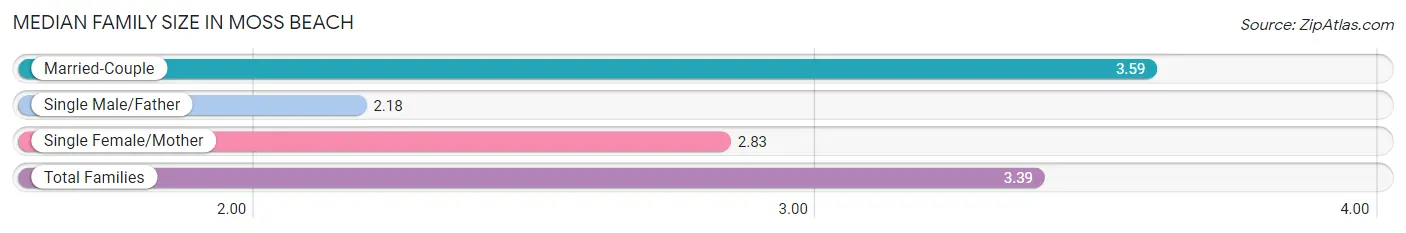
| Family Type | # Families | Family Size |
| Married-Couple | 624 (83.0%) | 3.59 |
| Single Male/Father | 80 (10.6%) | 2.18 |
| Single Female/Mother | 48 (6.4%) | 2.83 |
| Total Families | 752 (100.0%) | 3.39 |
Median Household Size in Moss Beach
The median household size in Moss Beach is 2.79 persons per household, with married-couple households (624 | 57.4%) accounting for the largest median household size of 3.71 persons per household. non-family households (335 | 30.8%) represent the smallest median household size with 1.11 persons per household.
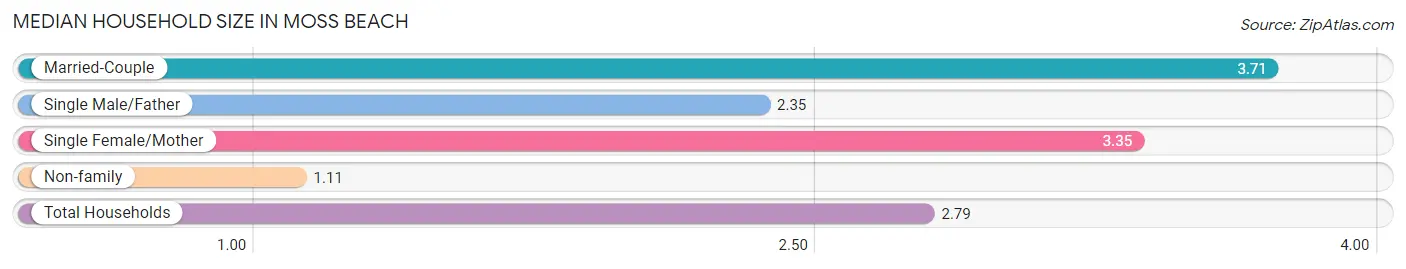
| Household Type | # Households | Household Size |
| Married-Couple | 624 (57.4%) | 3.71 |
| Single Male/Father | 80 (7.4%) | 2.35 |
| Single Female/Mother | 48 (4.4%) | 3.35 |
| Non-family | 335 (30.8%) | 1.11 |
| Total Households | 1,087 (100.0%) | 2.79 |
Household Size by Marriage Status in Moss Beach
Out of a total of 1,087 households in Moss Beach, 752 (69.2%) are family households, while 335 (30.8%) are nonfamily households. The most numerous type of family households are 2-person households, comprising 292, and the most common type of nonfamily households are 1-person households, comprising 288.
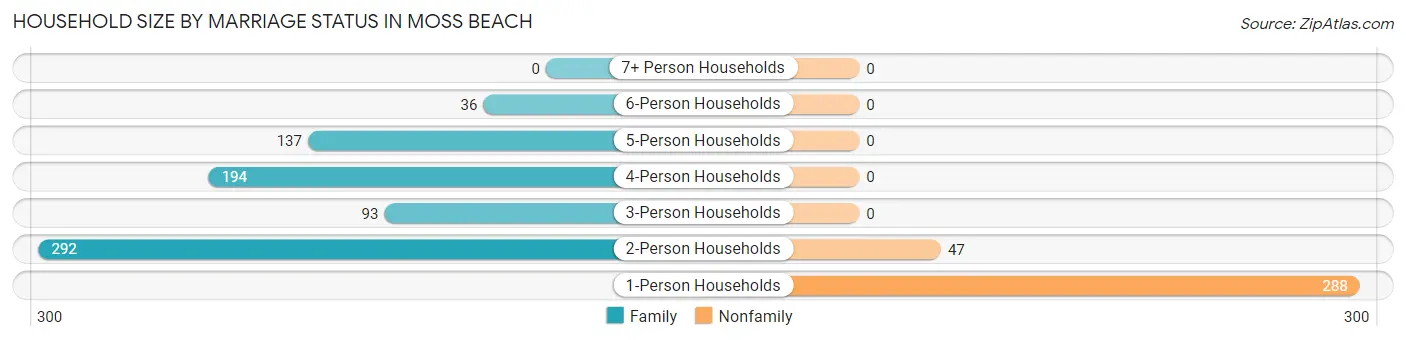
| Household Size | Family Households | Nonfamily Households |
| 1-Person Households | - | 288 (26.5%) |
| 2-Person Households | 292 (26.9%) | 47 (4.3%) |
| 3-Person Households | 93 (8.6%) | 0 (0.0%) |
| 4-Person Households | 194 (17.8%) | 0 (0.0%) |
| 5-Person Households | 137 (12.6%) | 0 (0.0%) |
| 6-Person Households | 36 (3.3%) | 0 (0.0%) |
| 7+ Person Households | 0 (0.0%) | 0 (0.0%) |
| Total | 752 (69.2%) | 335 (30.8%) |
Female Fertility in Moss Beach
Fertility by Age in Moss Beach
| Age Bracket | Women with Births | Births / 1,000 Women |
| 15 to 19 years | 0 (0.0%) | 0.0 |
| 20 to 34 years | 0 (0.0%) | 0.0 |
| 35 to 50 years | 0 (0.0%) | 0.0 |
| Total | 0 (0.0%) | 0.0 |
Fertility by Age by Marriage Status in Moss Beach
| Age Bracket | Married | Unmarried |
| 15 to 19 years | 0 (0.0%) | 0 (0.0%) |
| 20 to 34 years | 0 (0.0%) | 0 (0.0%) |
| 35 to 50 years | 0 (0.0%) | 0 (0.0%) |
| Total | 0 (0.0%) | 0 (0.0%) |
Fertility by Education in Moss Beach
| Educational Attainment | Women with Births | Births / 1,000 Women |
| Less than High School | 0 (0.0%) | 0.0 |
| High School Diploma | 0 (0.0%) | 0.0 |
| College or Associate's Degree | 0 (0.0%) | 0.0 |
| Bachelor's Degree | 0 (0.0%) | 0.0 |
| Graduate Degree | 0 (0.0%) | 0.0 |
| Total | 0 (0.0%) | 0.0 |
Fertility by Education by Marriage Status in Moss Beach
| Educational Attainment | Married | Unmarried |
| Less than High School | 0 (0.0%) | 0 (0.0%) |
| High School Diploma | 0 (0.0%) | 0 (0.0%) |
| College or Associate's Degree | 0 (0.0%) | 0 (0.0%) |
| Bachelor's Degree | 0 (0.0%) | 0 (0.0%) |
| Graduate Degree | 0 (0.0%) | 0 (0.0%) |
| Total | 0 (0.0%) | 0 (0.0%) |
Employment Characteristics in Moss Beach
Employment by Class of Employer in Moss Beach
Among the 1,491 employed individuals in Moss Beach, private company employees (922 | 61.8%), self-employed (not incorporated) (263 | 17.6%), and local government employees (169 | 11.3%) make up the most common classes of employment.
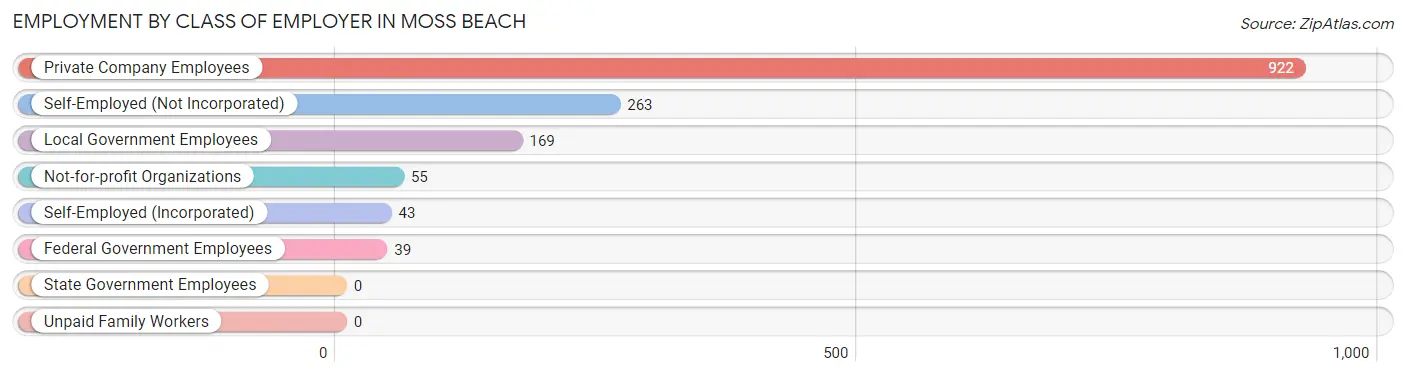
| Employer Class | # Employees | % Employees |
| Private Company Employees | 922 | 61.8% |
| Self-Employed (Incorporated) | 43 | 2.9% |
| Self-Employed (Not Incorporated) | 263 | 17.6% |
| Not-for-profit Organizations | 55 | 3.7% |
| Local Government Employees | 169 | 11.3% |
| State Government Employees | 0 | 0.0% |
| Federal Government Employees | 39 | 2.6% |
| Unpaid Family Workers | 0 | 0.0% |
| Total | 1,491 | 100.0% |
Employment Status by Age in Moss Beach
According to the labor force statistics for Moss Beach, out of the total population over 16 years of age (2,603), 57.4% or 1,494 individuals are in the labor force, with 0.2% or 3 of them unemployed. The age group with the highest labor force participation rate is 25 to 29 years, with 100.0% or 132 individuals in the labor force. Within the labor force, the 55 to 59 years age range has the highest percentage of unemployed individuals, with 3.3% or 3 of them being unemployed.
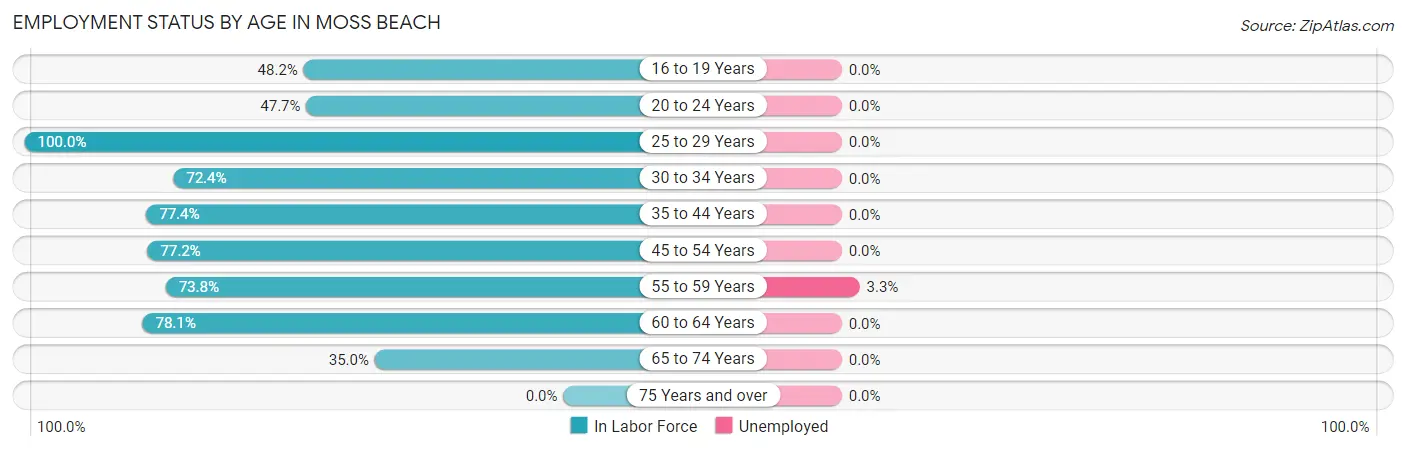
| Age Bracket | In Labor Force | Unemployed |
| 16 to 19 Years | 121 (48.2%) | 0 (0.0%) |
| 20 to 24 Years | 73 (47.7%) | 0 (0.0%) |
| 25 to 29 Years | 132 (100.0%) | 0 (0.0%) |
| 30 to 34 Years | 42 (72.4%) | 0 (0.0%) |
| 35 to 44 Years | 312 (77.4%) | 0 (0.0%) |
| 45 to 54 Years | 430 (77.2%) | 0 (0.0%) |
| 55 to 59 Years | 90 (73.8%) | 3 (3.3%) |
| 60 to 64 Years | 121 (78.1%) | 0 (0.0%) |
| 65 to 74 Years | 173 (35.0%) | 0 (0.0%) |
| 75 Years and over | 0 (0.0%) | 0 (0.0%) |
| Total | 1,494 (57.4%) | 3 (0.2%) |
Employment Status by Educational Attainment in Moss Beach
According to labor force statistics for Moss Beach, 79.0% of individuals (1,127) out of the total population between 25 and 64 years of age (1,427) are in the labor force, with 0.3% or 3 of them being unemployed. The group with the highest labor force participation rate are those with the educational attainment of less than high school, with 95.7% or 242 individuals in the labor force. Within the labor force, individuals with college / associate degree education have the highest percentage of unemployment, with 1.6% or 3 of them being unemployed.
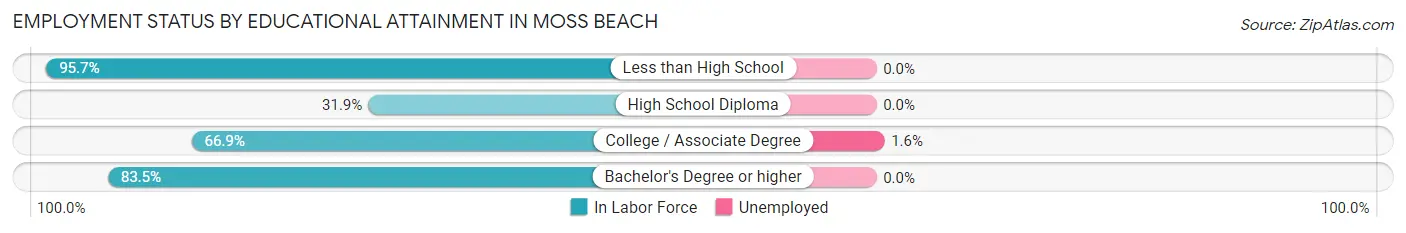
| Educational Attainment | In Labor Force | Unemployed |
| Less than High School | 242 (95.7%) | 0 (0.0%) |
| High School Diploma | 30 (31.9%) | 0 (0.0%) |
| College / Associate Degree | 190 (66.9%) | 5 (1.6%) |
| Bachelor's Degree or higher | 665 (83.5%) | 0 (0.0%) |
| Total | 1,127 (79.0%) | 4 (0.3%) |
Employment Occupations by Sex in Moss Beach
Management, Business, Science and Arts Occupations
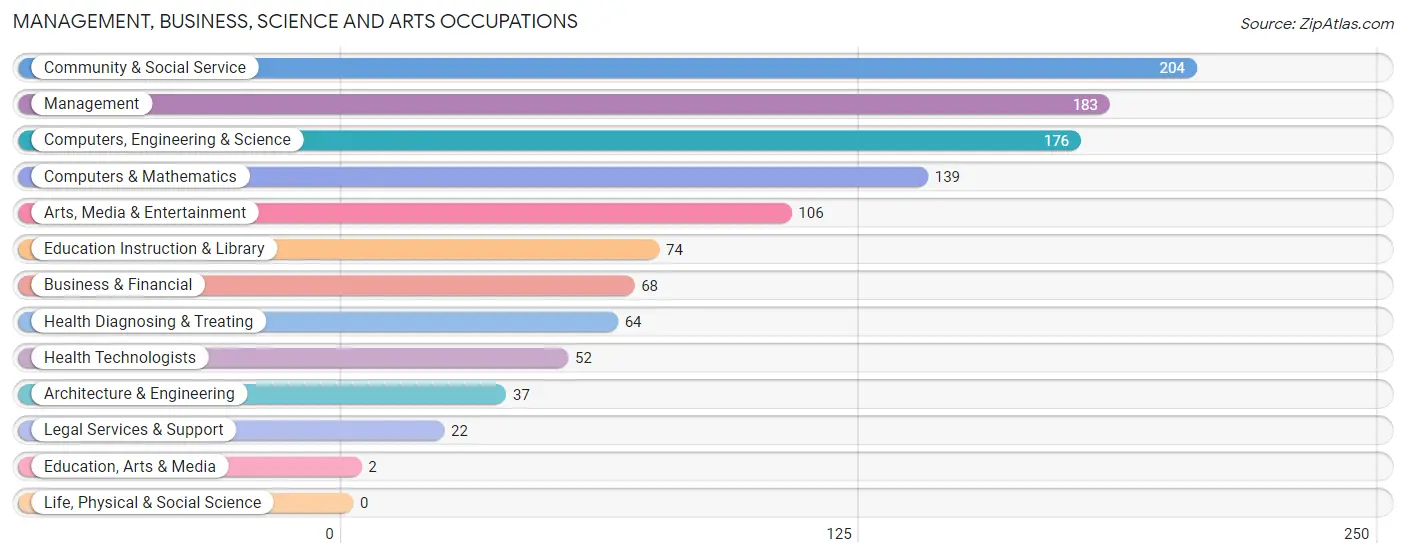
The most common Management, Business, Science and Arts occupations in Moss Beach are Community & Social Service (204 | 13.7%), Management (183 | 12.3%), Computers, Engineering & Science (176 | 11.8%), Computers & Mathematics (139 | 9.3%), and Arts, Media & Entertainment (106 | 7.1%).
Management, Business, Science and Arts Occupations by Sex
Within the Management, Business, Science and Arts occupations in Moss Beach, the most male-oriented occupations are Business & Financial (100.0%), Education, Arts & Media (100.0%), and Computers & Mathematics (82.7%), while the most female-oriented occupations are Legal Services & Support (100.0%), Education Instruction & Library (100.0%), and Community & Social Service (64.7%).
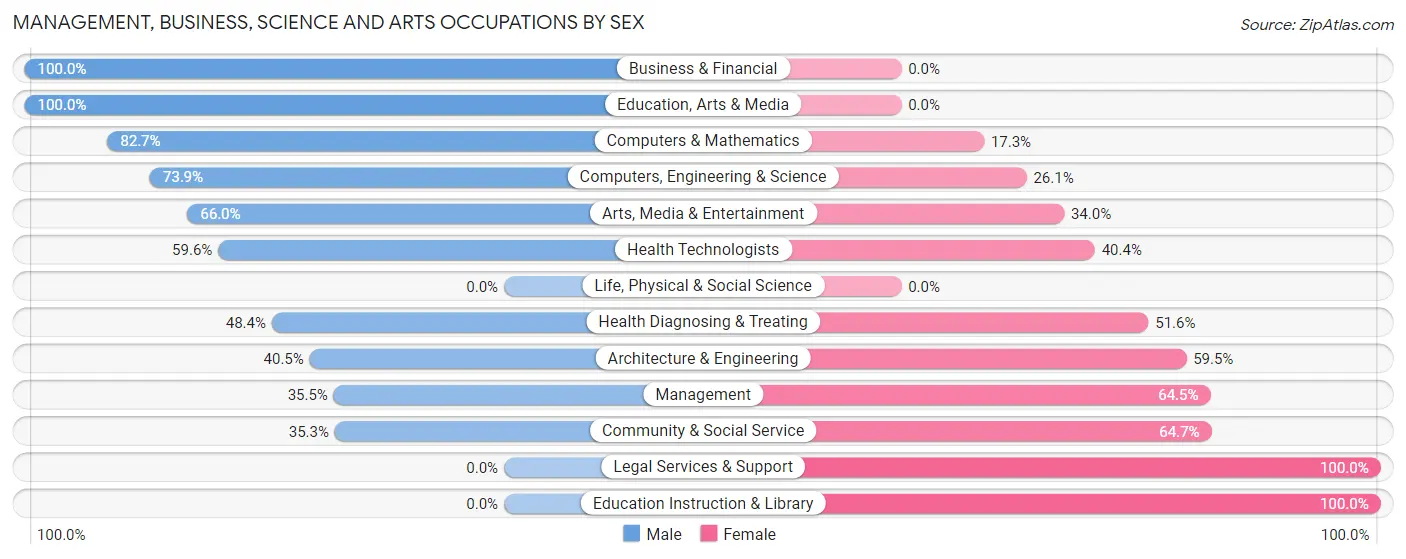
| Occupation | Male | Female |
| Management | 65 (35.5%) | 118 (64.5%) |
| Business & Financial | 68 (100.0%) | 0 (0.0%) |
| Computers, Engineering & Science | 130 (73.9%) | 46 (26.1%) |
| Computers & Mathematics | 115 (82.7%) | 24 (17.3%) |
| Architecture & Engineering | 15 (40.5%) | 22 (59.5%) |
| Life, Physical & Social Science | 0 (0.0%) | 0 (0.0%) |
| Community & Social Service | 72 (35.3%) | 132 (64.7%) |
| Education, Arts & Media | 2 (100.0%) | 0 (0.0%) |
| Legal Services & Support | 0 (0.0%) | 22 (100.0%) |
| Education Instruction & Library | 0 (0.0%) | 74 (100.0%) |
| Arts, Media & Entertainment | 70 (66.0%) | 36 (34.0%) |
| Health Diagnosing & Treating | 31 (48.4%) | 33 (51.6%) |
| Health Technologists | 31 (59.6%) | 21 (40.4%) |
| Total (Category) | 366 (52.7%) | 329 (47.3%) |
| Total (Overall) | 721 (48.4%) | 770 (51.6%) |
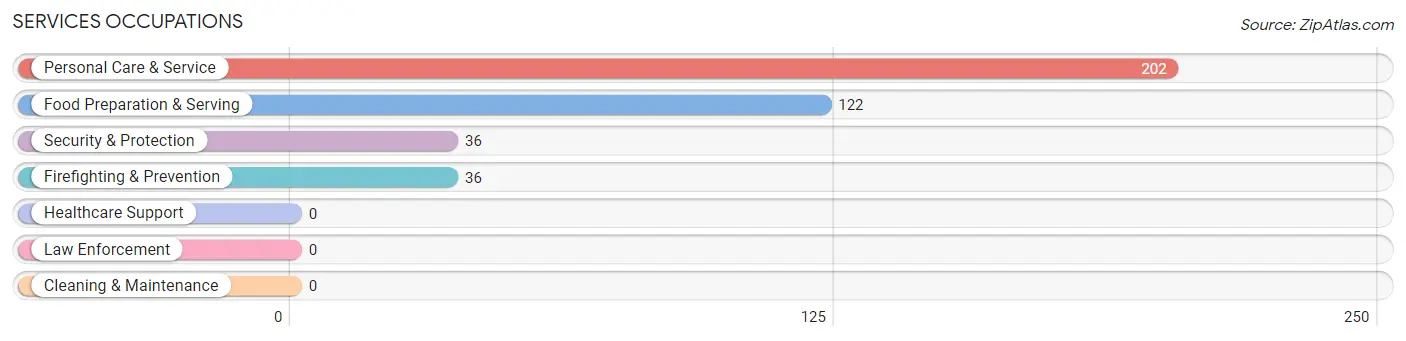
Services Occupations
The most common Services occupations in Moss Beach are Personal Care & Service (202 | 13.6%), Food Preparation & Serving (122 | 8.2%), Security & Protection (36 | 2.4%), and Firefighting & Prevention (36 | 2.4%).
Services Occupations by Sex
Within the Services occupations in Moss Beach, the most male-oriented occupations are Security & Protection (100.0%), Firefighting & Prevention (100.0%), and Personal Care & Service (24.3%), while the most female-oriented occupations are Food Preparation & Serving (100.0%), and Personal Care & Service (75.7%).
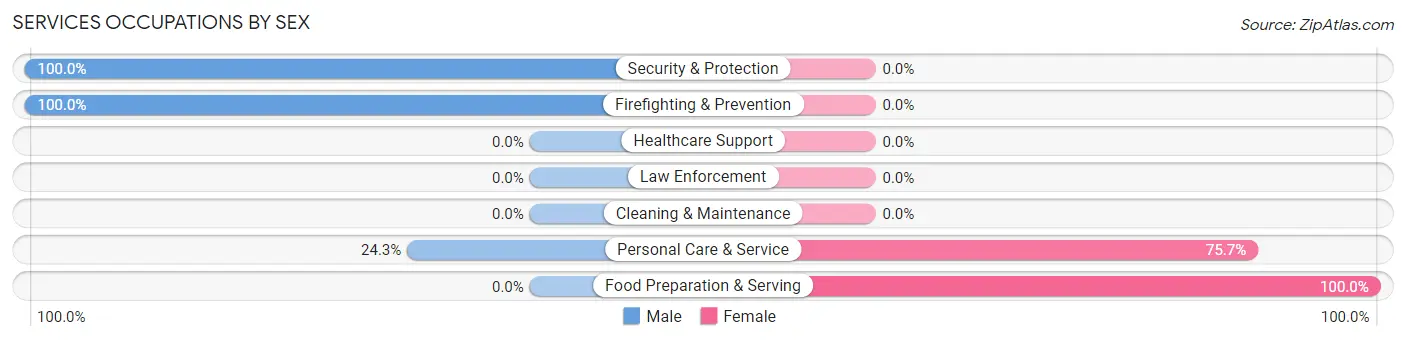
| Occupation | Male | Female |
| Healthcare Support | 0 (0.0%) | 0 (0.0%) |
| Security & Protection | 36 (100.0%) | 0 (0.0%) |
| Firefighting & Prevention | 36 (100.0%) | 0 (0.0%) |
| Law Enforcement | 0 (0.0%) | 0 (0.0%) |
| Food Preparation & Serving | 0 (0.0%) | 122 (100.0%) |
| Cleaning & Maintenance | 0 (0.0%) | 0 (0.0%) |
| Personal Care & Service | 49 (24.3%) | 153 (75.7%) |
| Total (Category) | 85 (23.6%) | 275 (76.4%) |
| Total (Overall) | 721 (48.4%) | 770 (51.6%) |
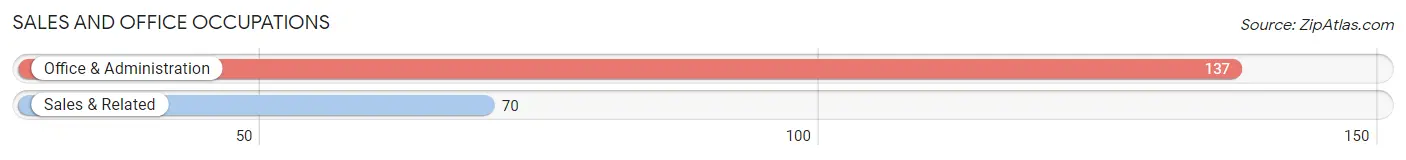
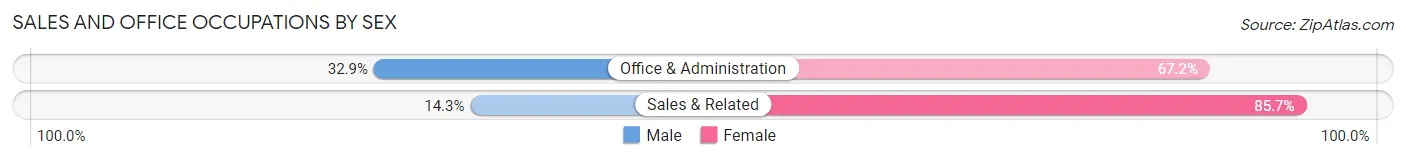
Sales and Office Occupations
The most common Sales and Office occupations in Moss Beach are Office & Administration (137 | 9.2%), and Sales & Related (70 | 4.7%).
Sales and Office Occupations by Sex
| Occupation | Male | Female |
| Sales & Related | 10 (14.3%) | 60 (85.7%) |
| Office & Administration | 45 (32.9%) | 92 (67.1%) |
| Total (Category) | 55 (26.6%) | 152 (73.4%) |
| Total (Overall) | 721 (48.4%) | 770 (51.6%) |
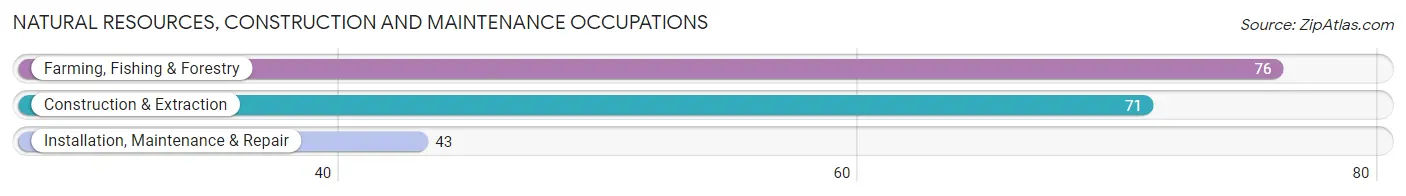
Natural Resources, Construction and Maintenance Occupations
The most common Natural Resources, Construction and Maintenance occupations in Moss Beach are Farming, Fishing & Forestry (76 | 5.1%), Construction & Extraction (71 | 4.8%), and Installation, Maintenance & Repair (43 | 2.9%).
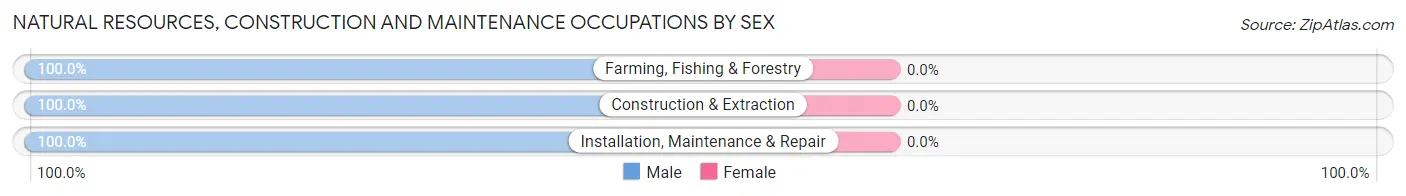
Natural Resources, Construction and Maintenance Occupations by Sex
| Occupation | Male | Female |
| Farming, Fishing & Forestry | 76 (100.0%) | 0 (0.0%) |
| Construction & Extraction | 71 (100.0%) | 0 (0.0%) |
| Installation, Maintenance & Repair | 43 (100.0%) | 0 (0.0%) |
| Total (Category) | 190 (100.0%) | 0 (0.0%) |
| Total (Overall) | 721 (48.4%) | 770 (51.6%) |
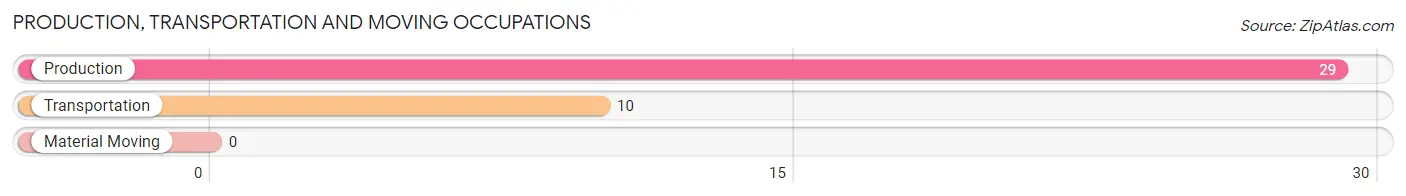
Production, Transportation and Moving Occupations
The most common Production, Transportation and Moving occupations in Moss Beach are Production (29 | 1.9%), and Transportation (10 | 0.7%).
Production, Transportation and Moving Occupations by Sex
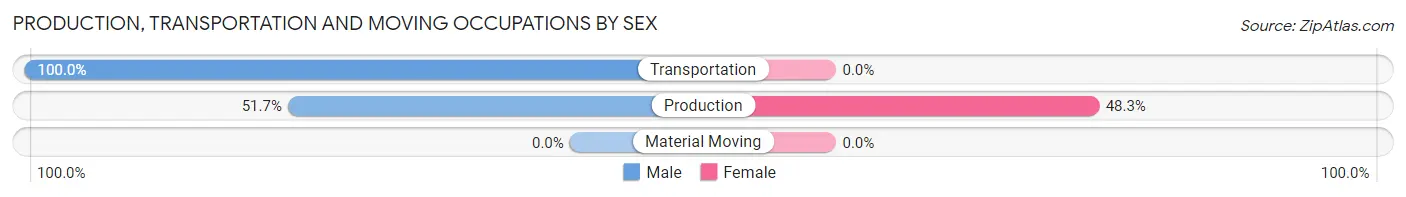
| Occupation | Male | Female |
| Production | 15 (51.7%) | 14 (48.3%) |
| Transportation | 10 (100.0%) | 0 (0.0%) |
| Material Moving | 0 (0.0%) | 0 (0.0%) |
| Total (Category) | 25 (64.1%) | 14 (35.9%) |
| Total (Overall) | 721 (48.4%) | 770 (51.6%) |
Employment Industries by Sex in Moss Beach
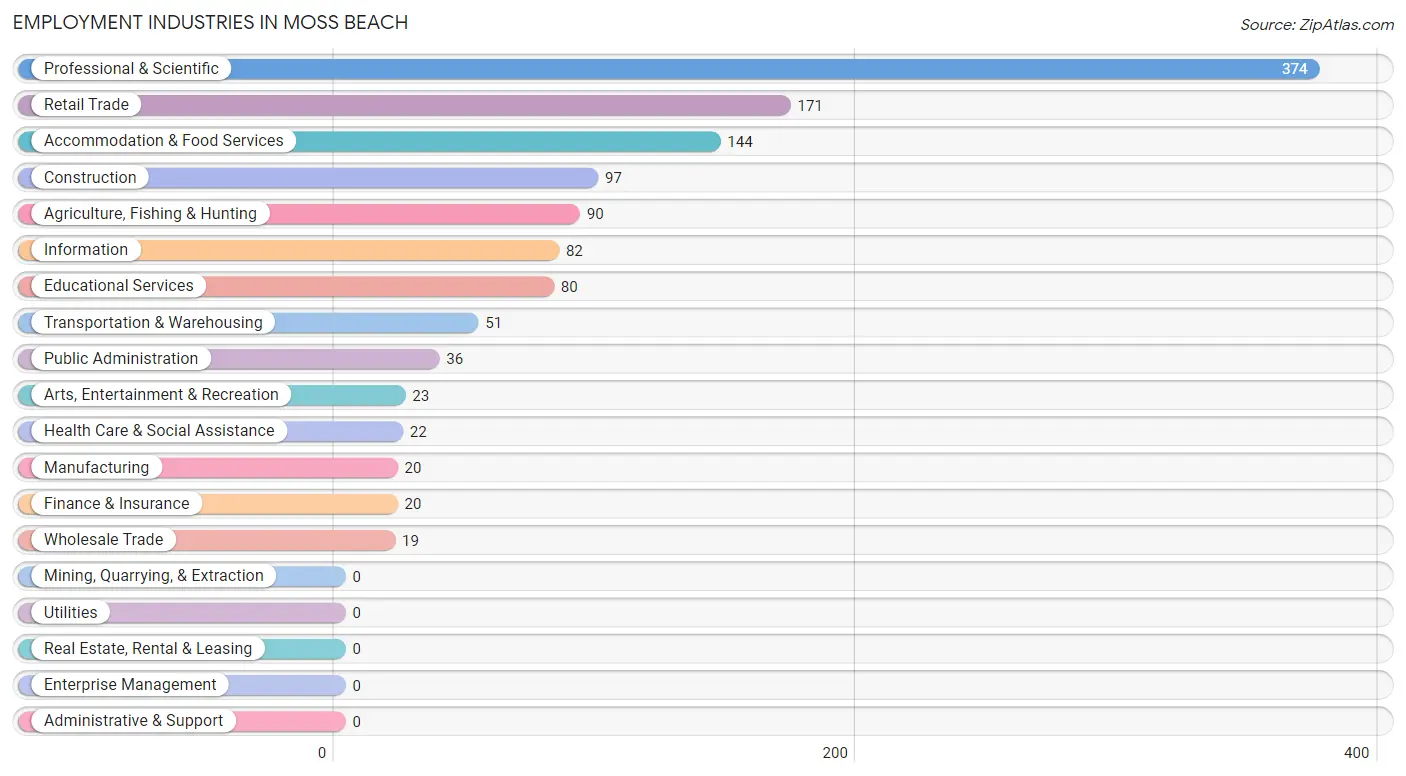
Employment Industries in Moss Beach
The major employment industries in Moss Beach include Professional & Scientific (374 | 25.1%), Retail Trade (171 | 11.5%), Accommodation & Food Services (144 | 9.7%), Construction (97 | 6.5%), and Agriculture, Fishing & Hunting (90 | 6.0%).
Employment Industries by Sex in Moss Beach
The Moss Beach industries that see more men than women are Construction (100.0%), Manufacturing (100.0%), and Wholesale Trade (100.0%), whereas the industries that tend to have a higher number of women are Information (100.0%), Finance & Insurance (100.0%), and Educational Services (100.0%).
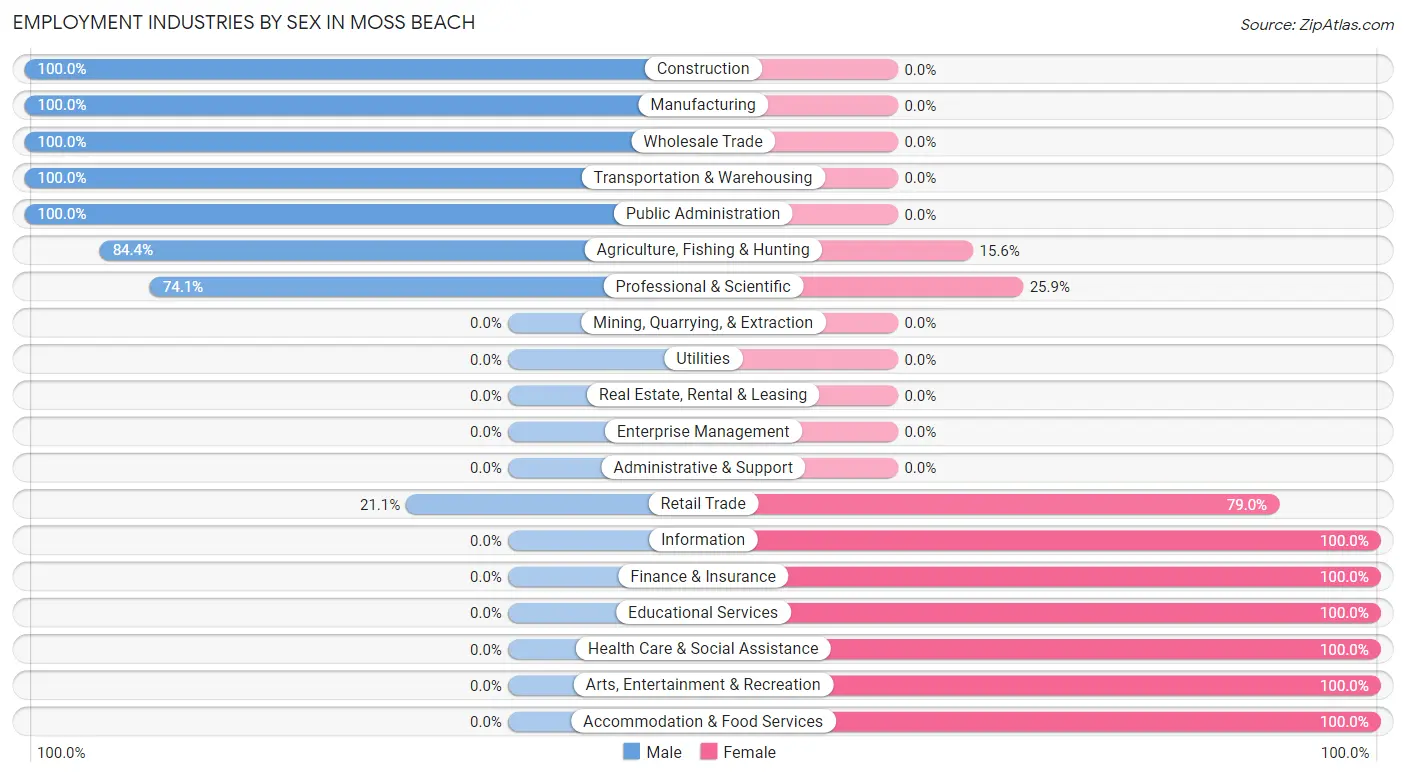
| Industry | Male | Female |
| Agriculture, Fishing & Hunting | 76 (84.4%) | 14 (15.6%) |
| Mining, Quarrying, & Extraction | 0 (0.0%) | 0 (0.0%) |
| Construction | 97 (100.0%) | 0 (0.0%) |
| Manufacturing | 20 (100.0%) | 0 (0.0%) |
| Wholesale Trade | 19 (100.0%) | 0 (0.0%) |
| Retail Trade | 36 (21.0%) | 135 (78.9%) |
| Transportation & Warehousing | 51 (100.0%) | 0 (0.0%) |
| Utilities | 0 (0.0%) | 0 (0.0%) |
| Information | 0 (0.0%) | 82 (100.0%) |
| Finance & Insurance | 0 (0.0%) | 20 (100.0%) |
| Real Estate, Rental & Leasing | 0 (0.0%) | 0 (0.0%) |
| Professional & Scientific | 277 (74.1%) | 97 (25.9%) |
| Enterprise Management | 0 (0.0%) | 0 (0.0%) |
| Administrative & Support | 0 (0.0%) | 0 (0.0%) |
| Educational Services | 0 (0.0%) | 80 (100.0%) |
| Health Care & Social Assistance | 0 (0.0%) | 22 (100.0%) |
| Arts, Entertainment & Recreation | 0 (0.0%) | 23 (100.0%) |
| Accommodation & Food Services | 0 (0.0%) | 144 (100.0%) |
| Public Administration | 36 (100.0%) | 0 (0.0%) |
| Total | 721 (48.4%) | 770 (51.6%) |
Education in Moss Beach
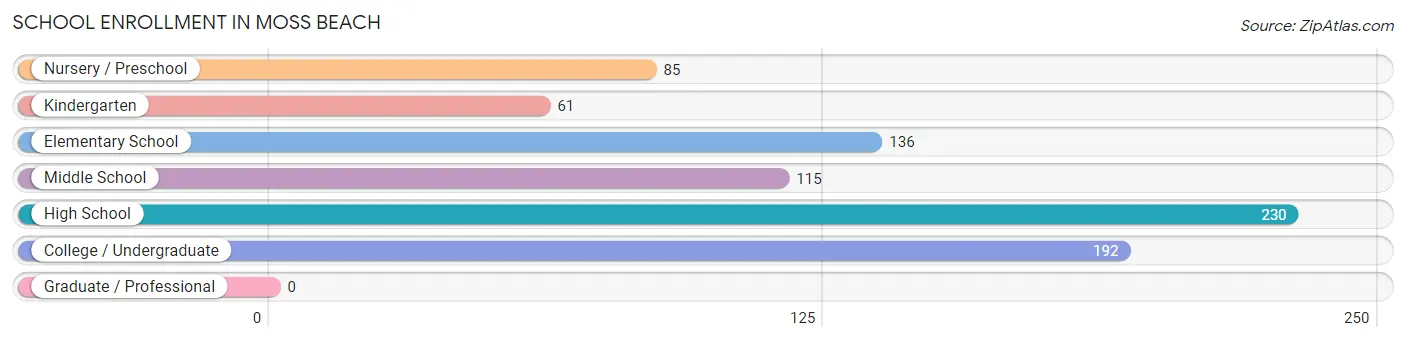
School Enrollment in Moss Beach
The most common levels of schooling among the 819 students in Moss Beach are high school (230 | 28.1%), college / undergraduate (192 | 23.4%), and elementary school (136 | 16.6%).
| School Level | # Students | % Students |
| Nursery / Preschool | 85 | 10.4% |
| Kindergarten | 61 | 7.4% |
| Elementary School | 136 | 16.6% |
| Middle School | 115 | 14.0% |
| High School | 230 | 28.1% |
| College / Undergraduate | 192 | 23.4% |
| Graduate / Professional | 0 | 0.0% |
| Total | 819 | 100.0% |
School Enrollment by Age by Funding Source in Moss Beach
Out of a total of 819 students who are enrolled in schools in Moss Beach, 142 (17.3%) attend a private institution, while the remaining 677 (82.7%) are enrolled in public schools. The age group of 5 to 9 year old has the highest likelihood of being enrolled in private schools, with 74 (56.5% in the age bracket) enrolled. Conversely, the age group of 3 to 4 year olds has the lowest likelihood of being enrolled in a private school, with 109 (100.0% in the age bracket) attending a public institution.
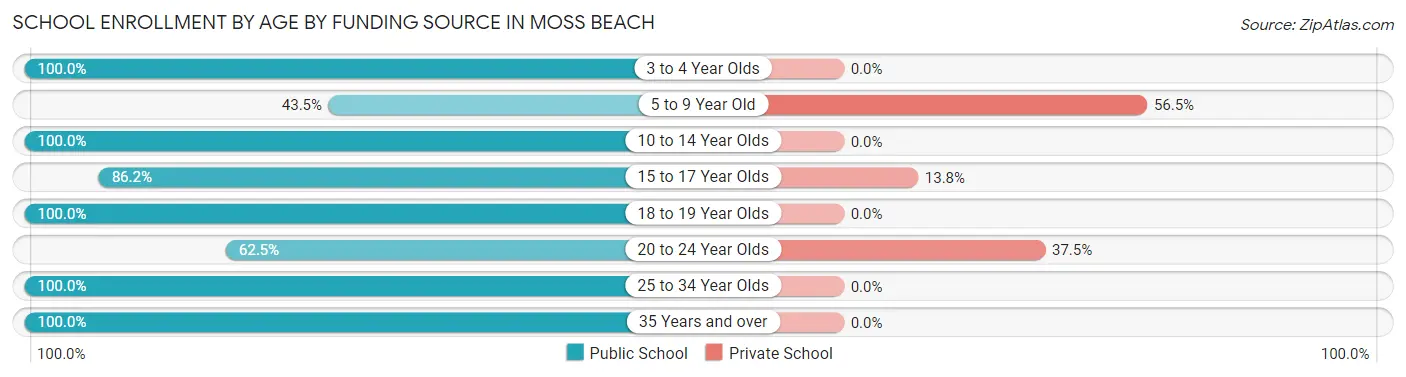
| Age Bracket | Public School | Private School |
| 3 to 4 Year Olds | 109 (100.0%) | 0 (0.0%) |
| 5 to 9 Year Old | 57 (43.5%) | 74 (56.5%) |
| 10 to 14 Year Olds | 157 (100.0%) | 0 (0.0%) |
| 15 to 17 Year Olds | 237 (86.2%) | 38 (13.8%) |
| 18 to 19 Year Olds | 37 (100.0%) | 0 (0.0%) |
| 20 to 24 Year Olds | 50 (62.5%) | 30 (37.5%) |
| 25 to 34 Year Olds | 17 (100.0%) | 0 (0.0%) |
| 35 Years and over | 13 (100.0%) | 0 (0.0%) |
| Total | 677 (82.7%) | 142 (17.3%) |
Educational Attainment by Field of Study in Moss Beach
Engineering (249 | 19.4%), visual & performing arts (198 | 15.5%), business (174 | 13.6%), literature & languages (126 | 9.8%), and arts & humanities (103 | 8.0%) are the most common fields of study among 1,281 individuals in Moss Beach who have obtained a bachelor's degree or higher.
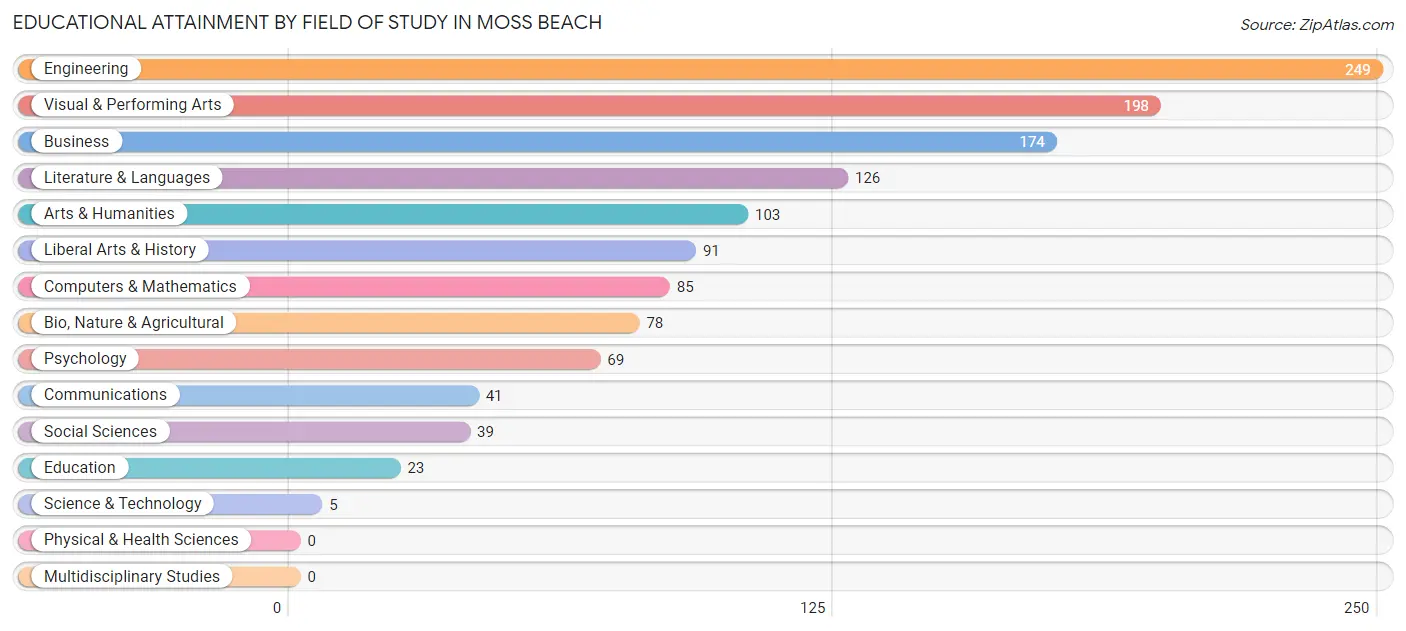
| Field of Study | # Graduates | % Graduates |
| Computers & Mathematics | 85 | 6.6% |
| Bio, Nature & Agricultural | 78 | 6.1% |
| Physical & Health Sciences | 0 | 0.0% |
| Psychology | 69 | 5.4% |
| Social Sciences | 39 | 3.0% |
| Engineering | 249 | 19.4% |
| Multidisciplinary Studies | 0 | 0.0% |
| Science & Technology | 5 | 0.4% |
| Business | 174 | 13.6% |
| Education | 23 | 1.8% |
| Literature & Languages | 126 | 9.8% |
| Liberal Arts & History | 91 | 7.1% |
| Visual & Performing Arts | 198 | 15.5% |
| Communications | 41 | 3.2% |
| Arts & Humanities | 103 | 8.0% |
| Total | 1,281 | 100.0% |
Transportation & Commute in Moss Beach
Vehicle Availability by Sex in Moss Beach
The most prevalent vehicle ownership categories in Moss Beach are males with 3 vehicles (204, accounting for 28.5%) and females with 3 vehicles (145, making up 26.5%).
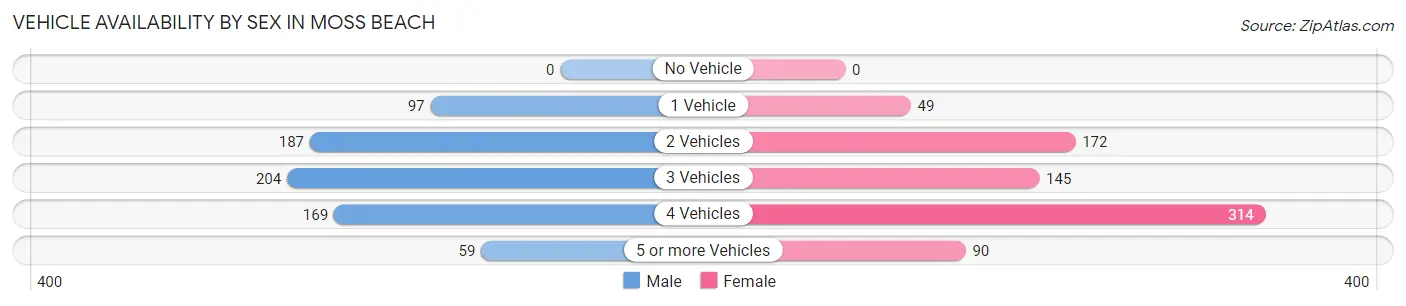
| Vehicles Available | Male | Female |
| No Vehicle | 0 (0.0%) | 0 (0.0%) |
| 1 Vehicle | 97 (13.6%) | 49 (6.4%) |
| 2 Vehicles | 187 (26.1%) | 172 (22.3%) |
| 3 Vehicles | 204 (28.5%) | 145 (18.8%) |
| 4 Vehicles | 169 (23.6%) | 314 (40.8%) |
| 5 or more Vehicles | 59 (8.2%) | 90 (11.7%) |
| Total | 716 (100.0%) | 770 (100.0%) |
Commute Time in Moss Beach
The most frequently occuring commute durations in Moss Beach are 15 to 19 minutes (241 commuters, 20.6%), 45 to 59 minutes (231 commuters, 19.8%), and 5 to 9 minutes (148 commuters, 12.7%).
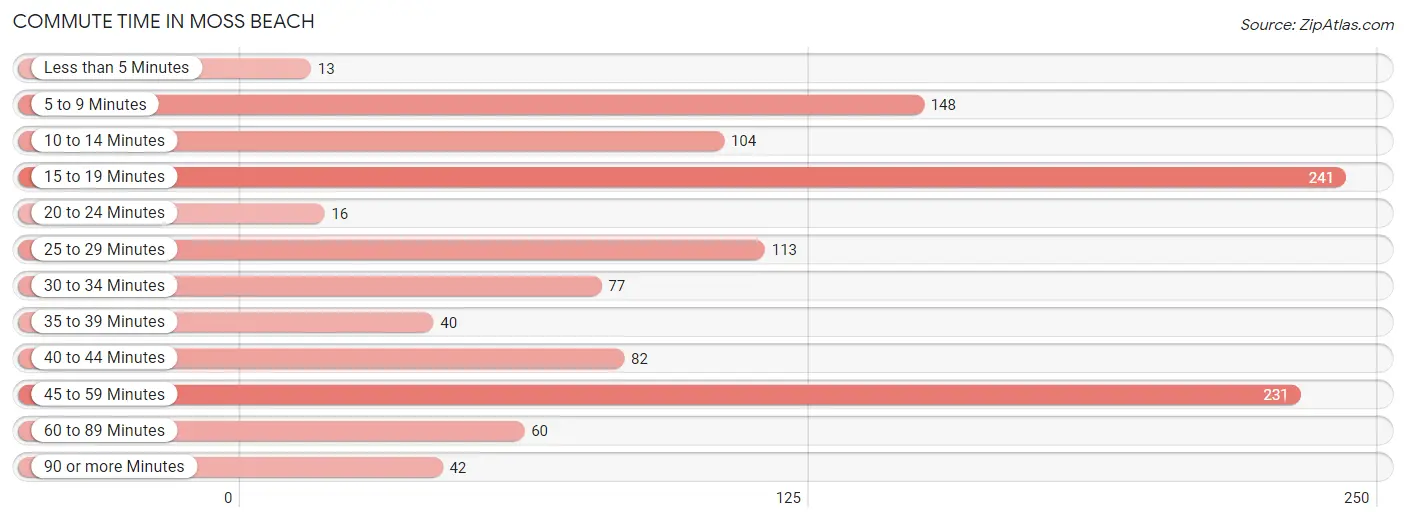
| Commute Time | # Commuters | % Commuters |
| Less than 5 Minutes | 13 | 1.1% |
| 5 to 9 Minutes | 148 | 12.7% |
| 10 to 14 Minutes | 104 | 8.9% |
| 15 to 19 Minutes | 241 | 20.6% |
| 20 to 24 Minutes | 16 | 1.4% |
| 25 to 29 Minutes | 113 | 9.7% |
| 30 to 34 Minutes | 77 | 6.6% |
| 35 to 39 Minutes | 40 | 3.4% |
| 40 to 44 Minutes | 82 | 7.0% |
| 45 to 59 Minutes | 231 | 19.8% |
| 60 to 89 Minutes | 60 | 5.1% |
| 90 or more Minutes | 42 | 3.6% |
Commute Time by Sex in Moss Beach
The most common commute times in Moss Beach are 45 to 59 minutes (151 commuters, 30.4%) for males and 15 to 19 minutes (201 commuters, 30.0%) for females.
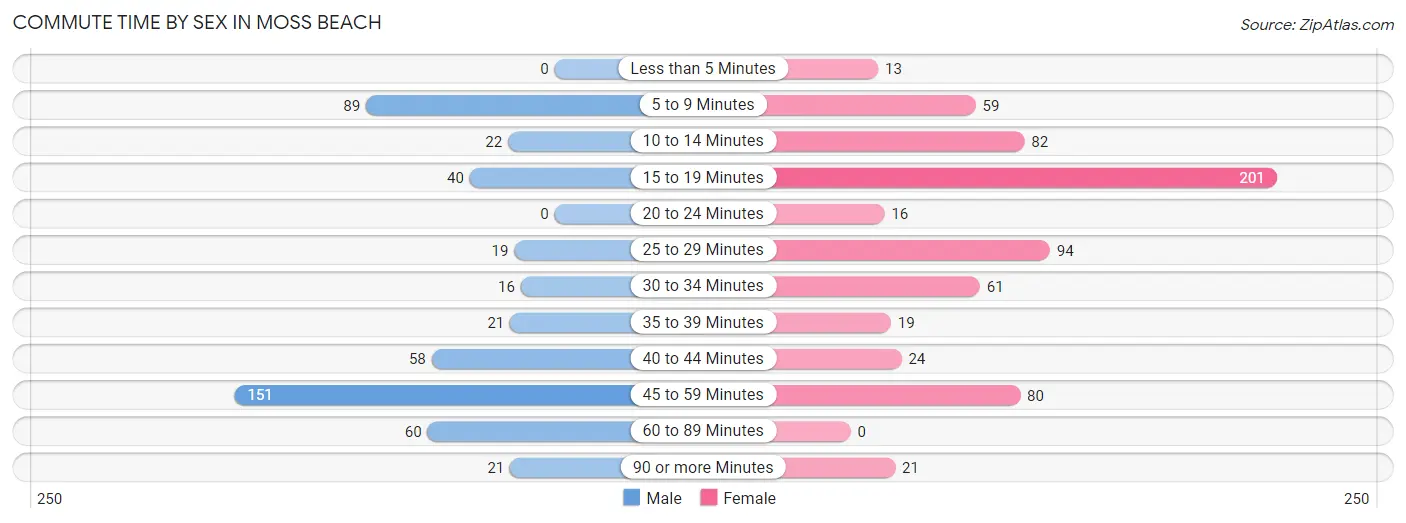
| Commute Time | Male | Female |
| Less than 5 Minutes | 0 (0.0%) | 13 (1.9%) |
| 5 to 9 Minutes | 89 (17.9%) | 59 (8.8%) |
| 10 to 14 Minutes | 22 (4.4%) | 82 (12.2%) |
| 15 to 19 Minutes | 40 (8.1%) | 201 (30.0%) |
| 20 to 24 Minutes | 0 (0.0%) | 16 (2.4%) |
| 25 to 29 Minutes | 19 (3.8%) | 94 (14.0%) |
| 30 to 34 Minutes | 16 (3.2%) | 61 (9.1%) |
| 35 to 39 Minutes | 21 (4.2%) | 19 (2.8%) |
| 40 to 44 Minutes | 58 (11.7%) | 24 (3.6%) |
| 45 to 59 Minutes | 151 (30.4%) | 80 (11.9%) |
| 60 to 89 Minutes | 60 (12.1%) | 0 (0.0%) |
| 90 or more Minutes | 21 (4.2%) | 21 (3.1%) |
Time of Departure to Work by Sex in Moss Beach
The most frequent times of departure to work in Moss Beach are 9:00 AM to 9:59 AM (134, 27.0%) for males and 8:30 AM to 8:59 AM (113, 16.9%) for females.
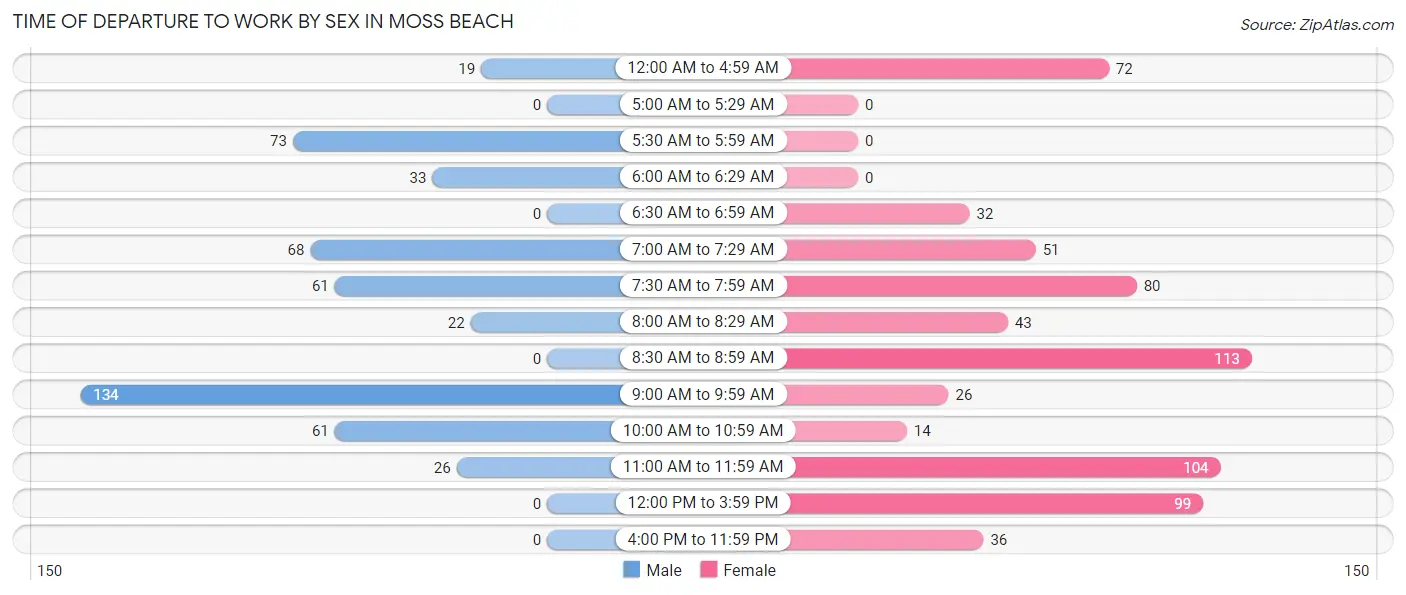
| Time of Departure | Male | Female |
| 12:00 AM to 4:59 AM | 19 (3.8%) | 72 (10.7%) |
| 5:00 AM to 5:29 AM | 0 (0.0%) | 0 (0.0%) |
| 5:30 AM to 5:59 AM | 73 (14.7%) | 0 (0.0%) |
| 6:00 AM to 6:29 AM | 33 (6.6%) | 0 (0.0%) |
| 6:30 AM to 6:59 AM | 0 (0.0%) | 32 (4.8%) |
| 7:00 AM to 7:29 AM | 68 (13.7%) | 51 (7.6%) |
| 7:30 AM to 7:59 AM | 61 (12.3%) | 80 (11.9%) |
| 8:00 AM to 8:29 AM | 22 (4.4%) | 43 (6.4%) |
| 8:30 AM to 8:59 AM | 0 (0.0%) | 113 (16.9%) |
| 9:00 AM to 9:59 AM | 134 (27.0%) | 26 (3.9%) |
| 10:00 AM to 10:59 AM | 61 (12.3%) | 14 (2.1%) |
| 11:00 AM to 11:59 AM | 26 (5.2%) | 104 (15.5%) |
| 12:00 PM to 3:59 PM | 0 (0.0%) | 99 (14.8%) |
| 4:00 PM to 11:59 PM | 0 (0.0%) | 36 (5.4%) |
| Total | 497 (100.0%) | 670 (100.0%) |
Housing Occupancy in Moss Beach
Occupancy by Ownership in Moss Beach
Of the total 1,087 dwellings in Moss Beach, owner-occupied units account for 1,016 (93.5%), while renter-occupied units make up 71 (6.5%).
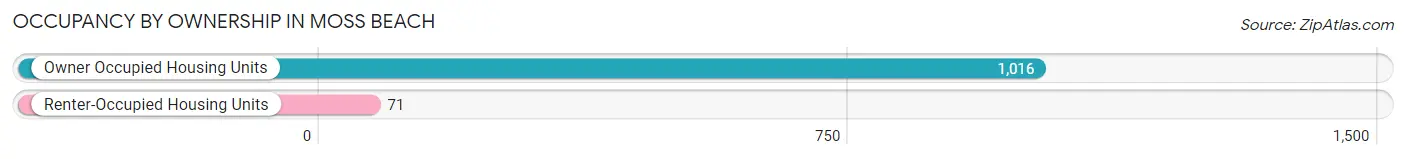
| Occupancy | # Housing Units | % Housing Units |
| Owner Occupied Housing Units | 1,016 | 93.5% |
| Renter-Occupied Housing Units | 71 | 6.5% |
| Total Occupied Housing Units | 1,087 | 100.0% |
Occupancy by Household Size in Moss Beach
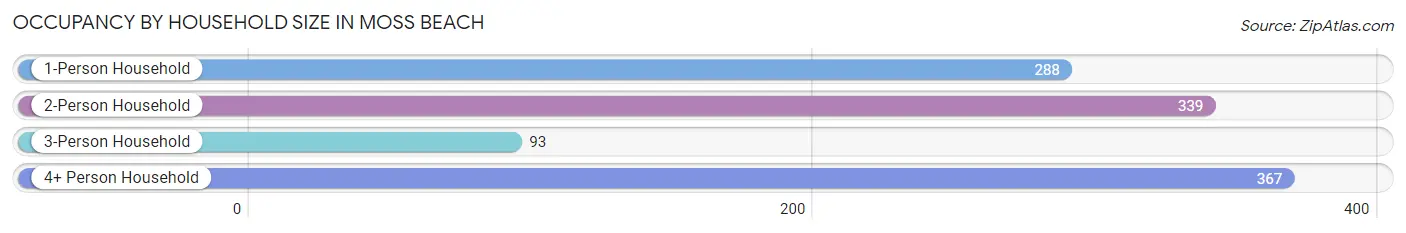
| Household Size | # Housing Units | % Housing Units |
| 1-Person Household | 288 | 26.5% |
| 2-Person Household | 339 | 31.2% |
| 3-Person Household | 93 | 8.6% |
| 4+ Person Household | 367 | 33.8% |
| Total Housing Units | 1,087 | 100.0% |
Occupancy by Ownership by Household Size in Moss Beach
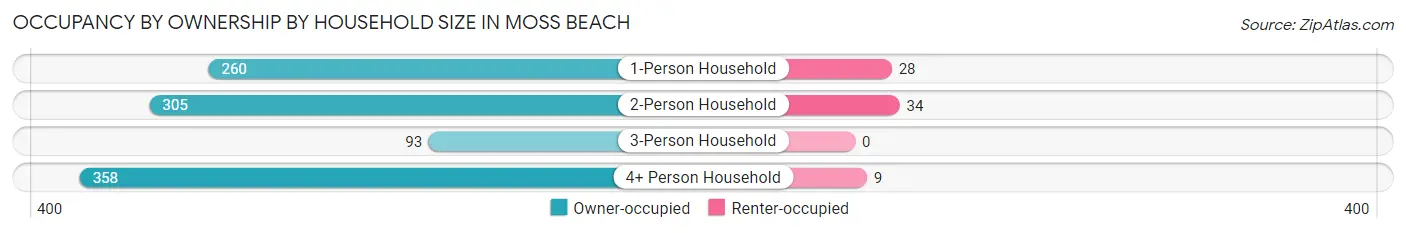
| Household Size | Owner-occupied | Renter-occupied |
| 1-Person Household | 260 (90.3%) | 28 (9.7%) |
| 2-Person Household | 305 (90.0%) | 34 (10.0%) |
| 3-Person Household | 93 (100.0%) | 0 (0.0%) |
| 4+ Person Household | 358 (97.6%) | 9 (2.5%) |
| Total Housing Units | 1,016 (93.5%) | 71 (6.5%) |
Occupancy by Educational Attainment in Moss Beach
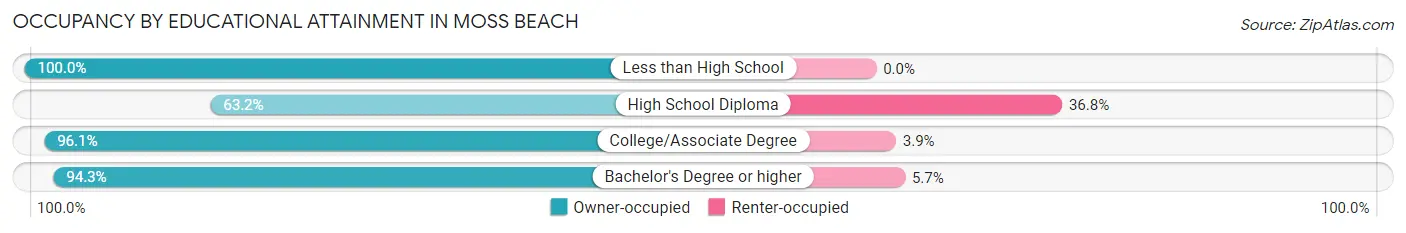
| Household Size | Owner-occupied | Renter-occupied |
| Less than High School | 185 (100.0%) | 0 (0.0%) |
| High School Diploma | 48 (63.2%) | 28 (36.8%) |
| College/Associate Degree | 222 (96.1%) | 9 (3.9%) |
| Bachelor's Degree or higher | 561 (94.3%) | 34 (5.7%) |
Occupancy by Age of Householder in Moss Beach
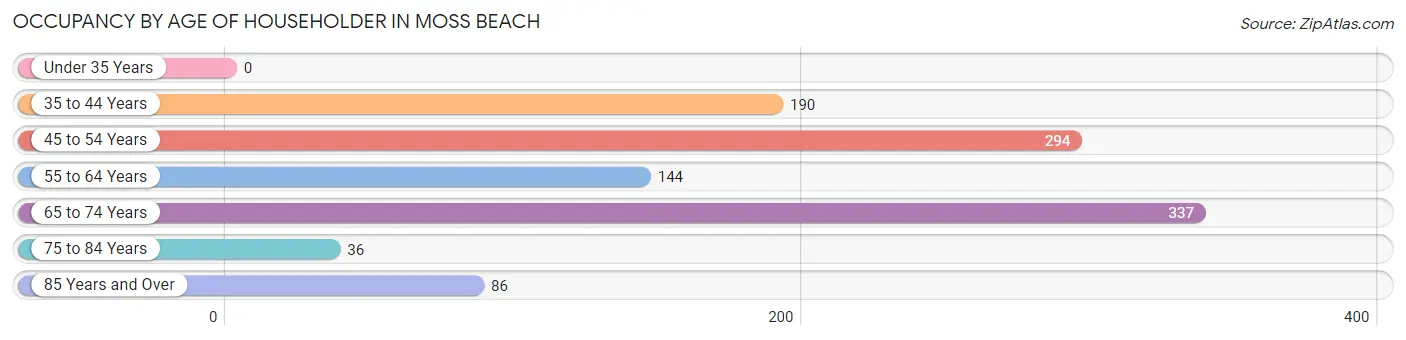
| Age Bracket | # Households | % Households |
| Under 35 Years | 0 | 0.0% |
| 35 to 44 Years | 190 | 17.5% |
| 45 to 54 Years | 294 | 27.1% |
| 55 to 64 Years | 144 | 13.3% |
| 65 to 74 Years | 337 | 31.0% |
| 75 to 84 Years | 36 | 3.3% |
| 85 Years and Over | 86 | 7.9% |
| Total | 1,087 | 100.0% |
Housing Finances in Moss Beach
Median Income by Occupancy in Moss Beach
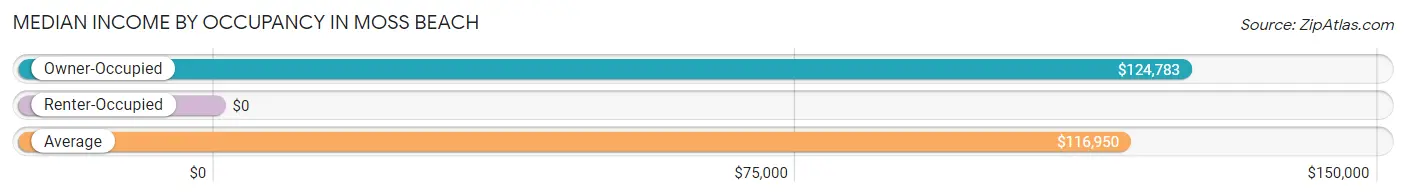
| Occupancy Type | # Households | Median Income |
| Owner-Occupied | 1,016 (93.5%) | $124,783 |
| Renter-Occupied | 71 (6.5%) | $0 |
| Average | 1,087 (100.0%) | $116,950 |
Occupancy by Householder Income Bracket in Moss Beach
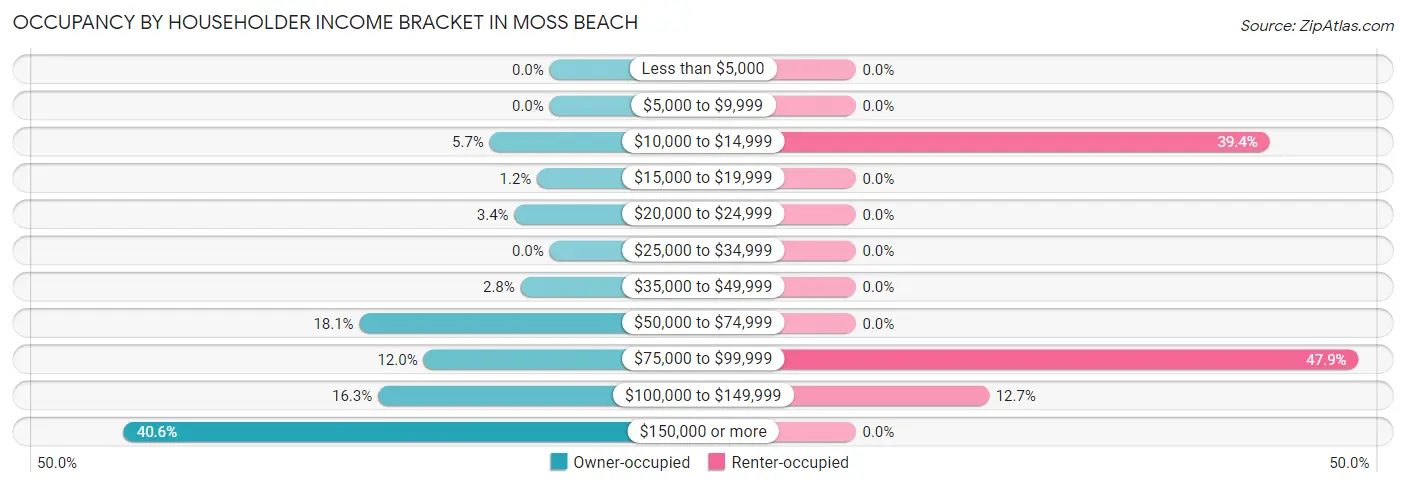
| Income Bracket | Owner-occupied | Renter-occupied |
| Less than $5,000 | 0 (0.0%) | 0 (0.0%) |
| $5,000 to $9,999 | 0 (0.0%) | 0 (0.0%) |
| $10,000 to $14,999 | 58 (5.7%) | 28 (39.4%) |
| $15,000 to $19,999 | 12 (1.2%) | 0 (0.0%) |
| $20,000 to $24,999 | 34 (3.4%) | 0 (0.0%) |
| $25,000 to $34,999 | 0 (0.0%) | 0 (0.0%) |
| $35,000 to $49,999 | 28 (2.8%) | 0 (0.0%) |
| $50,000 to $74,999 | 184 (18.1%) | 0 (0.0%) |
| $75,000 to $99,999 | 122 (12.0%) | 34 (47.9%) |
| $100,000 to $149,999 | 166 (16.3%) | 9 (12.7%) |
| $150,000 or more | 412 (40.6%) | 0 (0.0%) |
| Total | 1,016 (100.0%) | 71 (100.0%) |
Monthly Housing Cost Tiers in Moss Beach
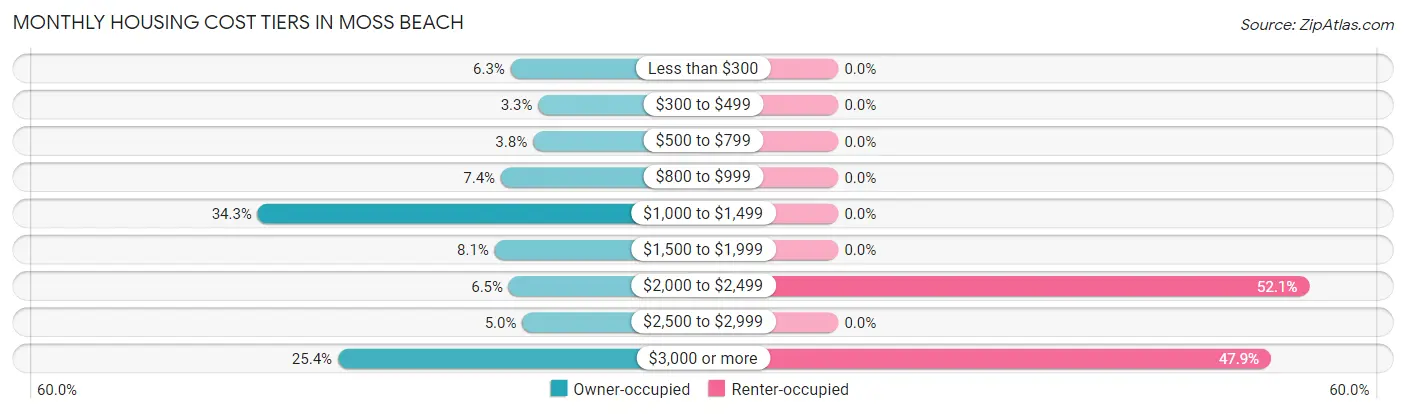
| Monthly Cost | Owner-occupied | Renter-occupied |
| Less than $300 | 64 (6.3%) | 0 (0.0%) |
| $300 to $499 | 33 (3.3%) | 0 (0.0%) |
| $500 to $799 | 39 (3.8%) | 0 (0.0%) |
| $800 to $999 | 75 (7.4%) | 0 (0.0%) |
| $1,000 to $1,499 | 348 (34.3%) | 0 (0.0%) |
| $1,500 to $1,999 | 82 (8.1%) | 0 (0.0%) |
| $2,000 to $2,499 | 66 (6.5%) | 37 (52.1%) |
| $2,500 to $2,999 | 51 (5.0%) | 0 (0.0%) |
| $3,000 or more | 258 (25.4%) | 34 (47.9%) |
| Total | 1,016 (100.0%) | 71 (100.0%) |
Physical Housing Characteristics in Moss Beach
Housing Structures in Moss Beach
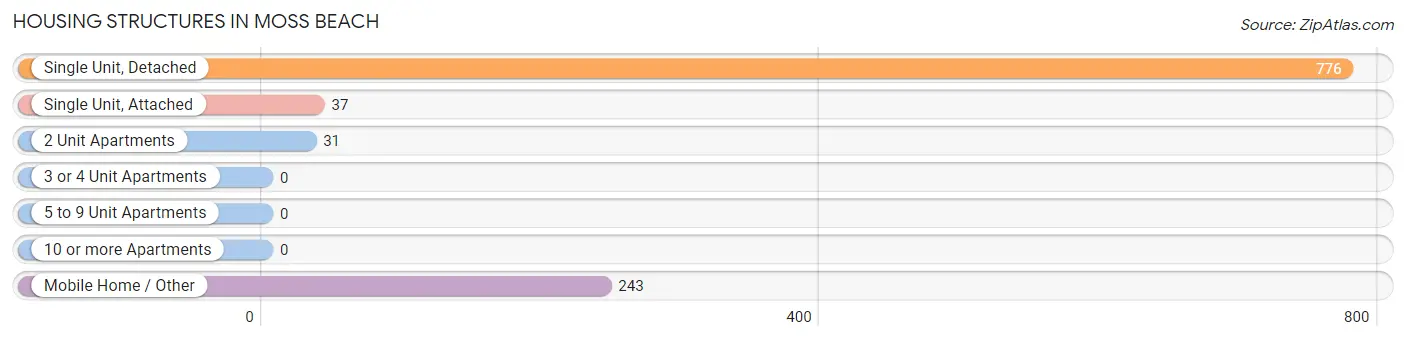
| Structure Type | # Housing Units | % Housing Units |
| Single Unit, Detached | 776 | 71.4% |
| Single Unit, Attached | 37 | 3.4% |
| 2 Unit Apartments | 31 | 2.9% |
| 3 or 4 Unit Apartments | 0 | 0.0% |
| 5 to 9 Unit Apartments | 0 | 0.0% |
| 10 or more Apartments | 0 | 0.0% |
| Mobile Home / Other | 243 | 22.4% |
| Total | 1,087 | 100.0% |
Housing Structures by Occupancy in Moss Beach
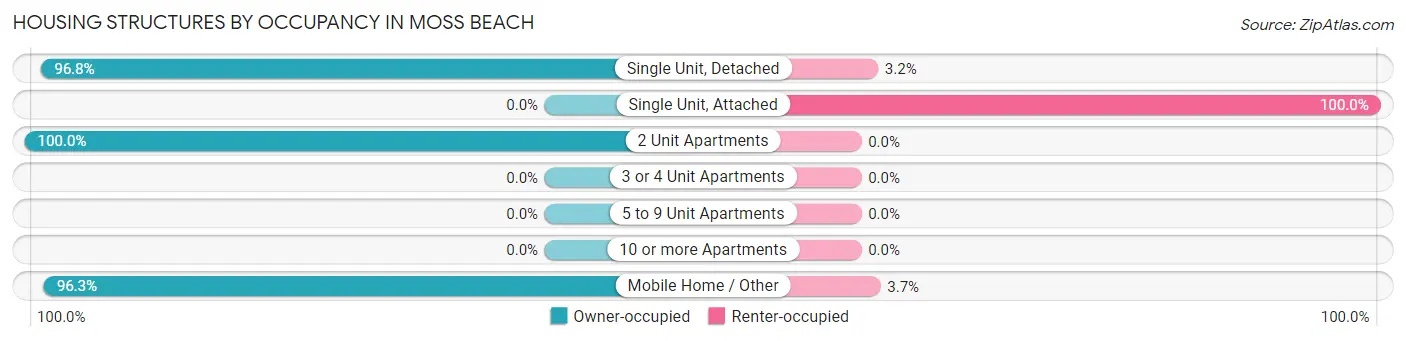
| Structure Type | Owner-occupied | Renter-occupied |
| Single Unit, Detached | 751 (96.8%) | 25 (3.2%) |
| Single Unit, Attached | 0 (0.0%) | 37 (100.0%) |
| 2 Unit Apartments | 31 (100.0%) | 0 (0.0%) |
| 3 or 4 Unit Apartments | 0 (0.0%) | 0 (0.0%) |
| 5 to 9 Unit Apartments | 0 (0.0%) | 0 (0.0%) |
| 10 or more Apartments | 0 (0.0%) | 0 (0.0%) |
| Mobile Home / Other | 234 (96.3%) | 9 (3.7%) |
| Total | 1,016 (93.5%) | 71 (6.5%) |
Housing Structures by Number of Rooms in Moss Beach
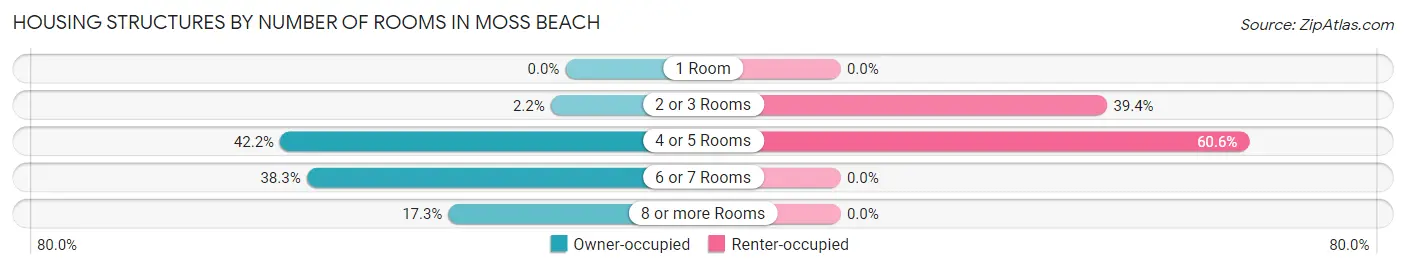
| Number of Rooms | Owner-occupied | Renter-occupied |
| 1 Room | 0 (0.0%) | 0 (0.0%) |
| 2 or 3 Rooms | 22 (2.2%) | 28 (39.4%) |
| 4 or 5 Rooms | 429 (42.2%) | 43 (60.6%) |
| 6 or 7 Rooms | 389 (38.3%) | 0 (0.0%) |
| 8 or more Rooms | 176 (17.3%) | 0 (0.0%) |
| Total | 1,016 (100.0%) | 71 (100.0%) |
Housing Structure by Heating Type in Moss Beach
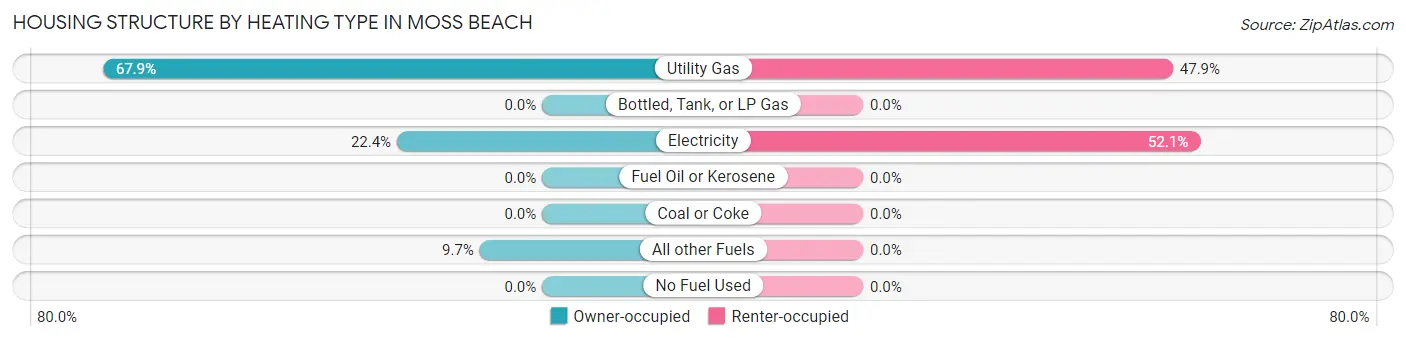
| Heating Type | Owner-occupied | Renter-occupied |
| Utility Gas | 690 (67.9%) | 34 (47.9%) |
| Bottled, Tank, or LP Gas | 0 (0.0%) | 0 (0.0%) |
| Electricity | 228 (22.4%) | 37 (52.1%) |
| Fuel Oil or Kerosene | 0 (0.0%) | 0 (0.0%) |
| Coal or Coke | 0 (0.0%) | 0 (0.0%) |
| All other Fuels | 98 (9.7%) | 0 (0.0%) |
| No Fuel Used | 0 (0.0%) | 0 (0.0%) |
| Total | 1,016 (100.0%) | 71 (100.0%) |
Household Vehicle Usage in Moss Beach
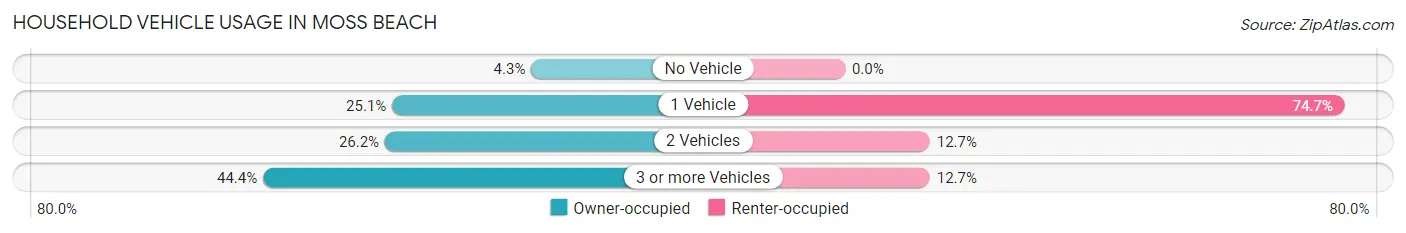
| Vehicles per Household | Owner-occupied | Renter-occupied |
| No Vehicle | 44 (4.3%) | 0 (0.0%) |
| 1 Vehicle | 255 (25.1%) | 53 (74.7%) |
| 2 Vehicles | 266 (26.2%) | 9 (12.7%) |
| 3 or more Vehicles | 451 (44.4%) | 9 (12.7%) |
| Total | 1,016 (100.0%) | 71 (100.0%) |
Real Estate & Mortgages in Moss Beach
Real Estate and Mortgage Overview in Moss Beach
| Characteristic | Without Mortgage | With Mortgage |
| Housing Units | 518 | 498 |
| Median Property Value | - | - |
| Median Household Income | $98,641 | $274 |
| Monthly Housing Costs | $1,223 | $258 |
| Real Estate Taxes | - | - |
Property Value by Mortgage Status in Moss Beach
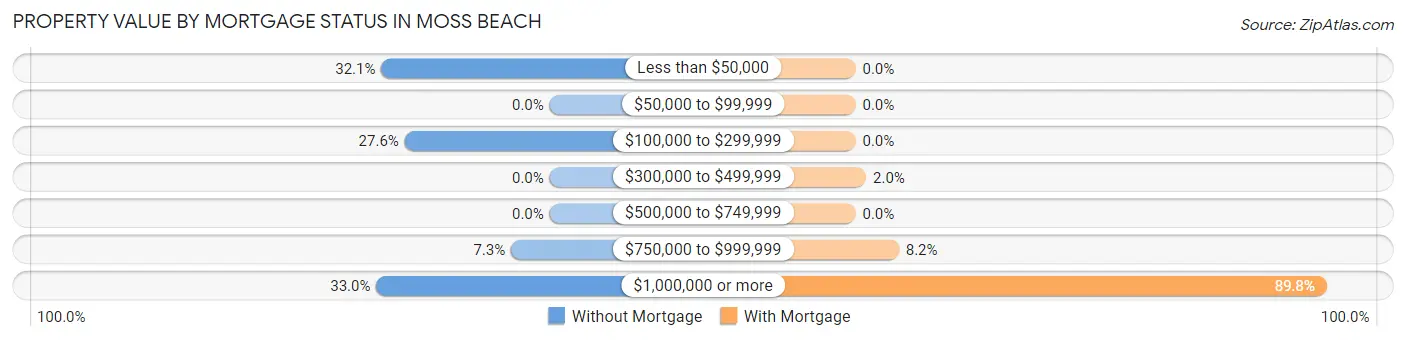
| Property Value | Without Mortgage | With Mortgage |
| Less than $50,000 | 166 (32.1%) | 0 (0.0%) |
| $50,000 to $99,999 | 0 (0.0%) | 0 (0.0%) |
| $100,000 to $299,999 | 143 (27.6%) | 0 (0.0%) |
| $300,000 to $499,999 | 0 (0.0%) | 10 (2.0%) |
| $500,000 to $749,999 | 0 (0.0%) | 0 (0.0%) |
| $750,000 to $999,999 | 38 (7.3%) | 41 (8.2%) |
| $1,000,000 or more | 171 (33.0%) | 447 (89.8%) |
| Total | 518 (100.0%) | 498 (100.0%) |
Household Income by Mortgage Status in Moss Beach
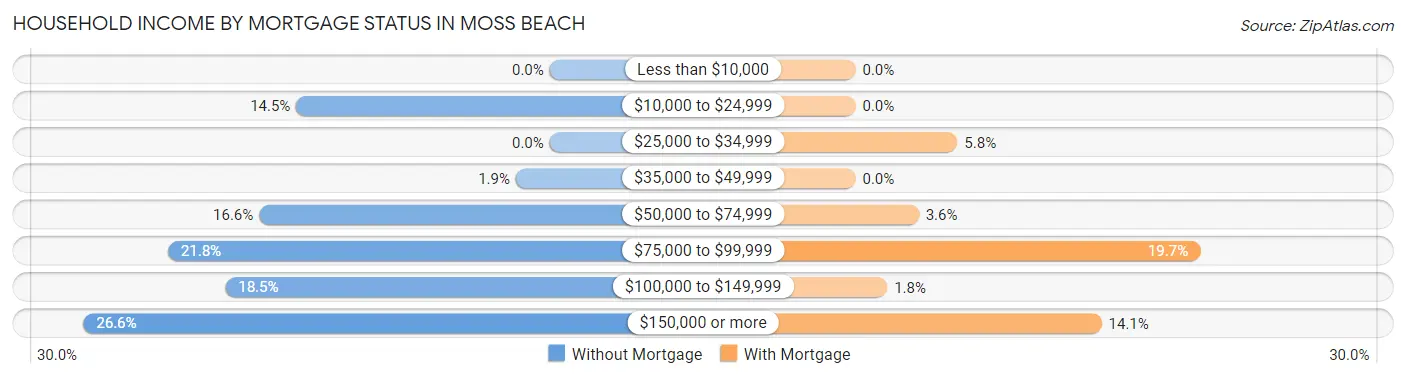
| Household Income | Without Mortgage | With Mortgage |
| Less than $10,000 | 0 (0.0%) | 0 (0.0%) |
| $10,000 to $24,999 | 75 (14.5%) | 0 (0.0%) |
| $25,000 to $34,999 | 0 (0.0%) | 29 (5.8%) |
| $35,000 to $49,999 | 10 (1.9%) | 0 (0.0%) |
| $50,000 to $74,999 | 86 (16.6%) | 18 (3.6%) |
| $75,000 to $99,999 | 113 (21.8%) | 98 (19.7%) |
| $100,000 to $149,999 | 96 (18.5%) | 9 (1.8%) |
| $150,000 or more | 138 (26.6%) | 70 (14.1%) |
| Total | 518 (100.0%) | 498 (100.0%) |
Property Value to Household Income Ratio in Moss Beach
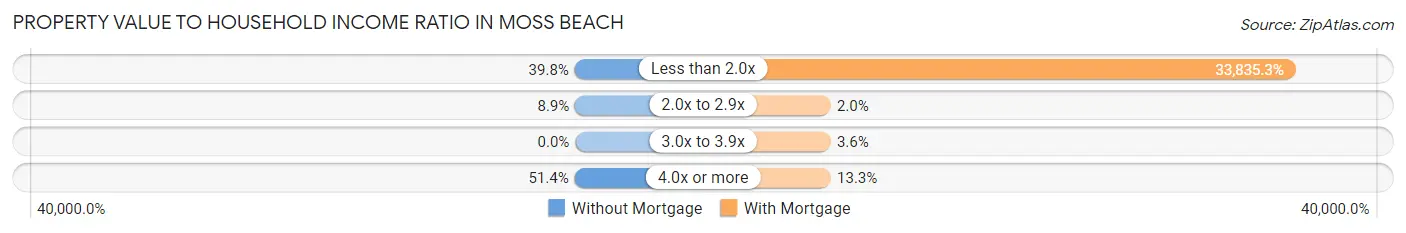
| Value-to-Income Ratio | Without Mortgage | With Mortgage |
| Less than 2.0x | 206 (39.8%) | 168,500 (33,835.3%) |
| 2.0x to 2.9x | 46 (8.9%) | 10 (2.0%) |
| 3.0x to 3.9x | 0 (0.0%) | 18 (3.6%) |
| 4.0x or more | 266 (51.3%) | 66 (13.3%) |
| Total | 518 (100.0%) | 498 (100.0%) |
Real Estate Taxes by Mortgage Status in Moss Beach
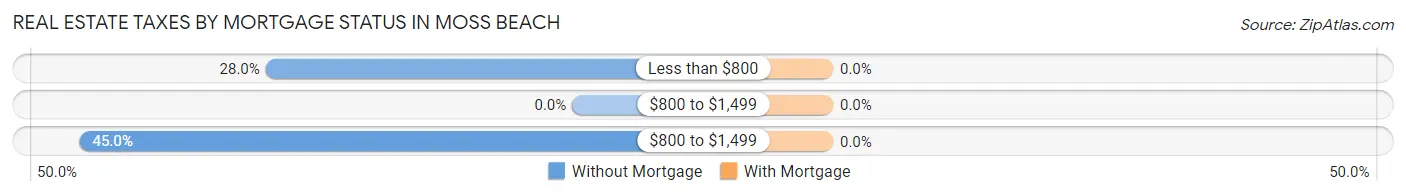
| Property Taxes | Without Mortgage | With Mortgage |
| Less than $800 | 145 (28.0%) | 0 (0.0%) |
| $800 to $1,499 | 0 (0.0%) | 0 (0.0%) |
| $800 to $1,499 | 233 (45.0%) | 0 (0.0%) |
| Total | 518 (100.0%) | 498 (100.0%) |
Health & Disability in Moss Beach
Health Insurance Coverage by Age in Moss Beach
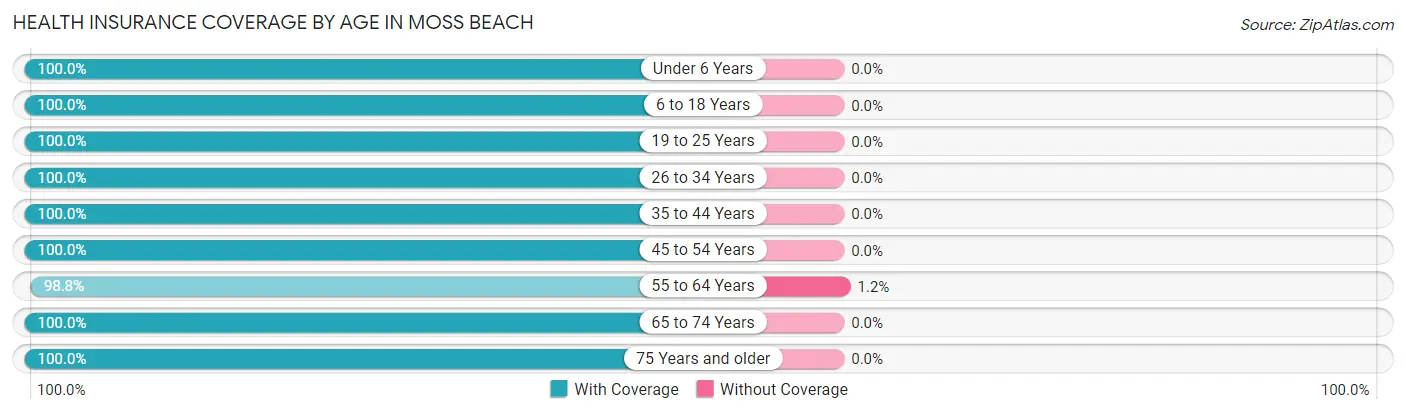
| Age Bracket | With Coverage | Without Coverage |
| Under 6 Years | 250 (100.0%) | 0 (0.0%) |
| 6 to 18 Years | 563 (100.0%) | 0 (0.0%) |
| 19 to 25 Years | 153 (100.0%) | 0 (0.0%) |
| 26 to 34 Years | 190 (100.0%) | 0 (0.0%) |
| 35 to 44 Years | 398 (100.0%) | 0 (0.0%) |
| 45 to 54 Years | 542 (100.0%) | 0 (0.0%) |
| 55 to 64 Years | 254 (98.8%) | 3 (1.2%) |
| 65 to 74 Years | 461 (100.0%) | 0 (0.0%) |
| 75 Years and older | 230 (100.0%) | 0 (0.0%) |
| Total | 3,041 (99.9%) | 3 (0.1%) |
Health Insurance Coverage by Citizenship Status in Moss Beach
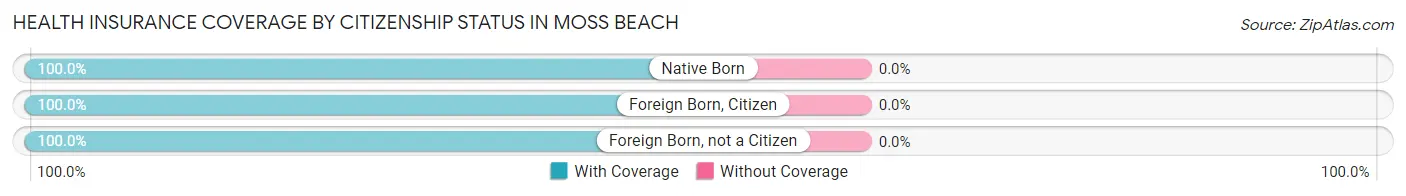
| Citizenship Status | With Coverage | Without Coverage |
| Native Born | 250 (100.0%) | 0 (0.0%) |
| Foreign Born, Citizen | 563 (100.0%) | 0 (0.0%) |
| Foreign Born, not a Citizen | 153 (100.0%) | 0 (0.0%) |
Health Insurance Coverage by Household Income in Moss Beach
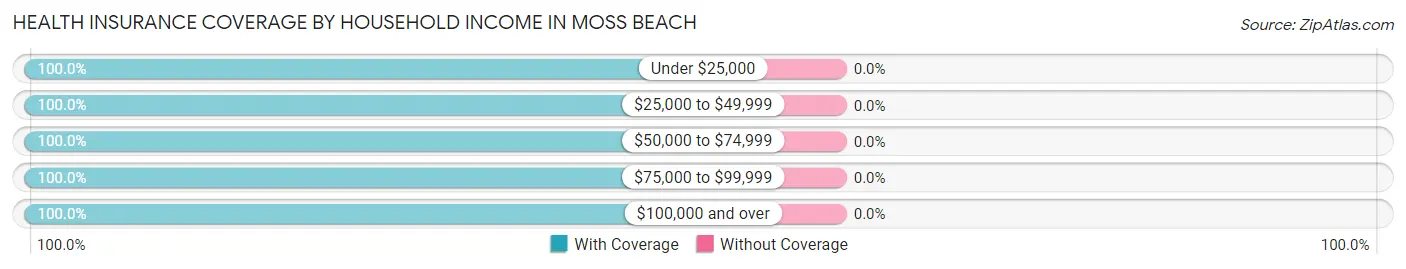
| Household Income | With Coverage | Without Coverage |
| Under $25,000 | 224 (100.0%) | 0 (0.0%) |
| $25,000 to $49,999 | 73 (100.0%) | 0 (0.0%) |
| $50,000 to $74,999 | 381 (100.0%) | 0 (0.0%) |
| $75,000 to $99,999 | 247 (100.0%) | 0 (0.0%) |
| $100,000 and over | 2,109 (100.0%) | 0 (0.0%) |
Public vs Private Health Insurance Coverage by Age in Moss Beach
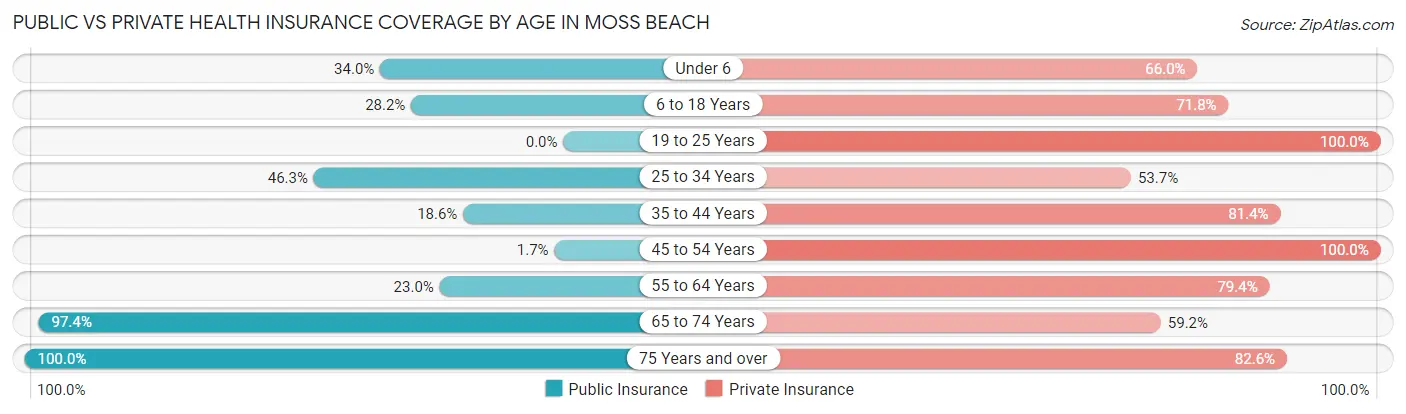
| Age Bracket | Public Insurance | Private Insurance |
| Under 6 | 85 (34.0%) | 165 (66.0%) |
| 6 to 18 Years | 159 (28.2%) | 404 (71.8%) |
| 19 to 25 Years | 0 (0.0%) | 153 (100.0%) |
| 25 to 34 Years | 88 (46.3%) | 102 (53.7%) |
| 35 to 44 Years | 74 (18.6%) | 324 (81.4%) |
| 45 to 54 Years | 9 (1.7%) | 542 (100.0%) |
| 55 to 64 Years | 59 (23.0%) | 204 (79.4%) |
| 65 to 74 Years | 449 (97.4%) | 273 (59.2%) |
| 75 Years and over | 230 (100.0%) | 190 (82.6%) |
| Total | 1,153 (37.9%) | 2,357 (77.4%) |
Disability Status by Sex by Age in Moss Beach
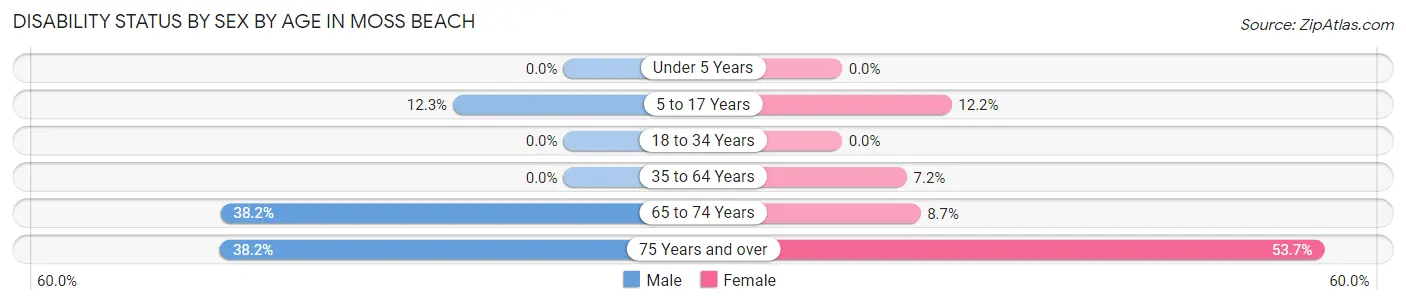
| Age Bracket | Male | Female |
| Under 5 Years | 0 (0.0%) | 0 (0.0%) |
| 5 to 17 Years | 38 (12.3%) | 31 (12.2%) |
| 18 to 34 Years | 0 (0.0%) | 0 (0.0%) |
| 35 to 64 Years | 0 (0.0%) | 40 (7.2%) |
| 65 to 74 Years | 71 (38.2%) | 24 (8.7%) |
| 75 Years and over | 26 (38.2%) | 87 (53.7%) |
Disability Class by Sex by Age in Moss Beach
Disability Class: Hearing Difficulty
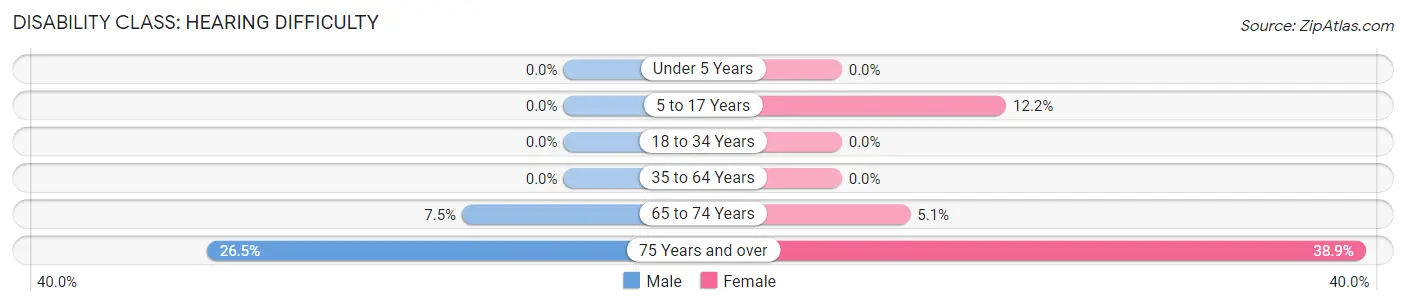
| Age Bracket | Male | Female |
| Under 5 Years | 0 (0.0%) | 0 (0.0%) |
| 5 to 17 Years | 0 (0.0%) | 31 (12.2%) |
| 18 to 34 Years | 0 (0.0%) | 0 (0.0%) |
| 35 to 64 Years | 0 (0.0%) | 0 (0.0%) |
| 65 to 74 Years | 14 (7.5%) | 14 (5.1%) |
| 75 Years and over | 18 (26.5%) | 63 (38.9%) |
Disability Class: Vision Difficulty
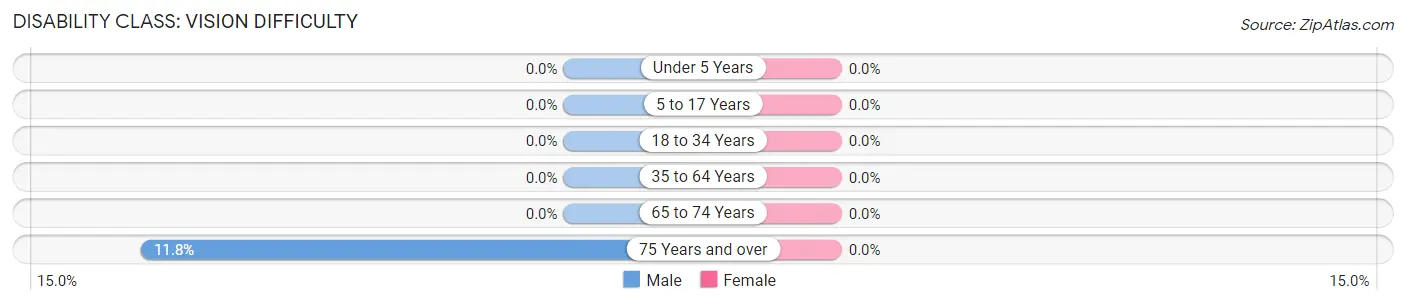
| Age Bracket | Male | Female |
| Under 5 Years | 0 (0.0%) | 0 (0.0%) |
| 5 to 17 Years | 0 (0.0%) | 0 (0.0%) |
| 18 to 34 Years | 0 (0.0%) | 0 (0.0%) |
| 35 to 64 Years | 0 (0.0%) | 0 (0.0%) |
| 65 to 74 Years | 0 (0.0%) | 0 (0.0%) |
| 75 Years and over | 8 (11.8%) | 0 (0.0%) |
Disability Class: Cognitive Difficulty
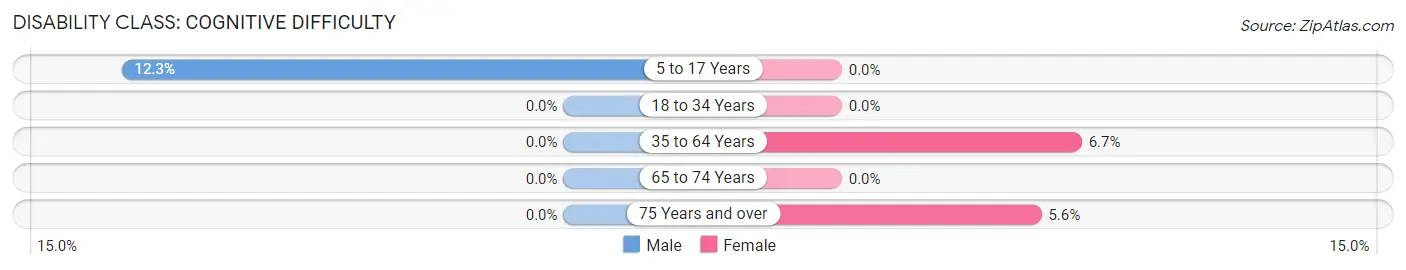
| Age Bracket | Male | Female |
| 5 to 17 Years | 38 (12.3%) | 0 (0.0%) |
| 18 to 34 Years | 0 (0.0%) | 0 (0.0%) |
| 35 to 64 Years | 0 (0.0%) | 37 (6.7%) |
| 65 to 74 Years | 0 (0.0%) | 0 (0.0%) |
| 75 Years and over | 0 (0.0%) | 9 (5.6%) |
Disability Class: Ambulatory Difficulty
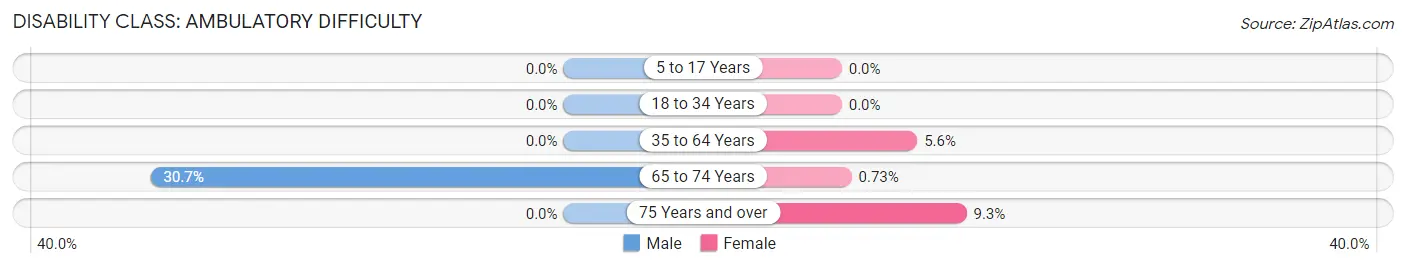
| Age Bracket | Male | Female |
| 5 to 17 Years | 0 (0.0%) | 0 (0.0%) |
| 18 to 34 Years | 0 (0.0%) | 0 (0.0%) |
| 35 to 64 Years | 0 (0.0%) | 31 (5.6%) |
| 65 to 74 Years | 57 (30.6%) | 2 (0.7%) |
| 75 Years and over | 0 (0.0%) | 15 (9.3%) |
Disability Class: Self-Care Difficulty
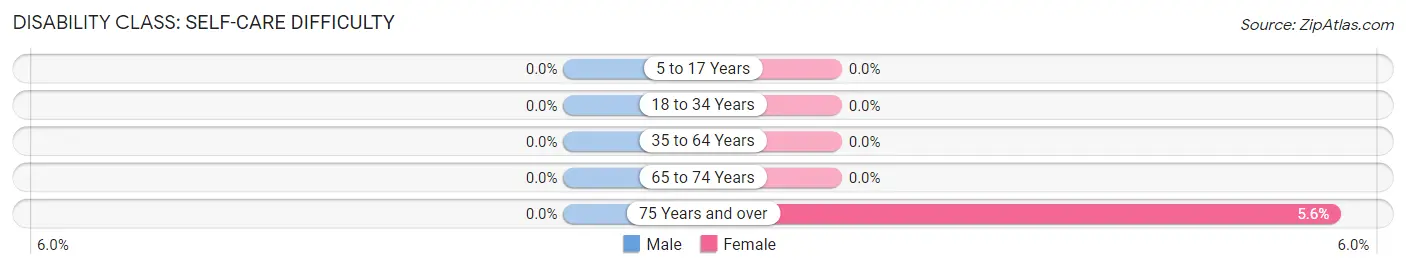
| Age Bracket | Male | Female |
| 5 to 17 Years | 0 (0.0%) | 0 (0.0%) |
| 18 to 34 Years | 0 (0.0%) | 0 (0.0%) |
| 35 to 64 Years | 0 (0.0%) | 0 (0.0%) |
| 65 to 74 Years | 0 (0.0%) | 0 (0.0%) |
| 75 Years and over | 0 (0.0%) | 9 (5.6%) |
Technology Access in Moss Beach
Computing Device Access in Moss Beach
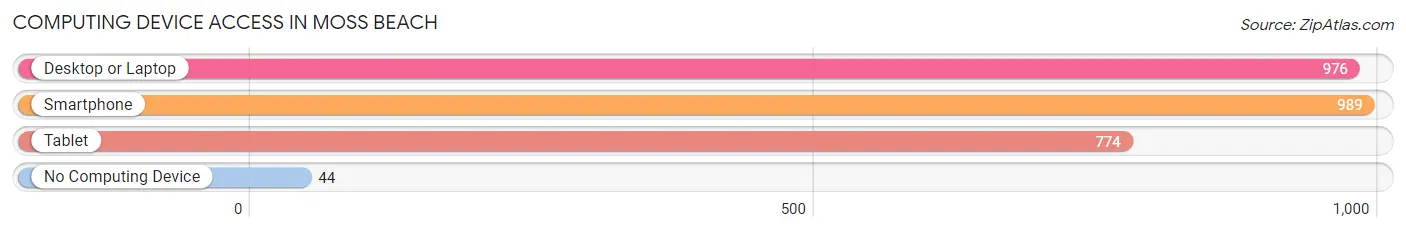
| Device Type | # Households | % Households |
| Desktop or Laptop | 976 | 89.8% |
| Smartphone | 989 | 91.0% |
| Tablet | 774 | 71.2% |
| No Computing Device | 44 | 4.1% |
| Total | 1,087 | 100.0% |
Internet Access in Moss Beach
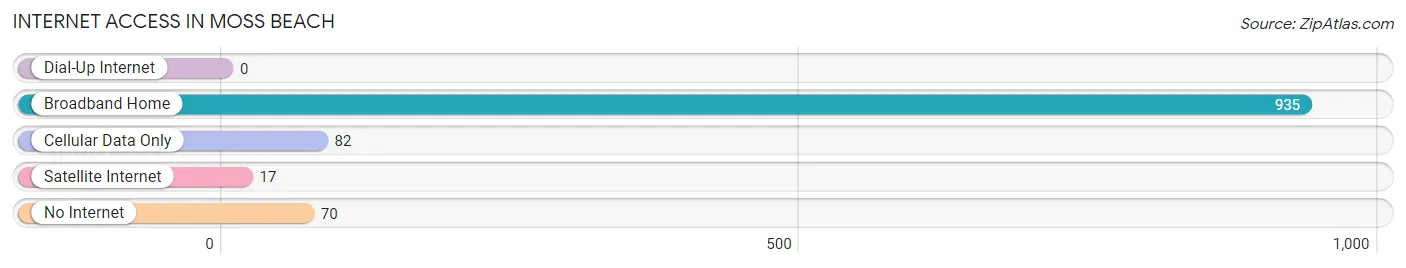
| Internet Type | # Households | % Households |
| Dial-Up Internet | 0 | 0.0% |
| Broadband Home | 935 | 86.0% |
| Cellular Data Only | 82 | 7.5% |
| Satellite Internet | 17 | 1.6% |
| No Internet | 70 | 6.4% |
| Total | 1,087 | 100.0% |
Moss Beach Summary
Moss Beach is a small coastal town located in San Mateo County, California, United States. It is situated on the Pacific Coast, about 20 miles south of San Francisco. The town has a population of approximately 2,500 people and is known for its beautiful beaches, scenic views, and relaxed atmosphere.
Geography
Moss Beach is located on the San Mateo County coast, about 20 miles south of San Francisco. The town is situated on a narrow strip of land between the Pacific Ocean and the San Mateo County hills. The town is bordered by the cities of Half Moon Bay to the north and Montara to the south. The town is located on the San Andreas Fault, which is responsible for the area’s frequent earthquakes.
The town is home to several beaches, including Moss Beach, Francis Beach, and Montara Beach. The beaches are popular for swimming, surfing, and other water activities. The town is also home to several parks, including Fitzgerald Marine Reserve, which is a protected marine sanctuary.
Economy
Moss Beach is a small town with a limited economy. The town’s main industry is tourism, as the town is a popular destination for beachgoers and outdoor enthusiasts. The town is also home to several small businesses, including restaurants, cafes, and shops.
The town is also home to several tech companies, including Google, which has an office in the town. The town is also home to several wineries, including the Half Moon Bay Winery and the Moss Beach Distillery.
Demographics
As of the 2010 census, the population of Moss Beach was 2,527. The town is predominantly white, with a population that is 77.3% white, 8.2% Hispanic or Latino, 6.2% Asian, and 4.3% African American. The median household income in the town is $90,845, and the median home value is $1,072,000.
The town is home to several schools, including Moss Beach Elementary School, Half Moon Bay High School, and the Half Moon Bay Academy. The town is also home to several churches, including the Moss Beach Community Church and the Moss Beach Presbyterian Church.
Conclusion
Moss Beach is a small coastal town located in San Mateo County, California. The town is known for its beautiful beaches, scenic views, and relaxed atmosphere. The town’s economy is largely based on tourism, and the town is home to several tech companies and wineries. The population of Moss Beach is predominantly white, with a median household income of $90,845 and a median home value of $1,072,000. The town is home to several schools and churches, and is a popular destination for beachgoers and outdoor enthusiasts.
Common Questions
What is Per Capita Income in Moss Beach?
Per Capita income in Moss Beach is $53,619.
What is the Median Family Income in Moss Beach?
Median Family Income in Moss Beach is $150,484.
What is the Median Household income in Moss Beach?
Median Household Income in Moss Beach is $116,950.
What is Income or Wage Gap in Moss Beach?
Income or Wage Gap in Moss Beach is 49.4%.
Women in Moss Beach earn 50.6 cents for every dollar earned by a man.
What is Inequality or Gini Index in Moss Beach?
Inequality or Gini Index in Moss Beach is 0.42.
What is the Total Population of Moss Beach?
Total Population of Moss Beach is 3,165.
What is the Total Male Population of Moss Beach?
Total Male Population of Moss Beach is 1,639.
What is the Total Female Population of Moss Beach?
Total Female Population of Moss Beach is 1,526.
What is the Ratio of Males per 100 Females in Moss Beach?
There are 107.40 Males per 100 Females in Moss Beach.
What is the Ratio of Females per 100 Males in Moss Beach?
There are 93.11 Females per 100 Males in Moss Beach.
What is the Median Population Age in Moss Beach?
Median Population Age in Moss Beach is 46.6 Years.
What is the Average Family Size in Moss Beach
Average Family Size in Moss Beach is 3.4 People.
What is the Average Household Size in Moss Beach
Average Household Size in Moss Beach is 2.8 People.
How Large is the Labor Force in Moss Beach?
There are 1,494 People in the Labor Forcein in Moss Beach.
What is the Percentage of People in the Labor Force in Moss Beach?
57.4% of People are in the Labor Force in Moss Beach.
What is the Unemployment Rate in Moss Beach?
Unemployment Rate in Moss Beach is 0.2%.