Zip Codes with the Highest Percentage of Population with a Degree in Visual and Performing Arts in Apple Valley, CA
RELATED REPORTS & OPTIONS
Visual and Performing Arts
Apple Valley
Compare Zip Codes
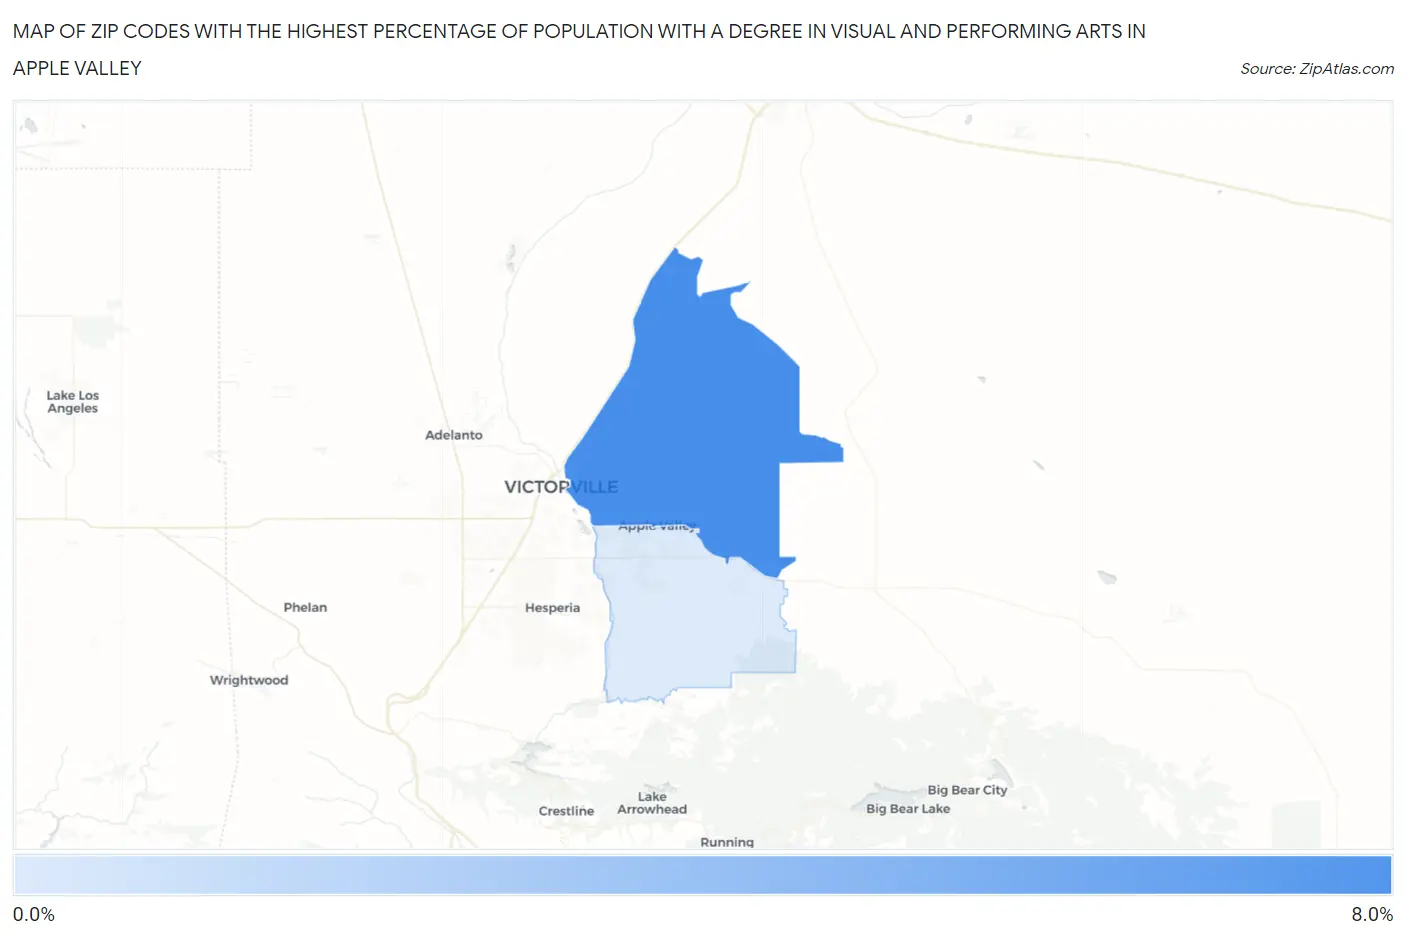
Map of Zip Codes with the Highest Percentage of Population with a Degree in Visual and Performing Arts in Apple Valley
1.5%
6.2%
Zip Codes with the Highest Percentage of Population with a Degree in Visual and Performing Arts in Apple Valley, CA
| Zip Code | % Graduates | vs State | vs National | |
| 1. | 92307 | 6.2% | 5.7%(+0.439)#494 | 4.3%(+1.93)#4,629 |
| 2. | 92308 | 1.5% | 5.7%(-4.22)#1,334 | 4.3%(-2.73)#18,089 |
1
Common Questions
What are the Top Zip Codes with the Highest Percentage of Population with a Degree in Visual and Performing Arts in Apple Valley, CA?
Top Zip Codes with the Highest Percentage of Population with a Degree in Visual and Performing Arts in Apple Valley, CA are:
What zip code has the Highest Percentage of Population with a Degree in Visual and Performing Arts in Apple Valley, CA?
92307 has the Highest Percentage of Population with a Degree in Visual and Performing Arts in Apple Valley, CA with 6.2%.
What is the Percentage of Population with a Degree in Visual and Performing Arts in Apple Valley, CA?
Percentage of Population with a Degree in Visual and Performing Arts in Apple Valley is 4.3%.
What is the Percentage of Population with a Degree in Visual and Performing Arts in California?
Percentage of Population with a Degree in Visual and Performing Arts in California is 5.7%.
What is the Percentage of Population with a Degree in Visual and Performing Arts in the United States?
Percentage of Population with a Degree in Visual and Performing Arts in the United States is 4.3%.