Cities with the Highest Percentage of Population with a Degree in Visual and Performing Arts in South Carolina
RELATED REPORTS & OPTIONS
Visual and Performing Arts
South Carolina
Compare Cities
Map of Cities with the Highest Percentage of Population with a Degree in Visual and Performing Arts in South Carolina
0.0%
80.0%
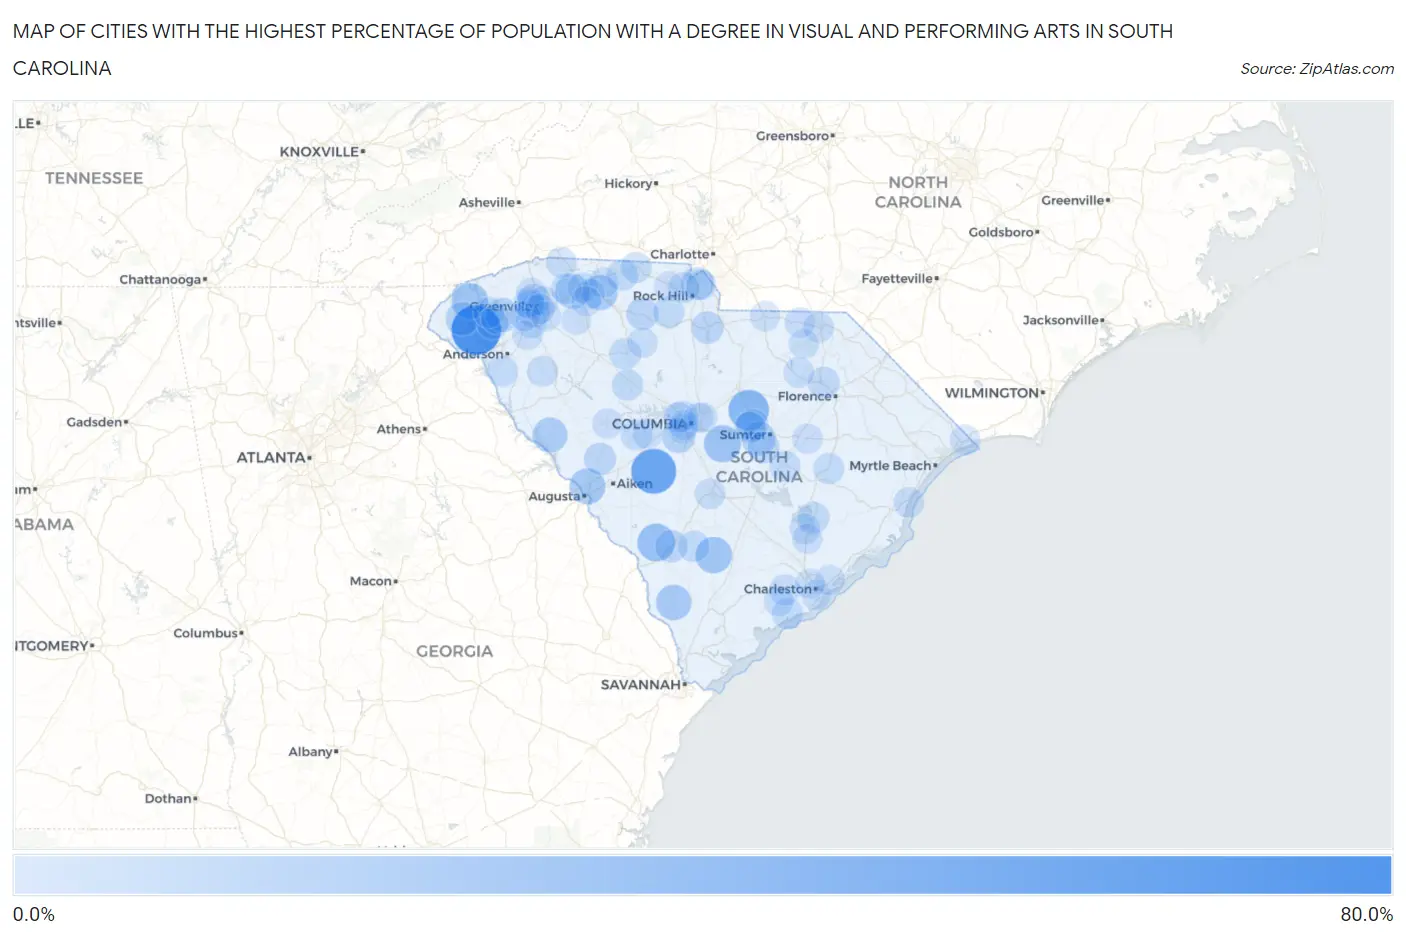
Cities with the Highest Percentage of Population with a Degree in Visual and Performing Arts in South Carolina
| City | % Graduates | vs State | vs National | |
| 1. | Utica | 61.8% | 3.3%(+58.5)#1 | 4.3%(+57.5)#74 |
| 2. | Wagener | 47.9% | 3.3%(+44.6)#2 | 4.3%(+43.6)#137 |
| 3. | Caesars Head | 35.3% | 3.3%(+32.0)#3 | 4.3%(+31.0)#225 |
| 4. | Rembert | 34.4% | 3.3%(+31.2)#4 | 4.3%(+30.2)#235 |
| 5. | Cateechee | 30.2% | 3.3%(+26.9)#5 | 4.3%(+25.9)#309 |
| 6. | Arthurtown | 27.5% | 3.3%(+24.3)#6 | 4.3%(+23.3)#365 |
| 7. | Kline | 26.3% | 3.3%(+23.1)#7 | 4.3%(+22.1)#394 |
| 8. | Gadsden | 24.2% | 3.3%(+20.9)#8 | 4.3%(+20.0)#460 |
| 9. | Williams | 22.7% | 3.3%(+19.5)#9 | 4.3%(+18.5)#497 |
| 10. | Salem | 22.2% | 3.3%(+19.0)#10 | 4.3%(+18.0)#520 |
| 11. | Belvedere | 20.8% | 3.3%(+17.5)#11 | 4.3%(+16.6)#584 |
| 12. | Furman | 19.4% | 3.3%(+16.2)#12 | 4.3%(+15.2)#674 |
| 13. | Glendale | 19.0% | 3.3%(+15.8)#13 | 4.3%(+14.8)#705 |
| 14. | Mccormick | 17.9% | 3.3%(+14.6)#14 | 4.3%(+13.6)#788 |
| 15. | Wellford | 17.7% | 3.3%(+14.5)#15 | 4.3%(+13.5)#797 |
| 16. | Liberty | 15.3% | 3.3%(+12.0)#16 | 4.3%(+11.0)#1,038 |
| 17. | Cane Savannah | 15.1% | 3.3%(+11.8)#17 | 4.3%(+10.8)#1,046 |
| 18. | East Camden | 15.1% | 3.3%(+11.8)#18 | 4.3%(+10.8)#1,049 |
| 19. | West Union | 14.3% | 3.3%(+11.0)#19 | 4.3%(+10.0)#1,152 |
| 20. | South Congaree | 13.8% | 3.3%(+10.5)#20 | 4.3%(+9.54)#1,226 |
| 21. | Riverview | 12.2% | 3.3%(+8.93)#21 | 4.3%(+7.94)#1,480 |
| 22. | Pimlico | 11.1% | 3.3%(+7.85)#22 | 4.3%(+6.86)#1,689 |
| 23. | Fort Lawn | 11.0% | 3.3%(+7.75)#23 | 4.3%(+6.76)#1,750 |
| 24. | Sandy Springs | 10.9% | 3.3%(+7.69)#24 | 4.3%(+6.70)#1,763 |
| 25. | Lockhart | 10.5% | 3.3%(+7.26)#25 | 4.3%(+6.27)#1,893 |
| 26. | Dunean | 10.5% | 3.3%(+7.20)#26 | 4.3%(+6.21)#1,911 |
| 27. | Sans Souci | 10.3% | 3.3%(+7.06)#27 | 4.3%(+6.07)#1,957 |
| 28. | Ulmer | 10.3% | 3.3%(+6.99)#28 | 4.3%(+6.00)#1,979 |
| 29. | Homewood | 10.2% | 3.3%(+6.91)#29 | 4.3%(+5.92)#2,007 |
| 30. | Oakland | 10.1% | 3.3%(+6.87)#30 | 4.3%(+5.88)#2,020 |
| 31. | Trenton | 10.0% | 3.3%(+6.74)#31 | 4.3%(+5.75)#2,068 |
| 32. | Stateburg | 9.3% | 3.3%(+6.00)#32 | 4.3%(+5.02)#2,336 |
| 33. | Baxter | 9.0% | 3.3%(+5.72)#33 | 4.3%(+4.73)#2,465 |
| 34. | Darlington | 8.9% | 3.3%(+5.68)#34 | 4.3%(+4.70)#2,487 |
| 35. | Privateer | 8.9% | 3.3%(+5.63)#35 | 4.3%(+4.64)#2,510 |
| 36. | Whitmire | 8.5% | 3.3%(+5.20)#36 | 4.3%(+4.21)#2,714 |
| 37. | Bonneau | 8.3% | 3.3%(+5.07)#37 | 4.3%(+4.08)#2,778 |
| 38. | Ehrhardt | 8.2% | 3.3%(+4.93)#38 | 4.3%(+3.94)#2,870 |
| 39. | Central | 8.2% | 3.3%(+4.92)#39 | 4.3%(+3.93)#2,879 |
| 40. | Gaffney | 8.0% | 3.3%(+4.69)#40 | 4.3%(+3.70)#3,005 |
| 41. | Lowrys | 7.7% | 3.3%(+4.43)#41 | 4.3%(+3.44)#3,160 |
| 42. | Newberry | 7.6% | 3.3%(+4.38)#42 | 4.3%(+3.39)#3,203 |
| 43. | Golden Grove | 7.6% | 3.3%(+4.37)#43 | 4.3%(+3.38)#3,206 |
| 44. | Batesburg Leesville | 7.6% | 3.3%(+4.35)#44 | 4.3%(+3.36)#3,220 |
| 45. | Rockville | 7.6% | 3.3%(+4.31)#45 | 4.3%(+3.32)#3,251 |
| 46. | Ravenel | 7.5% | 3.3%(+4.20)#46 | 4.3%(+3.21)#3,310 |
| 47. | Kingstree | 7.3% | 3.3%(+4.02)#47 | 4.3%(+3.04)#3,454 |
| 48. | Six Mile | 7.2% | 3.3%(+3.92)#48 | 4.3%(+2.93)#3,534 |
| 49. | St Andrews | 7.2% | 3.3%(+3.91)#49 | 4.3%(+2.92)#3,541 |
| 50. | Blacksburg | 7.1% | 3.3%(+3.79)#50 | 4.3%(+2.80)#3,666 |
| 51. | Manning | 7.0% | 3.3%(+3.70)#51 | 4.3%(+2.71)#3,738 |
| 52. | Starr | 6.9% | 3.3%(+3.63)#52 | 4.3%(+2.64)#3,793 |
| 53. | Chickasaw Point | 6.9% | 3.3%(+3.62)#53 | 4.3%(+2.63)#3,808 |
| 54. | Newport | 6.8% | 3.3%(+3.51)#54 | 4.3%(+2.52)#3,933 |
| 55. | Lyman | 6.7% | 3.3%(+3.45)#55 | 4.3%(+2.47)#3,983 |
| 56. | Donalds | 6.7% | 3.3%(+3.40)#56 | 4.3%(+2.41)#4,033 |
| 57. | Ben Avon | 6.6% | 3.3%(+3.38)#57 | 4.3%(+2.39)#4,078 |
| 58. | Pinopolis | 6.5% | 3.3%(+3.19)#58 | 4.3%(+2.20)#4,237 |
| 59. | Orangeburg | 6.4% | 3.3%(+3.17)#59 | 4.3%(+2.18)#4,262 |
| 60. | Capitol View | 6.3% | 3.3%(+3.04)#60 | 4.3%(+2.06)#4,382 |
| 61. | Seven Oaks | 6.2% | 3.3%(+2.93)#61 | 4.3%(+1.94)#4,512 |
| 62. | Whitney | 6.1% | 3.3%(+2.83)#62 | 4.3%(+1.84)#4,608 |
| 63. | Beech Island | 6.1% | 3.3%(+2.82)#63 | 4.3%(+1.83)#4,614 |
| 64. | Landrum | 5.9% | 3.3%(+2.68)#64 | 4.3%(+1.69)#4,772 |
| 65. | Cheraw | 5.9% | 3.3%(+2.63)#65 | 4.3%(+1.64)#4,824 |
| 66. | Pawleys Island | 5.9% | 3.3%(+2.62)#66 | 4.3%(+1.63)#4,862 |
| 67. | Hartsville | 5.8% | 3.3%(+2.57)#67 | 4.3%(+1.58)#4,908 |
| 68. | Berea | 5.7% | 3.3%(+2.46)#68 | 4.3%(+1.47)#5,034 |
| 69. | Chesterfield | 5.7% | 3.3%(+2.40)#69 | 4.3%(+1.41)#5,105 |
| 70. | Little River | 5.6% | 3.3%(+2.38)#70 | 4.3%(+1.39)#5,128 |
| 71. | West Pelzer | 5.4% | 3.3%(+2.12)#71 | 4.3%(+1.13)#5,467 |
| 72. | Turbeville | 5.3% | 3.3%(+2.00)#72 | 4.3%(+1.01)#5,624 |
| 73. | Summit | 5.3% | 3.3%(+2.00)#73 | 4.3%(+1.01)#5,630 |
| 74. | Parker | 5.3% | 3.3%(+2.00)#74 | 4.3%(+1.01)#5,644 |
| 75. | Saluda | 5.2% | 3.3%(+1.91)#75 | 4.3%(+0.920)#5,743 |
| 76. | Carlisle | 5.1% | 3.3%(+1.86)#76 | 4.3%(+0.876)#5,812 |
| 77. | James Island | 5.1% | 3.3%(+1.86)#77 | 4.3%(+0.870)#5,822 |
| 78. | Southern Shops | 5.1% | 3.3%(+1.80)#78 | 4.3%(+0.811)#5,904 |
| 79. | Cowpens | 5.0% | 3.3%(+1.74)#79 | 4.3%(+0.748)#5,992 |
| 80. | Meggett | 5.0% | 3.3%(+1.72)#80 | 4.3%(+0.727)#6,034 |
| 81. | Moncks Corner | 4.8% | 3.3%(+1.57)#81 | 4.3%(+0.582)#6,289 |
| 82. | Powdersville | 4.7% | 3.3%(+1.48)#82 | 4.3%(+0.494)#6,453 |
| 83. | Pageland | 4.7% | 3.3%(+1.48)#83 | 4.3%(+0.487)#6,462 |
| 84. | Springdale | 4.7% | 3.3%(+1.40)#84 | 4.3%(+0.410)#6,604 |
| 85. | Travelers Rest | 4.6% | 3.3%(+1.38)#85 | 4.3%(+0.394)#6,636 |
| 86. | Fort Mill | 4.6% | 3.3%(+1.32)#86 | 4.3%(+0.329)#6,756 |
| 87. | Wade Hampton | 4.6% | 3.3%(+1.32)#87 | 4.3%(+0.329)#6,757 |
| 88. | Spartanburg | 4.6% | 3.3%(+1.32)#88 | 4.3%(+0.328)#6,759 |
| 89. | Roebuck | 4.5% | 3.3%(+1.28)#89 | 4.3%(+0.293)#6,815 |
| 90. | Patrick | 4.5% | 3.3%(+1.28)#90 | 4.3%(+0.293)#6,827 |
| 91. | West Columbia | 4.5% | 3.3%(+1.27)#91 | 4.3%(+0.286)#6,850 |
| 92. | Mauldin | 4.5% | 3.3%(+1.27)#92 | 4.3%(+0.284)#6,855 |
| 93. | Mount Pleasant | 4.5% | 3.3%(+1.23)#93 | 4.3%(+0.242)#6,922 |
| 94. | Greenville | 4.5% | 3.3%(+1.20)#94 | 4.3%(+0.212)#6,981 |
| 95. | York | 4.4% | 3.3%(+1.17)#95 | 4.3%(+0.178)#7,041 |
| 96. | Norris | 4.4% | 3.3%(+1.15)#96 | 4.3%(+0.160)#7,079 |
| 97. | Columbia | 4.4% | 3.3%(+1.09)#97 | 4.3%(+0.100)#7,175 |
| 98. | Charleston | 4.3% | 3.3%(+1.07)#98 | 4.3%(+0.081)#7,233 |
| 99. | Woodruff | 4.3% | 3.3%(+1.06)#99 | 4.3%(+0.068)#7,256 |
| 100. | Forest Acres | 4.3% | 3.3%(+1.02)#100 | 4.3%(+0.033)#7,333 |
Common Questions
What are the Top 10 Cities with the Highest Percentage of Population with a Degree in Visual and Performing Arts in South Carolina?
Top 10 Cities with the Highest Percentage of Population with a Degree in Visual and Performing Arts in South Carolina are:
What city has the Highest Percentage of Population with a Degree in Visual and Performing Arts in South Carolina?
Utica has the Highest Percentage of Population with a Degree in Visual and Performing Arts in South Carolina with 61.8%.
What is the Percentage of Population with a Degree in Visual and Performing Arts in the State of South Carolina?
Percentage of Population with a Degree in Visual and Performing Arts in South Carolina is 3.3%.
What is the Percentage of Population with a Degree in Visual and Performing Arts in the United States?
Percentage of Population with a Degree in Visual and Performing Arts in the United States is 4.3%.