Cities with the Highest Percentage of Population with a Degree in Visual and Performing Arts in New Hampshire
RELATED REPORTS & OPTIONS
Visual and Performing Arts
New Hampshire
Compare Cities
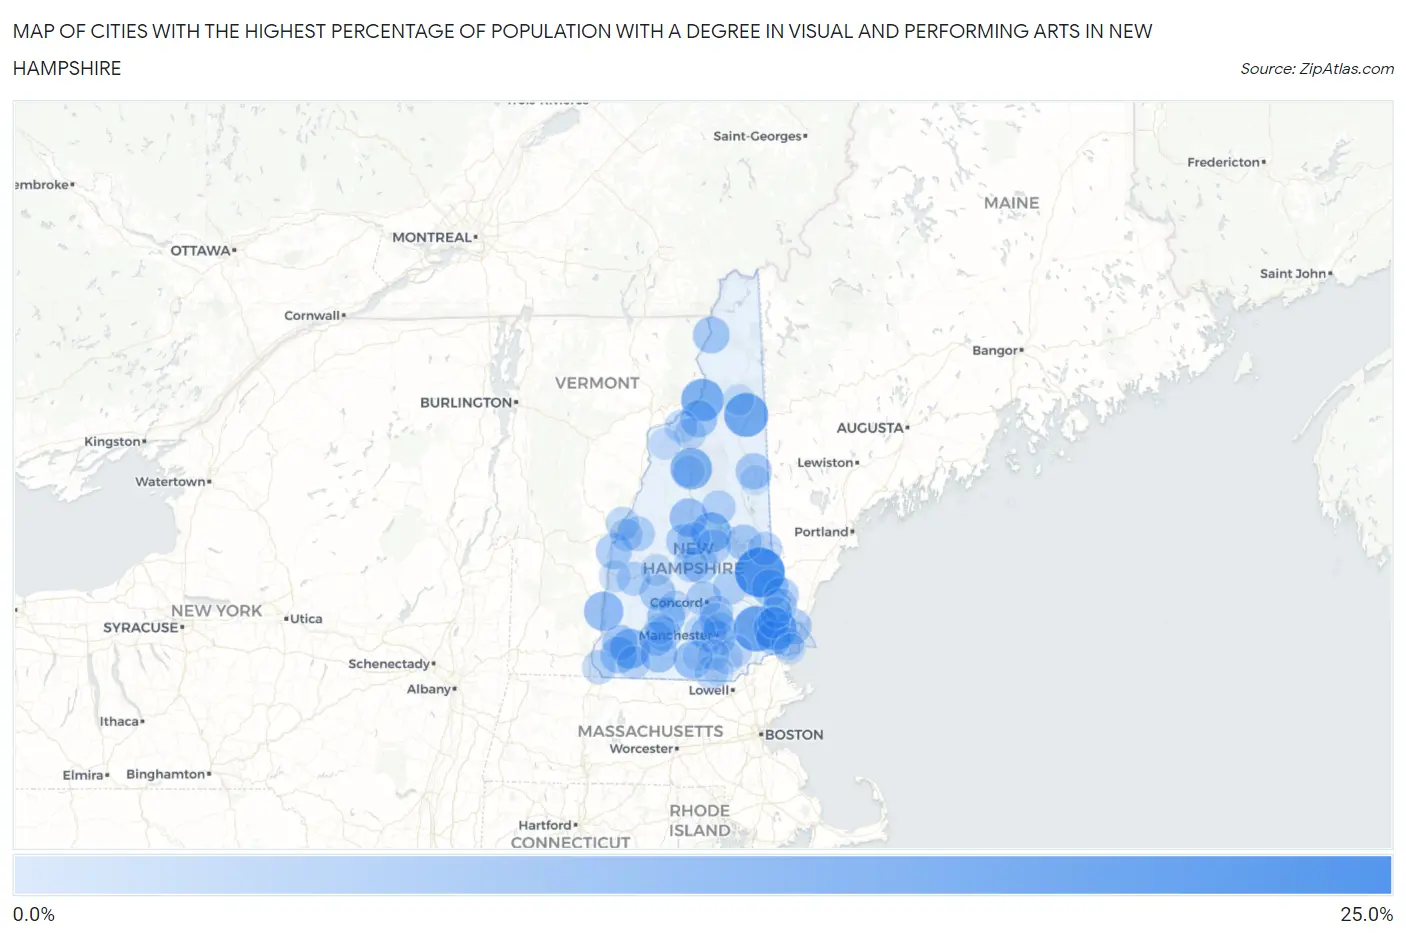
Map of Cities with the Highest Percentage of Population with a Degree in Visual and Performing Arts in New Hampshire
0.0%
25.0%
Cities with the Highest Percentage of Population with a Degree in Visual and Performing Arts in New Hampshire
| City | % Graduates | vs State | vs National | |
| 1. | Farmington | 22.2% | 4.2%(+18.0)#1 | 4.3%(+18.0)#512 |
| 2. | Epping | 17.5% | 4.2%(+13.3)#2 | 4.3%(+13.3)#811 |
| 3. | Gorham | 15.8% | 4.2%(+11.5)#3 | 4.3%(+11.5)#968 |
| 4. | Newfields | 14.7% | 4.2%(+10.5)#4 | 4.3%(+10.5)#1,096 |
| 5. | Lancaster | 14.0% | 4.2%(+9.79)#5 | 4.3%(+9.78)#1,192 |
| 6. | Francestown | 13.9% | 4.2%(+9.65)#6 | 4.3%(+9.64)#1,213 |
| 7. | Lincoln | 13.1% | 4.2%(+8.86)#7 | 4.3%(+8.86)#1,334 |
| 8. | Marlborough | 11.1% | 4.2%(+6.87)#8 | 4.3%(+6.86)#1,692 |
| 9. | Meredith | 11.1% | 4.2%(+6.81)#9 | 4.3%(+6.81)#1,741 |
| 10. | North Walpole | 10.4% | 4.2%(+6.20)#10 | 4.3%(+6.20)#1,917 |
| 11. | Plymouth | 9.0% | 4.2%(+4.75)#11 | 4.3%(+4.74)#2,454 |
| 12. | Hillsborough | 8.8% | 4.2%(+4.52)#12 | 4.3%(+4.51)#2,570 |
| 13. | Milford | 8.5% | 4.2%(+4.23)#13 | 4.3%(+4.22)#2,709 |
| 14. | Peterborough | 8.4% | 4.2%(+4.12)#14 | 4.3%(+4.11)#2,761 |
| 15. | Whitefield | 7.8% | 4.2%(+3.55)#15 | 4.3%(+3.54)#3,091 |
| 16. | West Swanzey | 7.6% | 4.2%(+3.36)#16 | 4.3%(+3.35)#3,227 |
| 17. | Colebrook | 7.5% | 4.2%(+3.22)#17 | 4.3%(+3.21)#3,312 |
| 18. | Rochester | 7.2% | 4.2%(+2.92)#18 | 4.3%(+2.91)#3,546 |
| 19. | North Conway | 6.9% | 4.2%(+2.61)#19 | 4.3%(+2.60)#3,832 |
| 20. | Wolfeboro | 6.7% | 4.2%(+2.48)#20 | 4.3%(+2.47)#3,981 |
| 21. | Plainfield | 6.7% | 4.2%(+2.42)#21 | 4.3%(+2.41)#4,050 |
| 22. | Pinardville | 6.6% | 4.2%(+2.34)#22 | 4.3%(+2.33)#4,135 |
| 23. | Tilton Northfield | 6.6% | 4.2%(+2.34)#23 | 4.3%(+2.33)#4,136 |
| 24. | Bradford | 6.5% | 4.2%(+2.21)#24 | 4.3%(+2.20)#4,240 |
| 25. | Portsmouth | 6.3% | 4.2%(+2.01)#25 | 4.3%(+2.00)#4,421 |
| 26. | Keene | 6.2% | 4.2%(+1.92)#26 | 4.3%(+1.91)#4,531 |
| 27. | Exeter | 6.1% | 4.2%(+1.86)#27 | 4.3%(+1.85)#4,587 |
| 28. | Manchester | 6.0% | 4.2%(+1.78)#28 | 4.3%(+1.77)#4,697 |
| 29. | Concord | 5.8% | 4.2%(+1.56)#29 | 4.3%(+1.55)#4,936 |
| 30. | Somersworth | 5.7% | 4.2%(+1.46)#30 | 4.3%(+1.46)#5,061 |
| 31. | Bristol | 5.6% | 4.2%(+1.40)#31 | 4.3%(+1.39)#5,132 |
| 32. | Bennington | 5.5% | 4.2%(+1.21)#32 | 4.3%(+1.20)#5,370 |
| 33. | Hancock | 5.3% | 4.2%(+1.02)#33 | 4.3%(+1.01)#5,639 |
| 34. | Enfield | 5.3% | 4.2%(+1.01)#34 | 4.3%(+1.00)#5,653 |
| 35. | Laconia | 4.9% | 4.2%(+0.701)#35 | 4.3%(+0.693)#6,090 |
| 36. | Pittsfield | 4.8% | 4.2%(+0.571)#36 | 4.3%(+0.563)#6,329 |
| 37. | Franklin | 4.7% | 4.2%(+0.491)#37 | 4.3%(+0.483)#6,476 |
| 38. | Center Sandwich | 4.6% | 4.2%(+0.372)#38 | 4.3%(+0.363)#6,690 |
| 39. | Suncook | 4.6% | 4.2%(+0.333)#39 | 4.3%(+0.324)#6,763 |
| 40. | Hooksett | 4.5% | 4.2%(+0.263)#40 | 4.3%(+0.255)#6,893 |
| 41. | Sanbornville | 4.5% | 4.2%(+0.244)#41 | 4.3%(+0.235)#6,938 |
| 42. | Newport | 4.4% | 4.2%(+0.174)#42 | 4.3%(+0.166)#7,070 |
| 43. | Dover | 4.2% | 4.2%(-0.038)#43 | 4.3%(-0.046)#7,494 |
| 44. | Hanover | 4.0% | 4.2%(-0.196)#44 | 4.3%(-0.204)#7,823 |
| 45. | Hinsdale | 4.0% | 4.2%(-0.264)#45 | 4.3%(-0.272)#7,975 |
| 46. | Nashua | 3.7% | 4.2%(-0.539)#46 | 4.3%(-0.548)#8,570 |
| 47. | New Hampton | 3.6% | 4.2%(-0.617)#47 | 4.3%(-0.625)#8,771 |
| 48. | South Hooksett | 3.6% | 4.2%(-0.635)#48 | 4.3%(-0.644)#8,812 |
| 49. | Londonderry | 3.6% | 4.2%(-0.674)#49 | 4.3%(-0.682)#8,907 |
| 50. | Lebanon | 3.5% | 4.2%(-0.779)#50 | 4.3%(-0.787)#9,157 |
| 51. | Troy | 3.4% | 4.2%(-0.815)#51 | 4.3%(-0.824)#9,248 |
| 52. | Littleton | 3.3% | 4.2%(-0.978)#52 | 4.3%(-0.987)#9,676 |
| 53. | Hampton | 3.2% | 4.2%(-1.06)#53 | 4.3%(-1.06)#9,860 |
| 54. | North Woodstock | 2.5% | 4.2%(-1.72)#54 | 4.3%(-1.73)#11,576 |
| 55. | New London | 2.5% | 4.2%(-1.74)#55 | 4.3%(-1.75)#11,658 |
| 56. | Henniker | 2.4% | 4.2%(-1.89)#56 | 4.3%(-1.90)#12,014 |
| 57. | Durham | 2.3% | 4.2%(-1.91)#57 | 4.3%(-1.92)#12,071 |
| 58. | Bethlehem | 2.3% | 4.2%(-1.93)#58 | 4.3%(-1.94)#12,137 |
| 59. | Derry | 2.3% | 4.2%(-1.97)#59 | 4.3%(-1.98)#12,215 |
| 60. | Claremont | 2.3% | 4.2%(-1.99)#60 | 4.3%(-2.00)#12,261 |
| 61. | Lisbon | 2.1% | 4.2%(-2.19)#61 | 4.3%(-2.20)#12,773 |
| 62. | Newmarket | 2.0% | 4.2%(-2.24)#62 | 4.3%(-2.25)#12,893 |
| 63. | Goffstown | 1.9% | 4.2%(-2.33)#63 | 4.3%(-2.34)#13,109 |
| 64. | Berlin | 1.8% | 4.2%(-2.47)#64 | 4.3%(-2.48)#13,439 |
| 65. | East Merrimack | 1.5% | 4.2%(-2.73)#65 | 4.3%(-2.74)#14,037 |
| 66. | Antrim | 1.3% | 4.2%(-2.94)#66 | 4.3%(-2.95)#14,492 |
| 67. | Hampton Beach | 1.1% | 4.2%(-3.12)#67 | 4.3%(-3.13)#14,824 |
| 68. | Conway | 0.81% | 4.2%(-3.43)#68 | 4.3%(-3.44)#15,308 |
| 69. | Amherst | 0.78% | 4.2%(-3.47)#69 | 4.3%(-3.47)#15,357 |
| 70. | Hudson | 0.18% | 4.2%(-4.06)#70 | 4.3%(-4.07)#15,801 |
1
Common Questions
What are the Top 10 Cities with the Highest Percentage of Population with a Degree in Visual and Performing Arts in New Hampshire?
Top 10 Cities with the Highest Percentage of Population with a Degree in Visual and Performing Arts in New Hampshire are:
#1
22.2%
#2
17.5%
#3
15.8%
#4
14.7%
#5
14.0%
#6
13.1%
#7
11.1%
#8
11.1%
#9
10.4%
#10
9.0%
What city has the Highest Percentage of Population with a Degree in Visual and Performing Arts in New Hampshire?
Farmington has the Highest Percentage of Population with a Degree in Visual and Performing Arts in New Hampshire with 22.2%.
What is the Percentage of Population with a Degree in Visual and Performing Arts in the State of New Hampshire?
Percentage of Population with a Degree in Visual and Performing Arts in New Hampshire is 4.2%.
What is the Percentage of Population with a Degree in Visual and Performing Arts in the United States?
Percentage of Population with a Degree in Visual and Performing Arts in the United States is 4.3%.