Cities with the Highest Percentage of Households with Income Above $200,000 in New Mexico
RELATED REPORTS & OPTIONS
Household Income | $200k+
New Mexico
Compare Cities
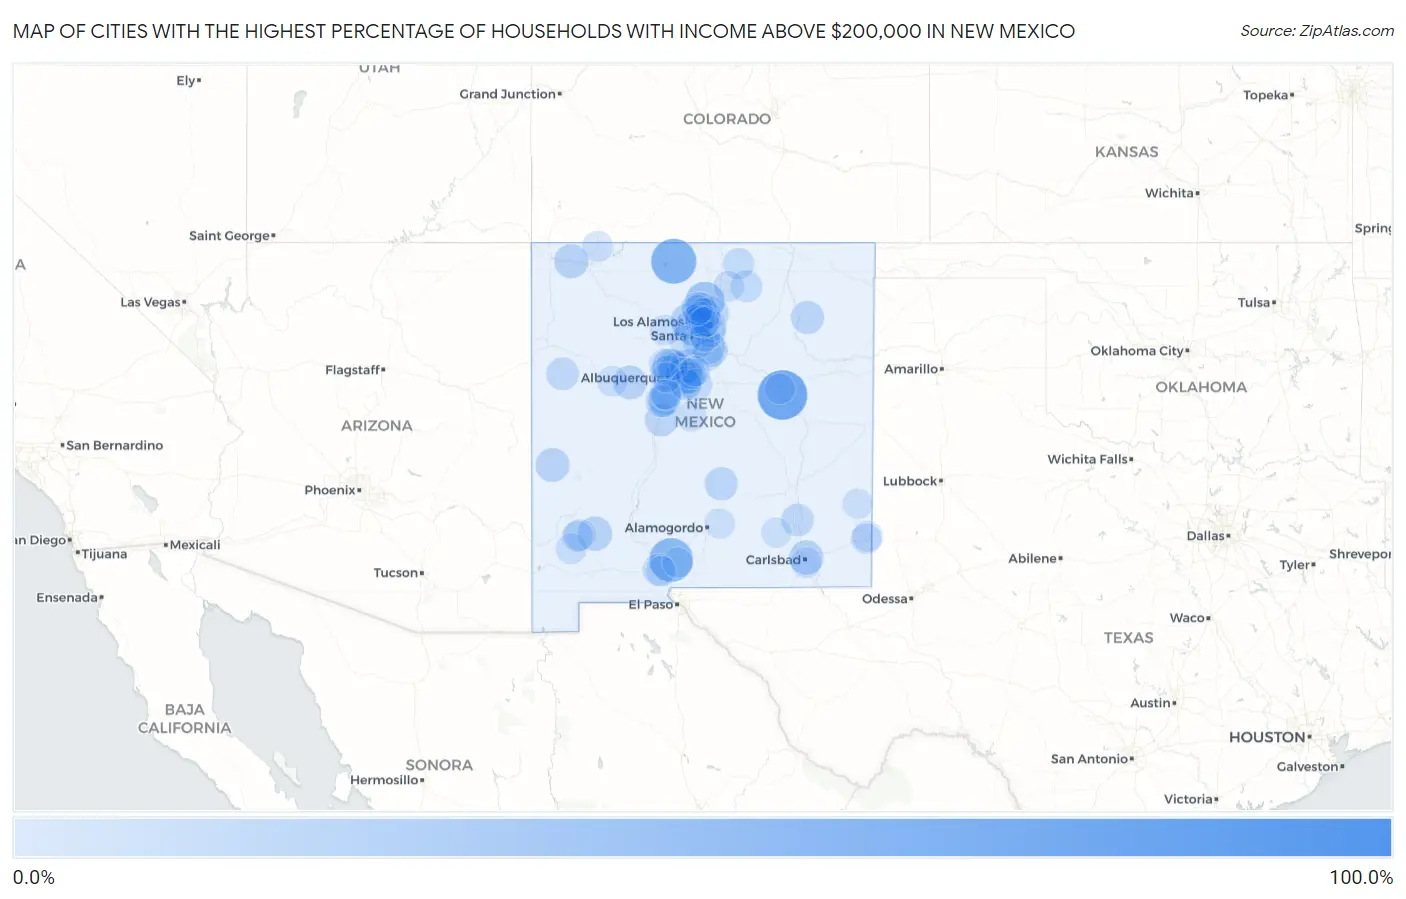
Map of Cities with the Highest Percentage of Households with Income Above $200,000 in New Mexico
0.0%
100.0%
Cities with the Highest Percentage of Households with Income Above $200,000 in New Mexico
| City | Households with Income > $200k | vs State | vs National | |
| 1. | Deer Canyon | 100.0% | 6.1%(+93.9)#1 | 11.4%(+88.6)#15 |
| 2. | Fort Wingate | 75.9% | 6.1%(+69.8)#2 | 11.4%(+64.5)#44 |
| 3. | Puerto De Luna | 73.8% | 6.1%(+67.7)#3 | 11.4%(+62.4)#54 |
| 4. | La Tierra | 61.8% | 6.1%(+55.7)#4 | 11.4%(+50.4)#150 |
| 5. | Ensenada | 58.2% | 6.1%(+52.1)#5 | 11.4%(+46.8)#227 |
| 6. | Organ | 53.2% | 6.1%(+47.1)#6 | 11.4%(+41.8)#356 |
| 7. | Paa-Ko | 49.0% | 6.1%(+42.9)#7 | 11.4%(+37.6)#484 |
| 8. | Santa Fe Foothills | 45.1% | 6.1%(+39.0)#8 | 11.4%(+33.7)#606 |
| 9. | Las Campanas | 44.7% | 6.1%(+38.6)#9 | 11.4%(+33.3)#627 |
| 10. | Hyde Park | 42.5% | 6.1%(+36.4)#10 | 11.4%(+31.1)#711 |
| 11. | Canova | 37.0% | 6.1%(+30.9)#11 | 11.4%(+25.6)#1,021 |
| 12. | Tano Road | 35.8% | 6.1%(+29.7)#12 | 11.4%(+24.4)#1,099 |
| 13. | Sandia Heights | 32.0% | 6.1%(+25.9)#13 | 11.4%(+20.6)#1,427 |
| 14. | White Rock | 30.1% | 6.1%(+24.0)#14 | 11.4%(+18.7)#1,606 |
| 15. | Picacho Hills | 28.6% | 6.1%(+22.5)#15 | 11.4%(+17.2)#1,760 |
| 16. | Stanley | 28.1% | 6.1%(+22.0)#16 | 11.4%(+16.7)#1,809 |
| 17. | Cedar Crest | 27.3% | 6.1%(+21.2)#17 | 11.4%(+15.9)#1,900 |
| 18. | Los Alamos | 25.3% | 6.1%(+19.2)#18 | 11.4%(+13.9)#2,131 |
| 19. | Corrales | 23.4% | 6.1%(+17.3)#19 | 11.4%(+12.0)#2,412 |
| 20. | Tres Arroyos | 23.4% | 6.1%(+17.3)#20 | 11.4%(+12.0)#2,415 |
| 21. | Sunlit Hills | 22.6% | 6.1%(+16.5)#21 | 11.4%(+11.2)#2,552 |
| 22. | La Huerta | 20.9% | 6.1%(+14.8)#22 | 11.4%(+9.50)#2,873 |
| 23. | San Lorenzo | 20.8% | 6.1%(+14.7)#23 | 11.4%(+9.40)#2,891 |
| 24. | Kirtland | 19.9% | 6.1%(+13.8)#24 | 11.4%(+8.50)#3,084 |
| 25. | Cruzville | 19.6% | 6.1%(+13.5)#25 | 11.4%(+8.20)#3,145 |
| 26. | Los Ranchos De Albuquerque | 19.2% | 6.1%(+13.1)#26 | 11.4%(+7.80)#3,218 |
| 27. | Sombrillo | 19.1% | 6.1%(+13.0)#27 | 11.4%(+7.70)#3,258 |
| 28. | Mesita | 19.0% | 6.1%(+12.9)#28 | 11.4%(+7.60)#3,280 |
| 29. | Mount Taylor | 18.9% | 6.1%(+12.8)#29 | 11.4%(+7.50)#3,310 |
| 30. | Conejo | 17.9% | 6.1%(+11.8)#30 | 11.4%(+6.50)#3,533 |
| 31. | Lamy | 17.1% | 6.1%(+11.0)#31 | 11.4%(+5.70)#3,716 |
| 32. | Nogal | 17.1% | 6.1%(+11.0)#32 | 11.4%(+5.70)#3,717 |
| 33. | Roy | 16.8% | 6.1%(+10.7)#33 | 11.4%(+5.40)#3,773 |
| 34. | Cañoncito | 16.6% | 6.1%(+10.5)#34 | 11.4%(+5.20)#3,840 |
| 35. | La Madera | 16.4% | 6.1%(+10.3)#35 | 11.4%(+5.00)#3,898 |
| 36. | El Duende | 16.2% | 6.1%(+10.1)#36 | 11.4%(+4.80)#3,930 |
| 37. | Eldorado At Santa Fe | 15.8% | 6.1%(+9.70)#37 | 11.4%(+4.40)#4,031 |
| 38. | Las Nutrias | 15.8% | 6.1%(+9.70)#38 | 11.4%(+4.40)#4,051 |
| 39. | Placitas Cdp Sandoval County | 15.6% | 6.1%(+9.50)#39 | 11.4%(+4.20)#4,098 |
| 40. | Ramah | 15.1% | 6.1%(+9.00)#40 | 11.4%(+3.70)#4,277 |
| 41. | Lake Arthur | 14.9% | 6.1%(+8.80)#41 | 11.4%(+3.50)#4,340 |
| 42. | Chupadero | 14.8% | 6.1%(+8.70)#42 | 11.4%(+3.40)#4,378 |
| 43. | El Cerro | 14.4% | 6.1%(+8.30)#43 | 11.4%(+3.00)#4,503 |
| 44. | Cordova | 13.8% | 6.1%(+7.70)#44 | 11.4%(+2.40)#4,757 |
| 45. | Cedro | 13.2% | 6.1%(+7.10)#45 | 11.4%(+1.80)#4,990 |
| 46. | Indian Hills | 13.1% | 6.1%(+7.00)#46 | 11.4%(+1.70)#5,028 |
| 47. | Tesuque | 13.1% | 6.1%(+7.00)#47 | 11.4%(+1.70)#5,030 |
| 48. | Los Chaves | 12.8% | 6.1%(+6.70)#48 | 11.4%(+1.40)#5,160 |
| 49. | Barton | 12.8% | 6.1%(+6.70)#49 | 11.4%(+1.40)#5,172 |
| 50. | Mesilla | 12.5% | 6.1%(+6.40)#50 | 11.4%(+1.10)#5,288 |
| 51. | Sedillo | 12.3% | 6.1%(+6.20)#51 | 11.4%(+0.900)#5,403 |
| 52. | Angel Fire | 12.2% | 6.1%(+6.10)#52 | 11.4%(+0.800)#5,445 |
| 53. | La Puebla | 12.0% | 6.1%(+5.90)#53 | 11.4%(+0.600)#5,537 |
| 54. | Tome | 12.0% | 6.1%(+5.90)#54 | 11.4%(+0.600)#5,538 |
| 55. | Rio Chiquito | 12.0% | 6.1%(+5.90)#55 | 11.4%(+0.600)#5,552 |
| 56. | Little Walnut | 11.7% | 6.1%(+5.60)#56 | 11.4%(+0.300)#5,676 |
| 57. | Arenas Valley | 11.5% | 6.1%(+5.40)#57 | 11.4%(+0.100)#5,772 |
| 58. | San Ildefonso Pueblo | 11.3% | 6.1%(+5.20)#58 | 11.4%(-0.100)#5,856 |
| 59. | Galisteo | 10.9% | 6.1%(+4.80)#59 | 11.4%(-0.500)#6,053 |
| 60. | Red River | 10.7% | 6.1%(+4.60)#60 | 11.4%(-0.700)#6,148 |
| 61. | Bosque Farms | 10.3% | 6.1%(+4.20)#61 | 11.4%(-1.10)#6,340 |
| 62. | La Mesilla | 10.1% | 6.1%(+4.00)#62 | 11.4%(-1.30)#6,467 |
| 63. | La Cienega | 9.8% | 6.1%(+3.70)#63 | 11.4%(-1.60)#6,649 |
| 64. | Ponderosa Pine | 9.7% | 6.1%(+3.60)#64 | 11.4%(-1.70)#6,736 |
| 65. | Pueblo Of Sandia Village | 9.6% | 6.1%(+3.50)#65 | 11.4%(-1.80)#6,802 |
| 66. | Cochiti | 9.6% | 6.1%(+3.50)#66 | 11.4%(-1.80)#6,803 |
| 67. | Bluewater | 9.6% | 6.1%(+3.50)#67 | 11.4%(-1.80)#6,815 |
| 68. | South River | 9.2% | 6.1%(+3.10)#68 | 11.4%(-2.20)#7,067 |
| 69. | White Signal | 9.1% | 6.1%(+3.00)#69 | 11.4%(-2.30)#7,153 |
| 70. | Rosedale | 9.0% | 6.1%(+2.90)#70 | 11.4%(-2.40)#7,212 |
| 71. | Santa Fe | 8.9% | 6.1%(+2.80)#71 | 11.4%(-2.50)#7,219 |
| 72. | Rio Rancho Estates | 8.9% | 6.1%(+2.80)#72 | 11.4%(-2.50)#7,253 |
| 73. | San Jose Cdp Rio Arriba County | 8.7% | 6.1%(+2.60)#73 | 11.4%(-2.70)#7,404 |
| 74. | Carlsbad | 8.6% | 6.1%(+2.50)#74 | 11.4%(-2.80)#7,432 |
| 75. | Taos | 8.6% | 6.1%(+2.50)#75 | 11.4%(-2.80)#7,447 |
| 76. | Skyline Ganipa | 8.6% | 6.1%(+2.50)#76 | 11.4%(-2.80)#7,469 |
| 77. | Jemez Springs | 8.6% | 6.1%(+2.50)#77 | 11.4%(-2.80)#7,487 |
| 78. | Crestview | 8.6% | 6.1%(+2.50)#78 | 11.4%(-2.80)#7,492 |
| 79. | North Hobbs | 8.4% | 6.1%(+2.30)#79 | 11.4%(-3.00)#7,594 |
| 80. | Santa Rosa | 8.4% | 6.1%(+2.30)#80 | 11.4%(-3.00)#7,602 |
| 81. | Center Point | 8.3% | 6.1%(+2.20)#81 | 11.4%(-3.10)#7,683 |
| 82. | Cedar Hill | 8.3% | 6.1%(+2.20)#82 | 11.4%(-3.10)#7,702 |
| 83. | Hobbs | 8.1% | 6.1%(+2.00)#83 | 11.4%(-3.30)#7,820 |
| 84. | El Rancho | 8.1% | 6.1%(+2.00)#84 | 11.4%(-3.30)#7,865 |
| 85. | San Pablo | 8.0% | 6.1%(+1.90)#85 | 11.4%(-3.40)#7,963 |
| 86. | Alcalde | 8.0% | 6.1%(+1.90)#86 | 11.4%(-3.40)#7,977 |
| 87. | Nambe | 7.9% | 6.1%(+1.80)#87 | 11.4%(-3.50)#8,024 |
| 88. | Edgewood | 7.8% | 6.1%(+1.70)#88 | 11.4%(-3.60)#8,077 |
| 89. | Mountainair | 7.8% | 6.1%(+1.70)#89 | 11.4%(-3.60)#8,119 |
| 90. | Cuyamungue | 7.4% | 6.1%(+1.30)#90 | 11.4%(-4.00)#8,477 |
| 91. | Edith Enclave | 7.4% | 6.1%(+1.30)#91 | 11.4%(-4.00)#8,497 |
| 92. | White Sands | 7.3% | 6.1%(+1.20)#92 | 11.4%(-4.10)#8,551 |
| 93. | Hernandez | 7.3% | 6.1%(+1.20)#93 | 11.4%(-4.10)#8,563 |
| 94. | Cedar Grove | 7.1% | 6.1%(+1.000)#94 | 11.4%(-4.30)#8,734 |
| 95. | Peralta | 7.0% | 6.1%(+0.900)#95 | 11.4%(-4.40)#8,803 |
| 96. | Tatum | 6.9% | 6.1%(+0.800)#96 | 11.4%(-4.50)#8,938 |
| 97. | Cloudcroft | 6.8% | 6.1%(+0.700)#97 | 11.4%(-4.60)#9,059 |
| 98. | Rio Rancho | 6.7% | 6.1%(+0.600)#98 | 11.4%(-4.70)#9,093 |
| 99. | Hope | 6.7% | 6.1%(+0.600)#99 | 11.4%(-4.70)#9,204 |
| 100. | Albuquerque | 6.6% | 6.1%(+0.500)#100 | 11.4%(-4.80)#9,212 |
Common Questions
What are the Top 10 Cities with the Highest Percentage of Households with Income Above $200,000 in New Mexico?
Top 10 Cities with the Highest Percentage of Households with Income Above $200,000 in New Mexico are:
#1
73.8%
#2
58.2%
#3
53.2%
#4
37.0%
#5
32.0%
#6
30.1%
#7
27.3%
#8
25.3%
#9
23.4%
#10
20.9%
What city has the Highest Percentage of Households with Income Above $200,000 in New Mexico?
Puerto de Luna has the Highest Percentage of Households with Income Above $200,000 in New Mexico with 73.8%.
What is the Percentage of Households with Income Above $200,000 in the State of New Mexico?
Percentage of Households with Income Above $200,000 in New Mexico is 6.1%.
What is the Percentage of Households with Income Above $200,000 in the United States?
Percentage of Households with Income Above $200,000 in the United States is 11.4%.