Cities with the Highest Percentage of Households with Income Above $200,000 in the United States
RELATED REPORTS & OPTIONS
Household Income | $200k+
United States
Compare Cities
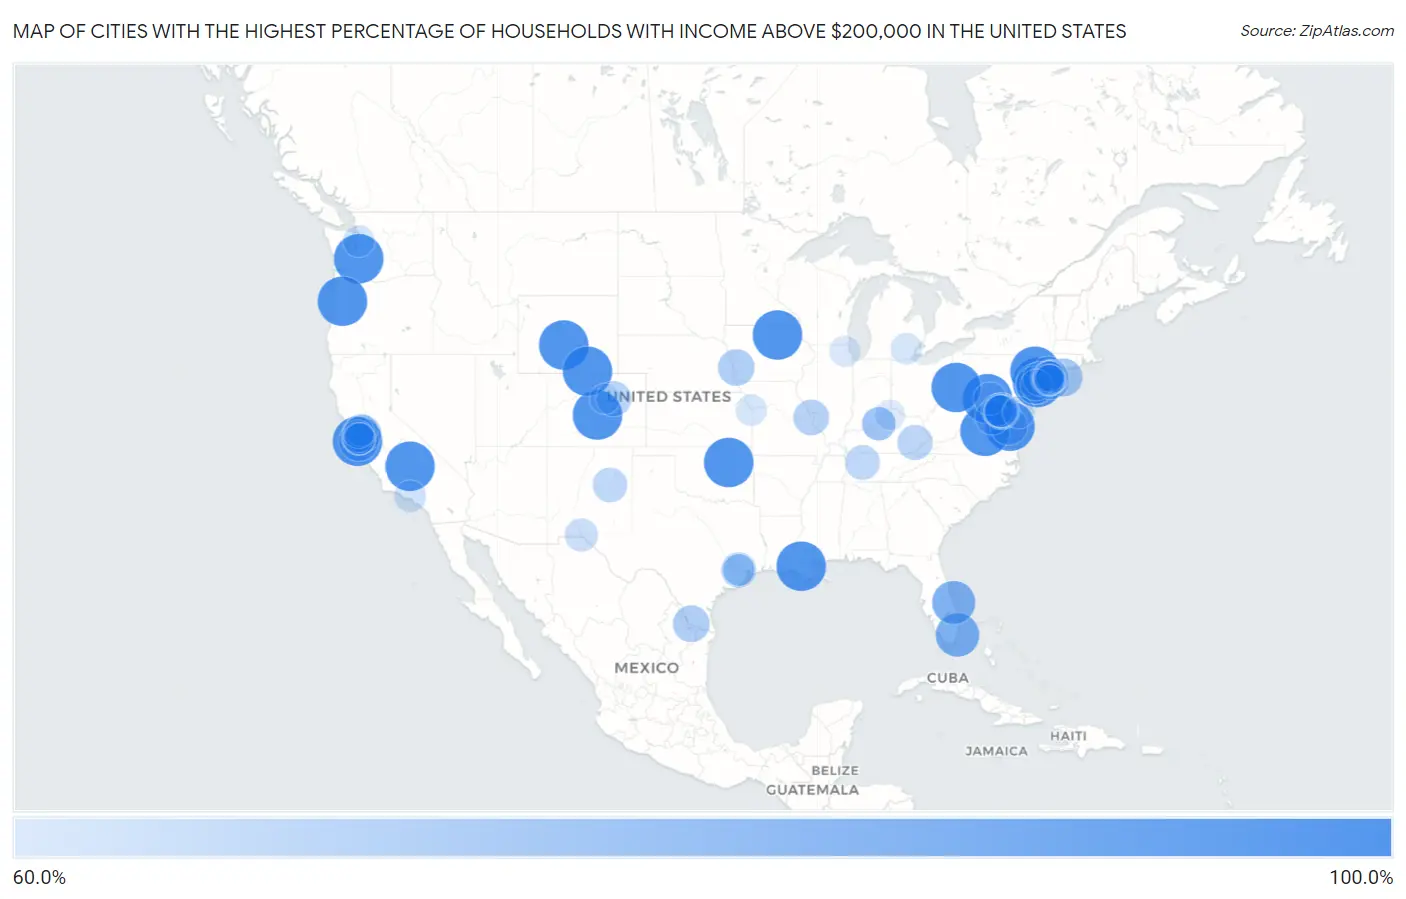
Map of Cities with the Highest Percentage of Households with Income Above $200,000 in the United States
0.0%
100.0%
Cities with the Highest Percentage of Households with Income Above $200,000 in the United States
| City | Households with Income > $200k | vs State | vs National | |
| 1. | La Grande | 100.0% | 15.4%(+84.6)#1 | 11.4%(+88.6)#1 |
| 2. | St George Island | 100.0% | 17.9%(+82.1)#1 | 11.4%(+88.6)#2 |
| 3. | Kings Valley | 100.0% | 10.5%(+89.5)#1 | 11.4%(+88.6)#3 |
| 4. | Palmyra | 100.0% | 15.6%(+84.4)#1 | 11.4%(+88.6)#4 |
| 5. | Loma Mar | 100.0% | 17.9%(+82.1)#1 | 11.4%(+88.6)#5 |
| 6. | Alleene | 100.0% | 5.6%(+94.4)#1 | 11.4%(+88.6)#6 |
| 7. | Zarephath | 100.0% | 19.2%(+80.8)#1 | 11.4%(+88.6)#7 |
| 8. | Ross Corner | 100.0% | 19.2%(+80.8)#2 | 11.4%(+88.6)#8 |
| 9. | Peach Creek | 100.0% | 4.8%(+95.2)#1 | 11.4%(+88.6)#9 |
| 10. | Big Pool | 100.0% | 17.9%(+82.1)#2 | 11.4%(+88.6)#10 |
| 11. | Westland | 100.0% | 10.2%(+89.8)#1 | 11.4%(+88.6)#11 |
| 12. | Orland Colony | 100.0% | 6.5%(+93.5)#1 | 11.4%(+88.6)#12 |
| 13. | Jeffrey City | 100.0% | 7.4%(+92.6)#1 | 11.4%(+88.6)#13 |
| 14. | Guffey | 100.0% | 13.9%(+86.1)#1 | 11.4%(+88.6)#14 |
| 15. | Deer Canyon | 100.0% | 6.1%(+93.9)#1 | 11.4%(+88.6)#15 |
| 16. | Bayou Corne | 100.0% | 6.8%(+93.2)#1 | 11.4%(+88.6)#16 |
| 17. | California Hot Springs | 100.0% | 17.9%(+82.1)#2 | 11.4%(+88.6)#17 |
| 18. | Mammoth | 100.0% | 7.2%(+92.8)#1 | 11.4%(+88.6)#18 |
| 19. | Roseville | 100.0% | 7.1%(+92.9)#1 | 11.4%(+88.6)#20 |
| 20. | Tavistock Borough | 100.0% | 19.2%(+80.8)#3 | 11.4%(+88.6)#21 |
| 21. | Plainview | 100.0% | 7.1%(+92.9)#2 | 11.4%(+88.6)#22 |
| 22. | Fox Park | 100.0% | 7.4%(+92.6)#2 | 11.4%(+88.6)#23 |
| 23. | Lotsee | 100.0% | 6.3%(+93.7)#1 | 11.4%(+88.6)#24 |
| 24. | Fisher Island | 89.4% | 9.0%(+80.4)#1 | 11.4%(+78.0)#25 |
| 25. | Windsor | 88.7% | 9.0%(+79.7)#2 | 11.4%(+77.3)#26 |
| 26. | Bard College | 85.5% | 15.2%(+70.3)#1 | 11.4%(+74.1)#27 |
| 27. | Harlingen | 85.0% | 19.2%(+65.8)#4 | 11.4%(+73.6)#28 |
| 28. | La Honda | 82.7% | 17.9%(+64.8)#3 | 11.4%(+71.3)#29 |
| 29. | Triumph | 82.6% | 12.1%(+70.5)#1 | 11.4%(+71.2)#30 |
| 30. | West Mountain | 82.5% | 17.0%(+65.5)#1 | 11.4%(+71.1)#31 |
| 31. | Keswick | 81.4% | 15.6%(+65.8)#2 | 11.4%(+70.0)#32 |
| 32. | Hewlett Bay Park | 80.8% | 15.2%(+65.6)#2 | 11.4%(+69.4)#33 |
| 33. | Blawenburg | 79.6% | 19.2%(+60.4)#5 | 11.4%(+68.2)#34 |
| 34. | West Hampton Dunes | 79.2% | 15.2%(+64.0)#3 | 11.4%(+67.8)#35 |
| 35. | Hawleyville | 78.9% | 17.0%(+61.9)#2 | 11.4%(+67.5)#36 |
| 36. | Tall Timbers | 78.8% | 17.9%(+60.9)#3 | 11.4%(+67.4)#37 |
| 37. | Norris Canyon | 78.4% | 17.9%(+60.5)#4 | 11.4%(+67.0)#38 |
| 38. | Rancho Viejo | 77.4% | 10.6%(+66.8)#1 | 11.4%(+66.0)#39 |
| 39. | Weston | 77.1% | 7.1%(+70.0)#3 | 11.4%(+65.7)#40 |
| 40. | Chevy Chase Section Five | 76.5% | 17.9%(+58.6)#4 | 11.4%(+65.1)#41 |
| 41. | Glendale Colony | 76.5% | 6.5%(+70.0)#2 | 11.4%(+65.1)#42 |
| 42. | Chevy Chase Village | 76.4% | 17.9%(+58.5)#5 | 11.4%(+65.0)#43 |
| 43. | Goodmanville | 76.2% | 17.9%(+58.3)#5 | 11.4%(+64.8)#44 |
| 44. | Fort Wingate | 75.9% | 6.1%(+69.8)#2 | 11.4%(+64.5)#45 |
| 45. | Country Life Acres | 75.8% | 7.3%(+68.5)#1 | 11.4%(+64.4)#46 |
| 46. | Great Falls Crossing | 75.7% | 15.6%(+60.1)#3 | 11.4%(+64.3)#47 |
| 47. | Plandome Heights | 75.4% | 15.2%(+60.2)#4 | 11.4%(+64.0)#48 |
| 48. | Hunters Creek Village | 75.0% | 10.6%(+64.4)#2 | 11.4%(+63.6)#49 |
| 49. | Comanche Creek | 75.0% | 13.9%(+61.1)#2 | 11.4%(+63.6)#50 |
| 50. | Lisbon | 75.0% | 17.9%(+57.1)#6 | 11.4%(+63.6)#51 |
| 51. | Jeff | 74.7% | 6.0%(+68.7)#1 | 11.4%(+63.3)#52 |
| 52. | Scarsdale | 74.3% | 15.2%(+59.1)#5 | 11.4%(+62.9)#53 |
| 53. | Belle Meade | 74.0% | 7.3%(+66.7)#1 | 11.4%(+62.6)#54 |
| 54. | Puerto De Luna | 73.8% | 6.1%(+67.7)#3 | 11.4%(+62.4)#55 |
| 55. | Calverton | 73.8% | 15.6%(+58.2)#4 | 11.4%(+62.4)#56 |
| 56. | Witches Woods | 73.2% | 17.0%(+56.2)#3 | 11.4%(+61.8)#57 |
| 57. | Tokeneke | 73.0% | 17.0%(+56.0)#4 | 11.4%(+61.6)#58 |
| 58. | Chevy Chase View | 73.0% | 17.9%(+55.1)#7 | 11.4%(+61.6)#59 |
| 59. | Short Hills | 72.9% | 19.2%(+53.7)#6 | 11.4%(+61.5)#60 |
| 60. | Sail Harbor | 72.9% | 17.0%(+55.9)#5 | 11.4%(+61.5)#61 |
| 61. | Villanova | 72.6% | 10.2%(+62.4)#2 | 11.4%(+61.2)#62 |
| 62. | Martin S Additions | 72.0% | 17.9%(+54.1)#8 | 11.4%(+60.6)#63 |
| 63. | Brookville | 71.9% | 15.2%(+56.7)#6 | 11.4%(+60.5)#64 |
| 64. | Mockingbird Valley | 71.6% | 6.0%(+65.6)#2 | 11.4%(+60.2)#65 |
| 65. | Glenview | 71.5% | 6.0%(+65.5)#3 | 11.4%(+60.1)#66 |
| 66. | Prado Verde | 71.4% | 10.6%(+60.8)#3 | 11.4%(+60.0)#67 |
| 67. | Chevy Chase Section Three | 71.3% | 17.9%(+53.4)#9 | 11.4%(+59.9)#68 |
| 68. | One Loudoun | 71.1% | 15.6%(+55.5)#5 | 11.4%(+59.7)#69 |
| 69. | Munsey Park | 70.8% | 15.2%(+55.6)#7 | 11.4%(+59.4)#70 |
| 70. | Charlton | 70.8% | 17.9%(+52.9)#10 | 11.4%(+59.4)#71 |
| 71. | Woodsburgh | 70.6% | 15.2%(+55.4)#8 | 11.4%(+59.2)#72 |
| 72. | Emerald Lake Hills | 70.3% | 17.9%(+52.4)#6 | 11.4%(+58.9)#73 |
| 73. | Laurel Hollow | 70.3% | 15.2%(+55.1)#9 | 11.4%(+58.9)#74 |
| 74. | Jackson Springs | 70.2% | 8.5%(+61.7)#1 | 11.4%(+58.8)#75 |
| 75. | Plandome | 70.0% | 15.2%(+54.8)#10 | 11.4%(+58.6)#76 |
| 76. | Shell Ridge | 69.9% | 17.9%(+52.0)#7 | 11.4%(+58.5)#77 |
| 77. | Somerset | 69.8% | 17.9%(+51.9)#11 | 11.4%(+58.4)#78 |
| 78. | Hillsborough | 69.6% | 17.9%(+51.7)#8 | 11.4%(+58.2)#79 |
| 79. | Bunker Hill Village | 69.5% | 10.6%(+58.9)#4 | 11.4%(+58.1)#80 |
| 80. | Hidden Hills | 69.5% | 17.9%(+51.6)#9 | 11.4%(+58.1)#81 |
| 81. | Great Falls | 69.4% | 15.6%(+53.8)#6 | 11.4%(+58.0)#82 |
| 82. | Brookmont | 69.4% | 17.9%(+51.5)#12 | 11.4%(+58.0)#83 |
| 83. | East Lynn | 69.4% | 12.1%(+57.3)#2 | 11.4%(+58.0)#84 |
| 84. | West Denton | 69.2% | 17.9%(+51.3)#13 | 11.4%(+57.8)#85 |
| 85. | Clyde Hill | 69.1% | 15.4%(+53.7)#2 | 11.4%(+57.7)#86 |
| 86. | Woodside | 69.0% | 17.9%(+51.1)#10 | 11.4%(+57.6)#87 |
| 87. | Difficult Run | 68.9% | 15.6%(+53.3)#7 | 11.4%(+57.5)#88 |
| 88. | Piney Point Village | 68.8% | 10.6%(+58.2)#5 | 11.4%(+57.4)#89 |
| 89. | Barton Hills | 68.4% | 8.2%(+60.2)#1 | 11.4%(+57.0)#90 |
| 90. | Piedmont | 68.2% | 17.9%(+50.3)#11 | 11.4%(+56.8)#91 |
| 91. | Mission Hills | 68.2% | 8.0%(+60.2)#1 | 11.4%(+56.8)#92 |
| 92. | Atherton | 68.1% | 17.9%(+50.2)#12 | 11.4%(+56.7)#93 |
| 93. | East Rocky Hill | 67.9% | 19.2%(+48.7)#7 | 11.4%(+56.5)#94 |
| 94. | Kildeer | 67.7% | 12.1%(+55.6)#3 | 11.4%(+56.3)#95 |
| 95. | Sands Point | 67.4% | 15.2%(+52.2)#11 | 11.4%(+56.0)#96 |
| 96. | Hewlett Neck | 67.3% | 15.2%(+52.1)#12 | 11.4%(+55.9)#97 |
| 97. | Old Hill | 67.1% | 17.0%(+50.1)#6 | 11.4%(+55.7)#98 |
| 98. | Cherry Hills Village | 66.9% | 13.9%(+53.0)#3 | 11.4%(+55.5)#99 |
| 99. | Hewlett Harbor | 66.7% | 15.2%(+51.5)#13 | 11.4%(+55.3)#100 |
| 100. | Florence | 66.7% | 6.7%(+60.0)#1 | 11.4%(+55.3)#101 |
Common Questions
What are the Top 10 Cities with the Highest Percentage of Households with Income Above $200,000 in the United States?
Top 10 Cities with the Highest Percentage of Households with Income Above $200,000 in the United States are:
#1
100.0%
#2
100.0%
#3
100.0%
#4
100.0%
#5
100.0%
#6
100.0%
#7
100.0%
#8
100.0%
#9
100.0%
#10
100.0%
What city has the Highest Percentage of Households with Income Above $200,000 in the United States?
La Grande has the Highest Percentage of Households with Income Above $200,000 in the United States with 100.0%.
What is the Percentage of Households with Income Above $200,000 in the United States?
Percentage of Households with Income Above $200,000 in the United States is 11.4%.