Cities with the Highest Percentage of Households with Income Above $200,000 in Oregon
RELATED REPORTS & OPTIONS
Household Income | $200k+
Oregon
Compare Cities
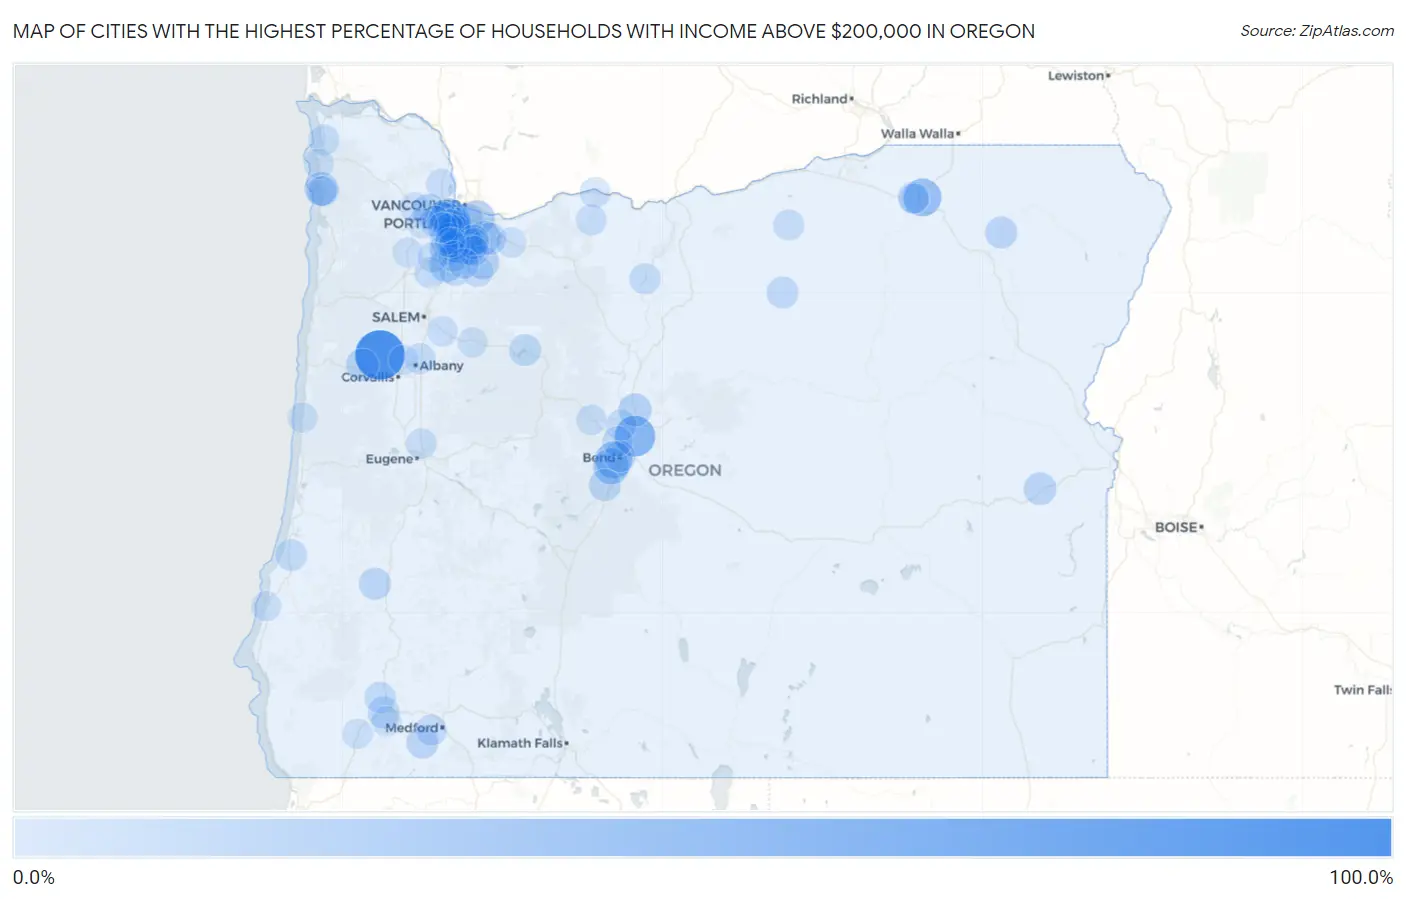
Map of Cities with the Highest Percentage of Households with Income Above $200,000 in Oregon
0.0%
100.0%
Cities with the Highest Percentage of Households with Income Above $200,000 in Oregon
| City | Households with Income > $200k | vs State | vs National | |
| 1. | Kings Valley | 100.0% | 10.5%(+89.5)#1 | 11.4%(+88.6)#3 |
| 2. | Dunthorpe | 61.6% | 10.5%(+51.1)#2 | 11.4%(+50.2)#153 |
| 3. | Pronghorn | 57.1% | 10.5%(+46.6)#3 | 11.4%(+45.7)#246 |
| 4. | Saunders Lake | 46.1% | 10.5%(+35.6)#4 | 11.4%(+34.7)#575 |
| 5. | Stafford | 44.8% | 10.5%(+34.3)#5 | 11.4%(+33.4)#620 |
| 6. | Kirkpatrick | 44.1% | 10.5%(+33.6)#6 | 11.4%(+32.7)#653 |
| 7. | Cedar Mill | 42.3% | 10.5%(+31.8)#7 | 11.4%(+30.9)#721 |
| 8. | Tetherow | 40.5% | 10.5%(+30.0)#8 | 11.4%(+29.1)#799 |
| 9. | Bethany | 36.1% | 10.5%(+25.6)#9 | 11.4%(+24.7)#1,070 |
| 10. | Seventh Mountain | 35.7% | 10.5%(+25.2)#10 | 11.4%(+24.3)#1,111 |
| 11. | Rivergrove | 35.3% | 10.5%(+24.8)#11 | 11.4%(+23.9)#1,158 |
| 12. | Jasper | 31.6% | 10.5%(+21.1)#12 | 11.4%(+20.2)#1,470 |
| 13. | Lake Oswego | 31.3% | 10.5%(+20.8)#13 | 11.4%(+19.9)#1,488 |
| 14. | Raleigh Hills | 30.3% | 10.5%(+19.8)#14 | 11.4%(+18.9)#1,581 |
| 15. | West Linn | 28.5% | 10.5%(+18.0)#15 | 11.4%(+17.1)#1,766 |
| 16. | Bull Mountain | 27.7% | 10.5%(+17.2)#16 | 11.4%(+16.3)#1,853 |
| 17. | Maywood Park | 27.2% | 10.5%(+16.7)#17 | 11.4%(+15.8)#1,917 |
| 18. | Butteville | 26.7% | 10.5%(+16.2)#18 | 11.4%(+15.3)#1,973 |
| 19. | Green Meadows | 26.1% | 10.5%(+15.6)#19 | 11.4%(+14.7)#2,050 |
| 20. | Happy Valley | 25.5% | 10.5%(+15.0)#20 | 11.4%(+14.1)#2,113 |
| 21. | West Slope | 24.3% | 10.5%(+13.8)#21 | 11.4%(+12.9)#2,257 |
| 22. | Boring | 24.1% | 10.5%(+13.6)#22 | 11.4%(+12.7)#2,294 |
| 23. | Neahkahnie | 24.1% | 10.5%(+13.6)#23 | 11.4%(+12.7)#2,299 |
| 24. | Gilchrist | 23.8% | 10.5%(+13.3)#24 | 11.4%(+12.4)#2,361 |
| 25. | Oak Hills | 23.6% | 10.5%(+13.1)#25 | 11.4%(+12.2)#2,373 |
| 26. | Beavercreek | 23.1% | 10.5%(+12.6)#26 | 11.4%(+11.7)#2,465 |
| 27. | Terrebonne | 23.1% | 10.5%(+12.6)#27 | 11.4%(+11.7)#2,471 |
| 28. | Sportsmans Park | 22.4% | 10.5%(+11.9)#28 | 11.4%(+11.0)#2,592 |
| 29. | Running Y Ranch | 21.4% | 10.5%(+10.9)#29 | 11.4%(+10.00)#2,774 |
| 30. | Summit | 21.4% | 10.5%(+10.9)#30 | 11.4%(+10.00)#2,776 |
| 31. | Sherwood | 21.3% | 10.5%(+10.8)#31 | 11.4%(+9.90)#2,789 |
| 32. | West Haven Sylvan | 20.3% | 10.5%(+9.80)#32 | 11.4%(+8.90)#2,978 |
| 33. | Harper | 20.3% | 10.5%(+9.80)#33 | 11.4%(+8.90)#2,991 |
| 34. | Garden Home Whitford | 19.5% | 10.5%(+9.00)#34 | 11.4%(+8.10)#3,155 |
| 35. | Pleasant Valley | 19.2% | 10.5%(+8.70)#35 | 11.4%(+7.80)#3,230 |
| 36. | Rockcreek | 19.1% | 10.5%(+8.60)#36 | 11.4%(+7.70)#3,242 |
| 37. | North Plains | 19.1% | 10.5%(+8.60)#37 | 11.4%(+7.70)#3,248 |
| 38. | Damascus | 18.3% | 10.5%(+7.80)#38 | 11.4%(+6.90)#3,430 |
| 39. | Ruch | 18.2% | 10.5%(+7.70)#39 | 11.4%(+6.80)#3,459 |
| 40. | Imbler | 18.0% | 10.5%(+7.50)#40 | 11.4%(+6.60)#3,502 |
| 41. | Sunriver | 17.6% | 10.5%(+7.10)#41 | 11.4%(+6.20)#3,600 |
| 42. | Melrose | 17.6% | 10.5%(+7.10)#42 | 11.4%(+6.20)#3,602 |
| 43. | Redwood | 17.4% | 10.5%(+6.90)#43 | 11.4%(+6.00)#3,634 |
| 44. | Detroit | 17.0% | 10.5%(+6.50)#44 | 11.4%(+5.60)#3,737 |
| 45. | Lonerock | 16.7% | 10.5%(+6.20)#45 | 11.4%(+5.30)#3,807 |
| 46. | Tigard | 16.4% | 10.5%(+5.90)#46 | 11.4%(+5.00)#3,878 |
| 47. | Heceta Beach | 16.1% | 10.5%(+5.60)#47 | 11.4%(+4.70)#3,954 |
| 48. | Marlene | 15.6% | 10.5%(+5.10)#48 | 11.4%(+4.20)#4,097 |
| 49. | Tualatin | 15.3% | 10.5%(+4.80)#49 | 11.4%(+3.90)#4,185 |
| 50. | Cedar Hills | 15.3% | 10.5%(+4.80)#50 | 11.4%(+3.90)#4,196 |
| 51. | Glasgow | 15.3% | 10.5%(+4.80)#51 | 11.4%(+3.90)#4,217 |
| 52. | Merlin | 15.1% | 10.5%(+4.60)#52 | 11.4%(+3.70)#4,270 |
| 53. | Riverside | 15.1% | 10.5%(+4.60)#53 | 11.4%(+3.70)#4,279 |
| 54. | Portland | 14.8% | 10.5%(+4.30)#54 | 11.4%(+3.40)#4,347 |
| 55. | Aurora | 14.8% | 10.5%(+4.30)#55 | 11.4%(+3.40)#4,374 |
| 56. | Bend | 14.4% | 10.5%(+3.90)#56 | 11.4%(+3.00)#4,482 |
| 57. | Mulino | 14.2% | 10.5%(+3.70)#57 | 11.4%(+2.80)#4,589 |
| 58. | Hillsboro | 14.1% | 10.5%(+3.60)#58 | 11.4%(+2.70)#4,598 |
| 59. | Maupin | 14.1% | 10.5%(+3.60)#59 | 11.4%(+2.70)#4,623 |
| 60. | Jacksonville | 13.9% | 10.5%(+3.40)#60 | 11.4%(+2.50)#4,700 |
| 61. | Durham | 13.7% | 10.5%(+3.20)#61 | 11.4%(+2.30)#4,792 |
| 62. | Eagle Crest | 13.5% | 10.5%(+3.00)#62 | 11.4%(+2.10)#4,868 |
| 63. | Gearhart | 13.5% | 10.5%(+3.00)#63 | 11.4%(+2.10)#4,872 |
| 64. | Cherry Grove | 13.2% | 10.5%(+2.70)#64 | 11.4%(+1.80)#4,994 |
| 65. | Millersburg | 13.1% | 10.5%(+2.60)#65 | 11.4%(+1.70)#5,022 |
| 66. | St Paul | 13.1% | 10.5%(+2.60)#66 | 11.4%(+1.70)#5,038 |
| 67. | Gladstone | 13.0% | 10.5%(+2.50)#67 | 11.4%(+1.60)#5,054 |
| 68. | Oatfield | 12.8% | 10.5%(+2.30)#68 | 11.4%(+1.40)#5,151 |
| 69. | Wilsonville | 12.7% | 10.5%(+2.20)#69 | 11.4%(+1.30)#5,187 |
| 70. | Ione | 12.7% | 10.5%(+2.20)#70 | 11.4%(+1.30)#5,215 |
| 71. | Beaverton | 12.4% | 10.5%(+1.90)#71 | 11.4%(+1.000)#5,324 |
| 72. | Mount Hood | 12.2% | 10.5%(+1.70)#72 | 11.4%(+0.800)#5,422 |
| 73. | Coburg | 11.5% | 10.5%(+1.00)#73 | 11.4%(+0.100)#5,767 |
| 74. | Oregon City | 10.9% | 10.5%(+0.400)#74 | 11.4%(-0.500)#6,004 |
| 75. | Hood River | 10.8% | 10.5%(+0.300)#75 | 11.4%(-0.600)#6,072 |
| 76. | Aumsville | 10.8% | 10.5%(+0.300)#76 | 11.4%(-0.600)#6,081 |
| 77. | Prineville Lake Acres | 10.8% | 10.5%(+0.300)#77 | 11.4%(-0.600)#6,093 |
| 78. | Canby | 10.7% | 10.5%(+0.200)#78 | 11.4%(-0.700)#6,113 |
| 79. | Sisters | 10.7% | 10.5%(+0.200)#79 | 11.4%(-0.700)#6,132 |
| 80. | Bayside Gardens | 10.7% | 10.5%(+0.200)#80 | 11.4%(-0.700)#6,145 |
| 81. | Tumalo | 10.7% | 10.5%(+0.200)#81 | 11.4%(-0.700)#6,146 |
| 82. | Scappoose | 10.5% | 10.5%(=0.000)#82 | 11.4%(-0.900)#6,231 |
| 83. | Banks | 10.0% | 10.5%(-0.500)#83 | 11.4%(-1.40)#6,514 |
| 84. | Lyons | 9.6% | 10.5%(-0.900)#84 | 11.4%(-1.80)#6,791 |
| 85. | Elmira | 9.6% | 10.5%(-0.900)#85 | 11.4%(-1.80)#6,808 |
| 86. | Cornelius | 9.5% | 10.5%(-1.000)#86 | 11.4%(-1.90)#6,834 |
| 87. | Sandy | 9.5% | 10.5%(-1.000)#87 | 11.4%(-1.90)#6,836 |
| 88. | Aloha | 9.4% | 10.5%(-1.10)#88 | 11.4%(-2.00)#6,889 |
| 89. | New Hope | 9.4% | 10.5%(-1.10)#89 | 11.4%(-2.00)#6,936 |
| 90. | Yamhill | 9.4% | 10.5%(-1.10)#90 | 11.4%(-2.00)#6,937 |
| 91. | Selma | 9.4% | 10.5%(-1.10)#91 | 11.4%(-2.00)#6,941 |
| 92. | Gopher Flats | 9.4% | 10.5%(-1.10)#92 | 11.4%(-2.00)#6,950 |
| 93. | King City | 9.3% | 10.5%(-1.20)#93 | 11.4%(-2.10)#6,989 |
| 94. | Cannon Beach | 9.3% | 10.5%(-1.20)#94 | 11.4%(-2.10)#7,005 |
| 95. | Dexter | 9.3% | 10.5%(-1.20)#95 | 11.4%(-2.10)#7,008 |
| 96. | Yachats | 9.3% | 10.5%(-1.20)#96 | 11.4%(-2.10)#7,012 |
| 97. | Newberg | 9.2% | 10.5%(-1.30)#97 | 11.4%(-2.20)#7,036 |
| 98. | Bandon | 9.2% | 10.5%(-1.30)#98 | 11.4%(-2.20)#7,052 |
| 99. | Adair Village | 9.2% | 10.5%(-1.30)#99 | 11.4%(-2.20)#7,069 |
| 100. | Manzanita | 9.2% | 10.5%(-1.30)#100 | 11.4%(-2.20)#7,077 |
Common Questions
What are the Top 10 Cities with the Highest Percentage of Households with Income Above $200,000 in Oregon?
Top 10 Cities with the Highest Percentage of Households with Income Above $200,000 in Oregon are:
#1
100.0%
#2
57.1%
#3
44.8%
#4
44.1%
#5
42.3%
#6
40.5%
#7
36.1%
#8
35.7%
#9
35.3%
#10
31.3%
What city has the Highest Percentage of Households with Income Above $200,000 in Oregon?
Kings Valley has the Highest Percentage of Households with Income Above $200,000 in Oregon with 100.0%.
What is the Percentage of Households with Income Above $200,000 in the State of Oregon?
Percentage of Households with Income Above $200,000 in Oregon is 10.5%.
What is the Percentage of Households with Income Above $200,000 in the United States?
Percentage of Households with Income Above $200,000 in the United States is 11.4%.