Cities with the Highest Percentage of Households with Income Above $200,000 in New York
RELATED REPORTS & OPTIONS
Household Income | $200k+
New York
Compare Cities
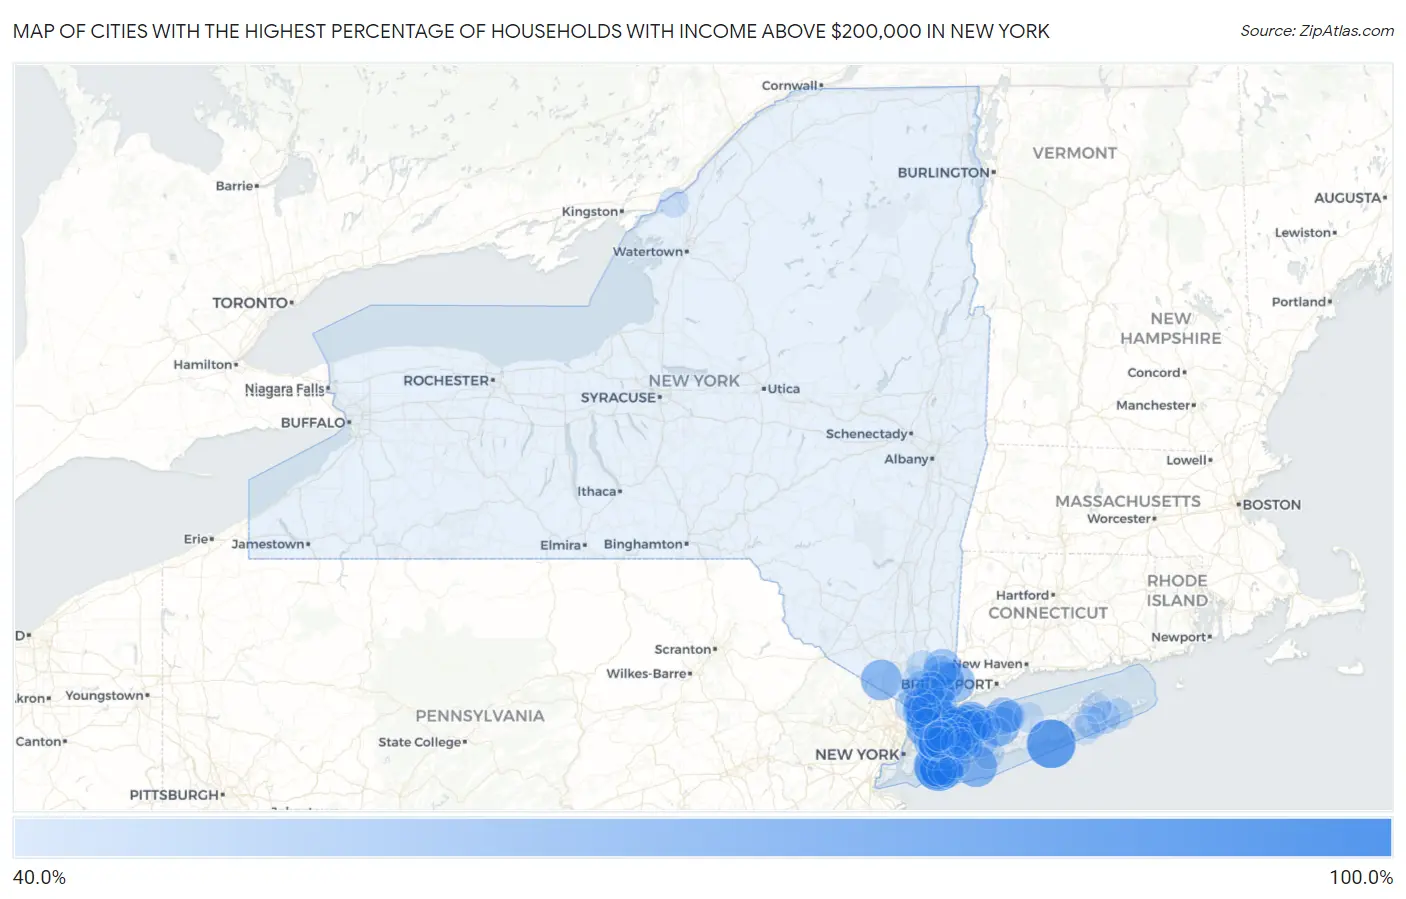
Map of Cities with the Highest Percentage of Households with Income Above $200,000 in New York
0.0%
100.0%
Cities with the Highest Percentage of Households with Income Above $200,000 in New York
| City | Households with Income > $200k | vs State | vs National | |
| 1. | Bard College | 85.5% | 15.2%(+70.3)#1 | 11.4%(+74.1)#26 |
| 2. | Hewlett Bay Park | 80.8% | 15.2%(+65.6)#2 | 11.4%(+69.4)#32 |
| 3. | West Hampton Dunes | 79.2% | 15.2%(+64.0)#3 | 11.4%(+67.8)#34 |
| 4. | Plandome Heights | 75.4% | 15.2%(+60.2)#4 | 11.4%(+64.0)#47 |
| 5. | Scarsdale | 74.3% | 15.2%(+59.1)#5 | 11.4%(+62.9)#52 |
| 6. | Brookville | 71.9% | 15.2%(+56.7)#6 | 11.4%(+60.5)#63 |
| 7. | Munsey Park | 70.8% | 15.2%(+55.6)#7 | 11.4%(+59.4)#69 |
| 8. | Woodsburgh | 70.6% | 15.2%(+55.4)#8 | 11.4%(+59.2)#71 |
| 9. | Laurel Hollow | 70.3% | 15.2%(+55.1)#9 | 11.4%(+58.9)#73 |
| 10. | Plandome | 70.0% | 15.2%(+54.8)#10 | 11.4%(+58.6)#75 |
| 11. | Sands Point | 67.4% | 15.2%(+52.2)#11 | 11.4%(+56.0)#95 |
| 12. | Hewlett Neck | 67.3% | 15.2%(+52.1)#12 | 11.4%(+55.9)#96 |
| 13. | Hewlett Harbor | 66.7% | 15.2%(+51.5)#13 | 11.4%(+55.3)#99 |
| 14. | East Hills | 66.6% | 15.2%(+51.4)#14 | 11.4%(+55.2)#102 |
| 15. | Gilgo | 65.0% | 15.2%(+49.8)#15 | 11.4%(+53.6)#114 |
| 16. | Huntington Bay | 63.4% | 15.2%(+48.2)#16 | 11.4%(+52.0)#132 |
| 17. | Tuxedo Park | 63.0% | 15.2%(+47.8)#17 | 11.4%(+51.6)#138 |
| 18. | Lattingtown | 62.6% | 15.2%(+47.4)#18 | 11.4%(+51.2)#143 |
| 19. | Pelham Manor | 62.2% | 15.2%(+47.0)#19 | 11.4%(+50.8)#146 |
| 20. | Old Westbury | 61.7% | 15.2%(+46.5)#20 | 11.4%(+50.3)#151 |
| 21. | Roslyn Estates | 61.5% | 15.2%(+46.3)#21 | 11.4%(+50.1)#154 |
| 22. | Scotts Corners | 61.1% | 15.2%(+45.9)#22 | 11.4%(+49.7)#162 |
| 23. | Oyster Bay Cove | 60.5% | 15.2%(+45.3)#23 | 11.4%(+49.1)#174 |
| 24. | Plandome Manor | 60.5% | 15.2%(+45.3)#24 | 11.4%(+49.1)#175 |
| 25. | Cove Neck | 60.4% | 15.2%(+45.2)#25 | 11.4%(+49.0)#177 |
| 26. | Lake Success | 60.3% | 15.2%(+45.1)#26 | 11.4%(+48.9)#178 |
| 27. | Upper Brookville | 60.1% | 15.2%(+44.9)#27 | 11.4%(+48.7)#183 |
| 28. | Bedford | 60.0% | 15.2%(+44.8)#28 | 11.4%(+48.6)#184 |
| 29. | Eatons Neck | 60.0% | 15.2%(+44.8)#29 | 11.4%(+48.6)#185 |
| 30. | Head Of The Harbor | 59.8% | 15.2%(+44.6)#30 | 11.4%(+48.4)#193 |
| 31. | Cold Spring Harbor | 59.6% | 15.2%(+44.4)#31 | 11.4%(+48.2)#198 |
| 32. | Flower Hill | 59.2% | 15.2%(+44.0)#32 | 11.4%(+47.8)#208 |
| 33. | Ardsley | 57.4% | 15.2%(+42.2)#33 | 11.4%(+46.0)#241 |
| 34. | Armonk | 57.4% | 15.2%(+42.2)#34 | 11.4%(+46.0)#242 |
| 35. | Old Field | 56.5% | 15.2%(+41.3)#35 | 11.4%(+45.1)#257 |
| 36. | Setauket | 56.2% | 15.2%(+41.0)#36 | 11.4%(+44.8)#267 |
| 37. | Lloyd Harbor | 55.8% | 15.2%(+40.6)#37 | 11.4%(+44.4)#277 |
| 38. | Golden S Bridge | 55.7% | 15.2%(+40.5)#38 | 11.4%(+44.3)#279 |
| 39. | Rye | 54.7% | 15.2%(+39.5)#39 | 11.4%(+43.3)#305 |
| 40. | Kensington | 54.4% | 15.2%(+39.2)#40 | 11.4%(+43.0)#317 |
| 41. | Mill Neck | 54.3% | 15.2%(+39.1)#41 | 11.4%(+42.9)#322 |
| 42. | Muttontown | 54.2% | 15.2%(+39.0)#42 | 11.4%(+42.8)#326 |
| 43. | East Williston | 54.0% | 15.2%(+38.8)#43 | 11.4%(+42.6)#333 |
| 44. | Roslyn Harbor | 53.2% | 15.2%(+38.0)#44 | 11.4%(+41.8)#354 |
| 45. | Centre Island | 53.0% | 15.2%(+37.8)#45 | 11.4%(+41.6)#366 |
| 46. | Larchmont | 52.8% | 15.2%(+37.6)#46 | 11.4%(+41.4)#369 |
| 47. | Dix Hills | 52.5% | 15.2%(+37.3)#47 | 11.4%(+41.1)#376 |
| 48. | Bronxville | 52.0% | 15.2%(+36.8)#48 | 11.4%(+40.6)#386 |
| 49. | Garden City | 51.2% | 15.2%(+36.0)#49 | 11.4%(+39.8)#412 |
| 50. | Briarcliff Manor | 51.2% | 15.2%(+36.0)#50 | 11.4%(+39.8)#413 |
| 51. | Bellerose | 51.2% | 15.2%(+36.0)#51 | 11.4%(+39.8)#414 |
| 52. | Matinecock | 50.4% | 15.2%(+35.2)#52 | 11.4%(+39.0)#435 |
| 53. | Katonah | 50.2% | 15.2%(+35.0)#53 | 11.4%(+38.8)#438 |
| 54. | Rye Brook | 50.0% | 15.2%(+34.8)#54 | 11.4%(+38.6)#442 |
| 55. | Searingtown | 49.7% | 15.2%(+34.5)#55 | 11.4%(+38.3)#465 |
| 56. | Oak Beach | 49.2% | 15.2%(+34.0)#56 | 11.4%(+37.8)#479 |
| 57. | Centerport | 49.0% | 15.2%(+33.8)#57 | 11.4%(+37.6)#482 |
| 58. | Halesite | 48.7% | 15.2%(+33.5)#58 | 11.4%(+37.3)#489 |
| 59. | Sparkill | 48.5% | 15.2%(+33.3)#59 | 11.4%(+37.1)#493 |
| 60. | Upper Nyack | 48.2% | 15.2%(+33.0)#60 | 11.4%(+36.8)#503 |
| 61. | Wainscott | 48.0% | 15.2%(+32.8)#61 | 11.4%(+36.6)#508 |
| 62. | Irvington | 47.8% | 15.2%(+32.6)#62 | 11.4%(+36.4)#511 |
| 63. | Lawrence | 47.7% | 15.2%(+32.5)#63 | 11.4%(+36.3)#513 |
| 64. | Old Brookville | 47.6% | 15.2%(+32.4)#64 | 11.4%(+36.2)#515 |
| 65. | North Hills | 47.5% | 15.2%(+32.3)#65 | 11.4%(+36.1)#518 |
| 66. | East Norwich | 47.4% | 15.2%(+32.2)#66 | 11.4%(+36.0)#519 |
| 67. | Water Mill | 47.2% | 15.2%(+32.0)#67 | 11.4%(+35.8)#531 |
| 68. | Saddle Rock | 46.8% | 15.2%(+31.6)#68 | 11.4%(+35.4)#548 |
| 69. | Old Bethpage | 46.7% | 15.2%(+31.5)#69 | 11.4%(+35.3)#555 |
| 70. | Russell Gardens | 46.0% | 15.2%(+30.8)#70 | 11.4%(+34.6)#578 |
| 71. | Poquott | 45.9% | 15.2%(+30.7)#71 | 11.4%(+34.5)#582 |
| 72. | Great Neck Estates | 45.7% | 15.2%(+30.5)#72 | 11.4%(+34.3)#586 |
| 73. | Crompond | 45.7% | 15.2%(+30.5)#73 | 11.4%(+34.3)#588 |
| 74. | Syosset | 45.4% | 15.2%(+30.2)#74 | 11.4%(+34.0)#596 |
| 75. | Sea Cliff | 45.3% | 15.2%(+30.1)#75 | 11.4%(+33.9)#599 |
| 76. | Belle Terre | 45.3% | 15.2%(+30.1)#76 | 11.4%(+33.9)#601 |
| 77. | Chappaqua | 44.8% | 15.2%(+29.6)#77 | 11.4%(+33.4)#619 |
| 78. | Merrick | 44.7% | 15.2%(+29.5)#78 | 11.4%(+33.3)#624 |
| 79. | Millwood | 44.7% | 15.2%(+29.5)#79 | 11.4%(+33.3)#628 |
| 80. | Port Washington | 44.6% | 15.2%(+29.4)#80 | 11.4%(+33.2)#630 |
| 81. | Amagansett | 44.2% | 15.2%(+29.0)#81 | 11.4%(+32.8)#646 |
| 82. | Manhasset | 44.0% | 15.2%(+28.8)#82 | 11.4%(+32.6)#654 |
| 83. | Brightwaters | 44.0% | 15.2%(+28.8)#83 | 11.4%(+32.6)#657 |
| 84. | Thornwood | 43.9% | 15.2%(+28.7)#84 | 11.4%(+32.5)#660 |
| 85. | Plainview | 43.7% | 15.2%(+28.5)#85 | 11.4%(+32.3)#668 |
| 86. | Hastings On Hudson | 43.7% | 15.2%(+28.5)#86 | 11.4%(+32.3)#672 |
| 87. | Greenville Cdp Westchester County | 43.6% | 15.2%(+28.4)#87 | 11.4%(+32.2)#674 |
| 88. | Pelham | 43.5% | 15.2%(+28.3)#88 | 11.4%(+32.1)#677 |
| 89. | Jericho | 43.0% | 15.2%(+27.8)#89 | 11.4%(+31.6)#692 |
| 90. | Village Of The Branch | 42.9% | 15.2%(+27.7)#90 | 11.4%(+31.5)#698 |
| 91. | Lido Beach | 42.8% | 15.2%(+27.6)#91 | 11.4%(+31.4)#705 |
| 92. | Shoreham | 42.6% | 15.2%(+27.4)#92 | 11.4%(+31.2)#708 |
| 93. | Fort Salonga | 42.4% | 15.2%(+27.2)#93 | 11.4%(+31.0)#713 |
| 94. | North Haven | 42.4% | 15.2%(+27.2)#94 | 11.4%(+31.0)#719 |
| 95. | Thousand Island Park | 42.4% | 15.2%(+27.2)#95 | 11.4%(+31.0)#720 |
| 96. | Southampton | 42.3% | 15.2%(+27.1)#96 | 11.4%(+30.9)#723 |
| 97. | Harbor Isle | 42.2% | 15.2%(+27.0)#97 | 11.4%(+30.8)#725 |
| 98. | Croton On Hudson | 42.0% | 15.2%(+26.8)#98 | 11.4%(+30.6)#736 |
| 99. | Hartsdale | 42.0% | 15.2%(+26.8)#99 | 11.4%(+30.6)#737 |
| 100. | Baxter Estates | 42.0% | 15.2%(+26.8)#100 | 11.4%(+30.6)#739 |
Common Questions
What are the Top 10 Cities with the Highest Percentage of Households with Income Above $200,000 in New York?
Top 10 Cities with the Highest Percentage of Households with Income Above $200,000 in New York are:
#1
80.8%
#2
79.2%
#3
75.4%
#4
74.3%
#5
71.9%
#6
70.8%
#7
70.6%
#8
70.3%
#9
70.0%
#10
67.4%
What city has the Highest Percentage of Households with Income Above $200,000 in New York?
Hewlett Bay Park has the Highest Percentage of Households with Income Above $200,000 in New York with 80.8%.
What is the Percentage of Households with Income Above $200,000 in the State of New York?
Percentage of Households with Income Above $200,000 in New York is 15.2%.
What is the Percentage of Households with Income Above $200,000 in the United States?
Percentage of Households with Income Above $200,000 in the United States is 11.4%.