Cities with the Highest Percentage of Households with Income Above $200,000 in Missouri
RELATED REPORTS & OPTIONS
Household Income | $200k+
Missouri
Compare Cities
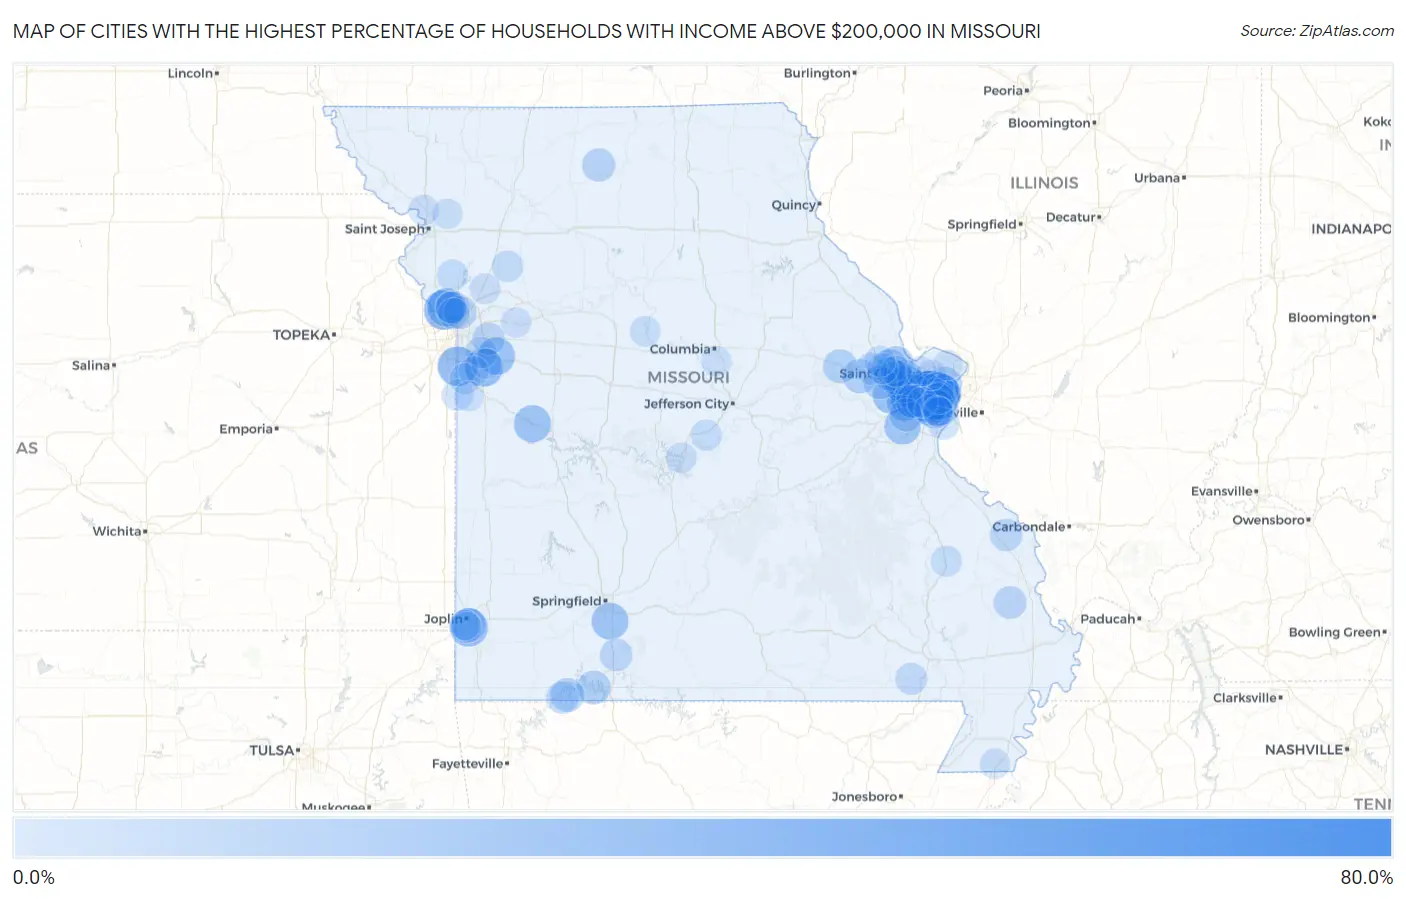
Map of Cities with the Highest Percentage of Households with Income Above $200,000 in Missouri
0.0%
80.0%
Cities with the Highest Percentage of Households with Income Above $200,000 in Missouri
| City | Households with Income > $200k | vs State | vs National | |
| 1. | Country Life Acres | 75.8% | 7.3%(+68.5)#1 | 11.4%(+64.4)#45 |
| 2. | Westwood | 62.9% | 7.3%(+55.6)#2 | 11.4%(+51.5)#141 |
| 3. | Ladue | 61.3% | 7.3%(+54.0)#3 | 11.4%(+49.9)#157 |
| 4. | Huntleigh | 58.3% | 7.3%(+51.0)#4 | 11.4%(+46.9)#224 |
| 5. | Frontenac | 56.8% | 7.3%(+49.5)#5 | 11.4%(+45.4)#249 |
| 6. | Clarkson Valley | 56.2% | 7.3%(+48.9)#6 | 11.4%(+44.8)#268 |
| 7. | Town And Country | 54.3% | 7.3%(+47.0)#7 | 11.4%(+42.9)#319 |
| 8. | Des Peres | 53.1% | 7.3%(+45.8)#8 | 11.4%(+41.7)#357 |
| 9. | Warson Woods | 42.5% | 7.3%(+35.2)#9 | 11.4%(+31.1)#710 |
| 10. | Loch Lloyd | 41.5% | 7.3%(+34.2)#10 | 11.4%(+30.1)#761 |
| 11. | Parkville | 41.3% | 7.3%(+34.0)#11 | 11.4%(+29.9)#770 |
| 12. | Lake Winnebago | 37.3% | 7.3%(+30.0)#12 | 11.4%(+25.9)#996 |
| 13. | Shoal Creek Estates | 36.7% | 7.3%(+29.4)#13 | 11.4%(+25.3)#1,039 |
| 14. | Weatherby Lake | 36.5% | 7.3%(+29.2)#14 | 11.4%(+25.1)#1,048 |
| 15. | New Market | 35.7% | 7.3%(+28.4)#15 | 11.4%(+24.3)#1,114 |
| 16. | Lake Lotawana | 34.5% | 7.3%(+27.2)#16 | 11.4%(+23.1)#1,210 |
| 17. | Glendale | 34.0% | 7.3%(+26.7)#17 | 11.4%(+22.6)#1,243 |
| 18. | Defiance | 34.0% | 7.3%(+26.7)#18 | 11.4%(+22.6)#1,248 |
| 19. | Hartwell | 33.3% | 7.3%(+26.0)#19 | 11.4%(+21.9)#1,316 |
| 20. | Clayton | 32.9% | 7.3%(+25.6)#20 | 11.4%(+21.5)#1,345 |
| 21. | Weldon Spring | 32.9% | 7.3%(+25.6)#21 | 11.4%(+21.5)#1,347 |
| 22. | Vibbard | 32.9% | 7.3%(+25.6)#22 | 11.4%(+21.5)#1,350 |
| 23. | Fremont Hills | 32.3% | 7.3%(+25.0)#23 | 11.4%(+20.9)#1,402 |
| 24. | Wildwood | 31.8% | 7.3%(+24.5)#24 | 11.4%(+20.4)#1,444 |
| 25. | Chesterfield | 31.7% | 7.3%(+24.4)#25 | 11.4%(+20.3)#1,456 |
| 26. | Labarque Creek | 30.8% | 7.3%(+23.5)#26 | 11.4%(+19.4)#1,536 |
| 27. | Sunset Hills | 29.8% | 7.3%(+22.5)#27 | 11.4%(+18.4)#1,637 |
| 28. | Grantwood Village | 29.6% | 7.3%(+22.3)#28 | 11.4%(+18.2)#1,659 |
| 29. | Crystal Lake Park | 29.0% | 7.3%(+21.7)#29 | 11.4%(+17.6)#1,712 |
| 30. | Weldon Spring Heights | 27.3% | 7.3%(+20.0)#30 | 11.4%(+15.9)#1,906 |
| 31. | Creve Coeur | 26.6% | 7.3%(+19.3)#31 | 11.4%(+15.2)#1,977 |
| 32. | Cottleville | 25.9% | 7.3%(+18.6)#32 | 11.4%(+14.5)#2,066 |
| 33. | St Paul | 25.7% | 7.3%(+18.4)#33 | 11.4%(+14.3)#2,092 |
| 34. | Josephville | 24.5% | 7.3%(+17.2)#34 | 11.4%(+13.1)#2,232 |
| 35. | Dardenne Prairie | 23.3% | 7.3%(+16.0)#35 | 11.4%(+11.9)#2,422 |
| 36. | Innsbrook | 23.3% | 7.3%(+16.0)#36 | 11.4%(+11.9)#2,431 |
| 37. | Webster Groves | 22.9% | 7.3%(+15.6)#37 | 11.4%(+11.5)#2,489 |
| 38. | Leawood | 22.8% | 7.3%(+15.5)#38 | 11.4%(+11.4)#2,511 |
| 39. | Bellerive Acres | 22.6% | 7.3%(+15.3)#39 | 11.4%(+11.2)#2,556 |
| 40. | Lake St Louis | 22.3% | 7.3%(+15.0)#40 | 11.4%(+10.9)#2,596 |
| 41. | Pendleton | 22.2% | 7.3%(+14.9)#41 | 11.4%(+10.8)#2,625 |
| 42. | Coney Island | 22.2% | 7.3%(+14.9)#42 | 11.4%(+10.8)#2,626 |
| 43. | Arrow Point | 21.6% | 7.3%(+14.3)#43 | 11.4%(+10.2)#2,743 |
| 44. | Kirkwood | 21.5% | 7.3%(+14.2)#44 | 11.4%(+10.1)#2,749 |
| 45. | Richmond Heights | 21.5% | 7.3%(+14.2)#45 | 11.4%(+10.1)#2,753 |
| 46. | New Melle | 21.3% | 7.3%(+14.0)#46 | 11.4%(+9.90)#2,807 |
| 47. | Ballwin | 21.1% | 7.3%(+13.8)#47 | 11.4%(+9.70)#2,827 |
| 48. | Lake Waukomis | 21.1% | 7.3%(+13.8)#48 | 11.4%(+9.70)#2,837 |
| 49. | Eureka | 20.3% | 7.3%(+13.0)#49 | 11.4%(+8.90)#2,975 |
| 50. | Ellisville | 20.0% | 7.3%(+12.7)#50 | 11.4%(+8.60)#3,031 |
| 51. | Osgood | 20.0% | 7.3%(+12.7)#51 | 11.4%(+8.60)#3,065 |
| 52. | Olivette | 19.9% | 7.3%(+12.6)#52 | 11.4%(+8.50)#3,075 |
| 53. | Stanton | 19.8% | 7.3%(+12.5)#53 | 11.4%(+8.40)#3,112 |
| 54. | Oakwood | 18.8% | 7.3%(+11.5)#54 | 11.4%(+7.40)#3,334 |
| 55. | Delta | 18.6% | 7.3%(+11.3)#55 | 11.4%(+7.20)#3,377 |
| 56. | Golden | 18.1% | 7.3%(+10.8)#56 | 11.4%(+6.70)#3,484 |
| 57. | Lake Tapawingo | 17.9% | 7.3%(+10.6)#57 | 11.4%(+6.50)#3,530 |
| 58. | Saddlebrooke | 17.9% | 7.3%(+10.6)#58 | 11.4%(+6.50)#3,536 |
| 59. | Oakland | 17.6% | 7.3%(+10.3)#59 | 11.4%(+6.20)#3,599 |
| 60. | Longtown | 17.5% | 7.3%(+10.2)#60 | 11.4%(+6.10)#3,624 |
| 61. | University City | 17.1% | 7.3%(+9.80)#61 | 11.4%(+5.70)#3,692 |
| 62. | Crestwood | 16.4% | 7.3%(+9.10)#62 | 11.4%(+5.00)#3,882 |
| 63. | Fairdealing | 15.9% | 7.3%(+8.60)#63 | 11.4%(+4.50)#4,015 |
| 64. | Brentwood | 15.8% | 7.3%(+8.50)#64 | 11.4%(+4.40)#4,026 |
| 65. | Foristell | 15.5% | 7.3%(+8.20)#65 | 11.4%(+4.10)#4,137 |
| 66. | Lee S Summit | 15.2% | 7.3%(+7.90)#66 | 11.4%(+3.80)#4,227 |
| 67. | Oakville | 14.4% | 7.3%(+7.10)#67 | 11.4%(+3.00)#4,487 |
| 68. | Elmira | 14.3% | 7.3%(+7.00)#68 | 11.4%(+2.90)#4,571 |
| 69. | Fenton | 14.1% | 7.3%(+6.80)#69 | 11.4%(+2.70)#4,610 |
| 70. | Platte Woods | 14.1% | 7.3%(+6.80)#70 | 11.4%(+2.70)#4,620 |
| 71. | West Line | 14.0% | 7.3%(+6.70)#71 | 11.4%(+2.60)#4,679 |
| 72. | Houston Lake | 13.9% | 7.3%(+6.60)#72 | 11.4%(+2.50)#4,718 |
| 73. | Redings Mill | 13.6% | 7.3%(+6.30)#73 | 11.4%(+2.20)#4,844 |
| 74. | Cherokee Pass | 13.3% | 7.3%(+6.00)#74 | 11.4%(+1.90)#4,953 |
| 75. | Ridgely | 13.3% | 7.3%(+6.00)#75 | 11.4%(+1.90)#4,955 |
| 76. | Eugene | 13.1% | 7.3%(+5.80)#76 | 11.4%(+1.70)#5,042 |
| 77. | Rock Hill | 13.0% | 7.3%(+5.70)#77 | 11.4%(+1.60)#5,062 |
| 78. | Riverview Estates | 12.9% | 7.3%(+5.60)#78 | 11.4%(+1.50)#5,132 |
| 79. | O Fallon | 12.8% | 7.3%(+5.50)#79 | 11.4%(+1.40)#5,138 |
| 80. | Wentzville | 12.8% | 7.3%(+5.50)#80 | 11.4%(+1.40)#5,140 |
| 81. | Flint Hill | 12.8% | 7.3%(+5.50)#81 | 11.4%(+1.40)#5,176 |
| 82. | Arrow Rock | 12.5% | 7.3%(+5.20)#82 | 11.4%(+1.10)#5,318 |
| 83. | Kearney | 11.9% | 7.3%(+4.60)#83 | 11.4%(+0.500)#5,572 |
| 84. | Holland | 11.7% | 7.3%(+4.40)#84 | 11.4%(+0.300)#5,697 |
| 85. | Manchester | 11.5% | 7.3%(+4.20)#85 | 11.4%(+0.100)#5,745 |
| 86. | Concord | 11.4% | 7.3%(+4.10)#86 | 11.4%(=0.000)#5,794 |
| 87. | Raintree Plantation | 11.1% | 7.3%(+3.80)#87 | 11.4%(-0.300)#5,923 |
| 88. | Bridgeton | 10.9% | 7.3%(+3.60)#88 | 11.4%(-0.500)#6,011 |
| 89. | Sappington | 10.9% | 7.3%(+3.60)#89 | 11.4%(-0.500)#6,019 |
| 90. | Lake Ozark | 10.9% | 7.3%(+3.60)#90 | 11.4%(-0.500)#6,032 |
| 91. | Amazonia | 10.9% | 7.3%(+3.60)#91 | 11.4%(-0.500)#6,050 |
| 92. | Cosby | 10.8% | 7.3%(+3.50)#92 | 11.4%(-0.600)#6,104 |
| 93. | Napoleon | 10.8% | 7.3%(+3.50)#93 | 11.4%(-0.600)#6,106 |
| 94. | Pierpont | 10.7% | 7.3%(+3.40)#94 | 11.4%(-0.700)#6,155 |
| 95. | Old Jamestown | 10.5% | 7.3%(+3.20)#95 | 11.4%(-0.900)#6,219 |
| 96. | Greenwood | 10.5% | 7.3%(+3.20)#96 | 11.4%(-0.900)#6,232 |
| 97. | Shoal Creek Drive | 10.5% | 7.3%(+3.20)#97 | 11.4%(-0.900)#6,250 |
| 98. | St Charles | 10.4% | 7.3%(+3.10)#98 | 11.4%(-1.000)#6,264 |
| 99. | Raymore | 10.0% | 7.3%(+2.70)#99 | 11.4%(-1.40)#6,495 |
| 100. | Freeman | 10.0% | 7.3%(+2.70)#100 | 11.4%(-1.40)#6,528 |
Common Questions
What are the Top 10 Cities with the Highest Percentage of Households with Income Above $200,000 in Missouri?
Top 10 Cities with the Highest Percentage of Households with Income Above $200,000 in Missouri are:
#1
75.8%
#2
62.9%
#3
61.3%
#4
58.3%
#5
56.8%
#6
56.2%
#7
54.3%
#8
53.1%
#9
42.5%
#10
41.5%
What city has the Highest Percentage of Households with Income Above $200,000 in Missouri?
Country Life Acres has the Highest Percentage of Households with Income Above $200,000 in Missouri with 75.8%.
What is the Percentage of Households with Income Above $200,000 in the State of Missouri?
Percentage of Households with Income Above $200,000 in Missouri is 7.3%.
What is the Percentage of Households with Income Above $200,000 in the United States?
Percentage of Households with Income Above $200,000 in the United States is 11.4%.