Cities with the Highest Percentage of Households with Income Above $200,000 in Minnesota
RELATED REPORTS & OPTIONS
Household Income | $200k+
Minnesota
Compare Cities
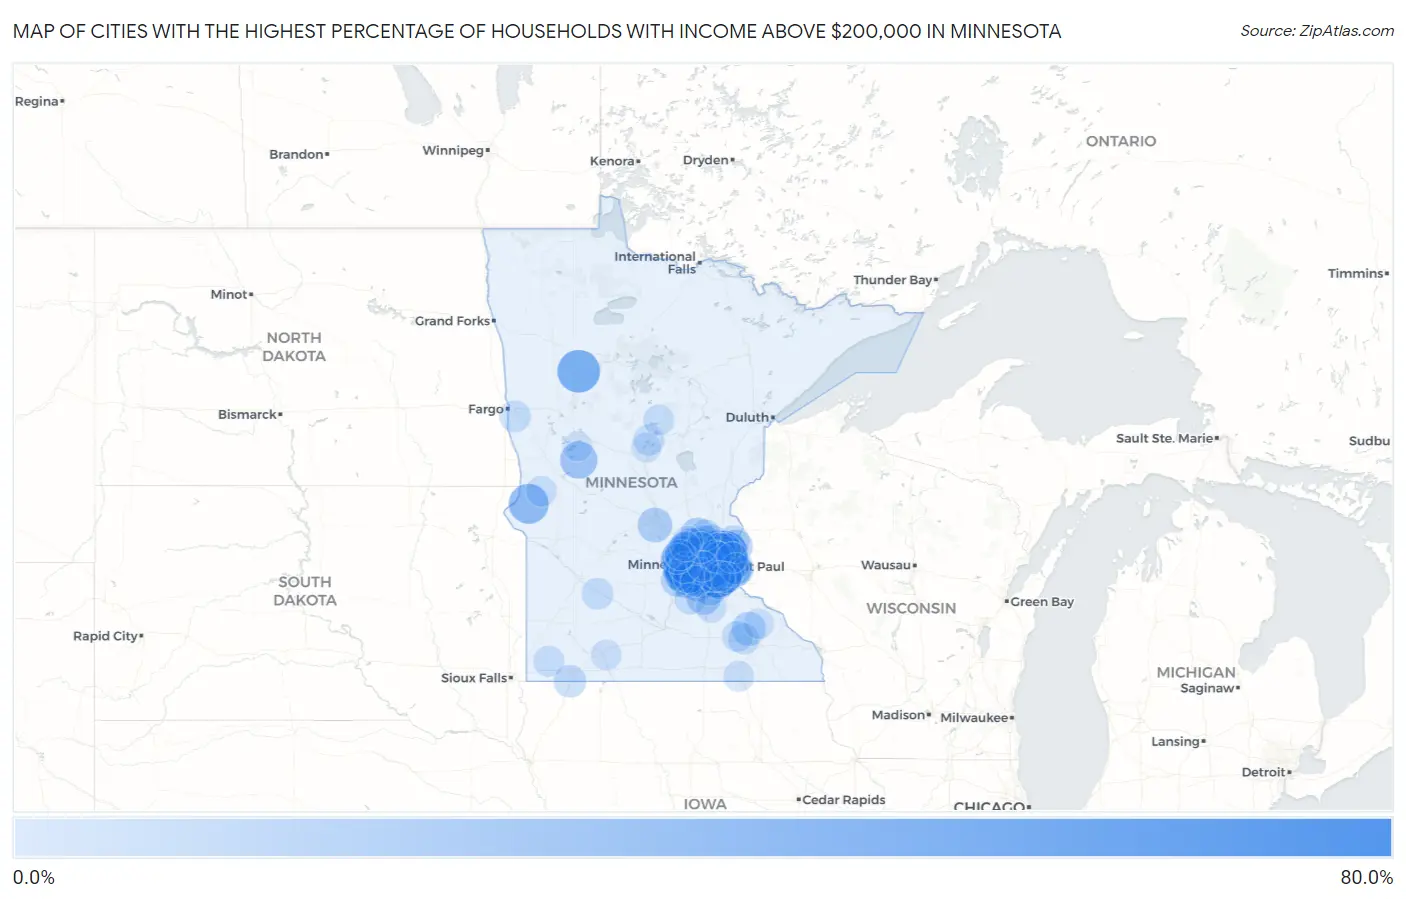
Map of Cities with the Highest Percentage of Households with Income Above $200,000 in Minnesota
0.0%
80.0%
Cities with the Highest Percentage of Households with Income Above $200,000 in Minnesota
| City | Households with Income > $200k | vs State | vs National | |
| 1. | Sunfish Lake | 64.9% | 11.9%(+53.0)#1 | 11.4%(+53.5)#116 |
| 2. | Minnetonka Beach | 63.5% | 11.9%(+51.6)#2 | 11.4%(+52.1)#130 |
| 3. | North Oaks | 56.4% | 11.9%(+44.5)#3 | 11.4%(+45.0)#262 |
| 4. | Dellwood | 54.8% | 11.9%(+42.9)#4 | 11.4%(+43.4)#303 |
| 5. | Woodland | 51.1% | 11.9%(+39.2)#5 | 11.4%(+39.7)#419 |
| 6. | Medina | 50.7% | 11.9%(+38.8)#6 | 11.4%(+39.3)#428 |
| 7. | St. John's University | 50.0% | 11.9%(+38.1)#7 | 11.4%(+38.6)#446 |
| 8. | Greenwood | 49.6% | 11.9%(+37.7)#8 | 11.4%(+38.2)#467 |
| 9. | Independence | 48.1% | 11.9%(+36.2)#9 | 11.4%(+36.7)#505 |
| 10. | Roy Lake | 46.7% | 11.9%(+34.8)#10 | 11.4%(+35.3)#559 |
| 11. | Orono | 43.6% | 11.9%(+31.7)#11 | 11.4%(+32.2)#675 |
| 12. | Victoria | 43.2% | 11.9%(+31.3)#12 | 11.4%(+31.8)#682 |
| 13. | Credit River | 43.1% | 11.9%(+31.2)#13 | 11.4%(+31.7)#689 |
| 14. | Shorewood | 42.3% | 11.9%(+30.4)#14 | 11.4%(+30.9)#722 |
| 15. | Deephaven | 41.2% | 11.9%(+29.3)#15 | 11.4%(+29.8)#773 |
| 16. | Lake Elmo | 40.5% | 11.9%(+28.6)#16 | 11.4%(+29.1)#797 |
| 17. | Dumont | 39.3% | 11.9%(+27.4)#17 | 11.4%(+27.9)#885 |
| 18. | Medicine Lake | 38.3% | 11.9%(+26.4)#18 | 11.4%(+26.9)#941 |
| 19. | Marion | 38.1% | 11.9%(+26.2)#19 | 11.4%(+26.7)#955 |
| 20. | Minnetrista | 37.2% | 11.9%(+25.3)#20 | 11.4%(+25.8)#1,001 |
| 21. | Tonka Bay | 37.0% | 11.9%(+25.1)#21 | 11.4%(+25.6)#1,020 |
| 22. | Grant | 36.0% | 11.9%(+24.1)#22 | 11.4%(+24.6)#1,078 |
| 23. | Pine Springs | 35.1% | 11.9%(+23.2)#23 | 11.4%(+23.7)#1,169 |
| 24. | Chanhassen | 33.8% | 11.9%(+21.9)#24 | 11.4%(+22.4)#1,265 |
| 25. | Vining | 32.3% | 11.9%(+20.4)#25 | 11.4%(+20.9)#1,406 |
| 26. | Edina | 32.1% | 11.9%(+20.2)#26 | 11.4%(+20.7)#1,418 |
| 27. | Dayton | 31.6% | 11.9%(+19.7)#27 | 11.4%(+20.2)#1,465 |
| 28. | Mahtomedi | 30.0% | 11.9%(+18.1)#28 | 11.4%(+18.6)#1,616 |
| 29. | Corcoran | 29.2% | 11.9%(+17.3)#29 | 11.4%(+17.8)#1,684 |
| 30. | Mendota Heights | 29.0% | 11.9%(+17.1)#30 | 11.4%(+17.6)#1,707 |
| 31. | Wayzata | 29.0% | 11.9%(+17.1)#31 | 11.4%(+17.6)#1,710 |
| 32. | Plymouth | 28.9% | 11.9%(+17.0)#32 | 11.4%(+17.5)#1,716 |
| 33. | Greenfield | 28.7% | 11.9%(+16.8)#33 | 11.4%(+17.3)#1,749 |
| 34. | Eden Prairie | 28.4% | 11.9%(+16.5)#34 | 11.4%(+17.0)#1,780 |
| 35. | Afton | 27.4% | 11.9%(+15.5)#35 | 11.4%(+16.0)#1,882 |
| 36. | Prior Lake | 27.0% | 11.9%(+15.1)#36 | 11.4%(+15.6)#1,935 |
| 37. | Rogers | 27.0% | 11.9%(+15.1)#37 | 11.4%(+15.6)#1,936 |
| 38. | St Marys Point | 26.6% | 11.9%(+14.7)#38 | 11.4%(+15.2)#1,988 |
| 39. | Gem Lake | 26.3% | 11.9%(+14.4)#39 | 11.4%(+14.9)#2,019 |
| 40. | Hanover | 26.1% | 11.9%(+14.2)#40 | 11.4%(+14.7)#2,046 |
| 41. | St Augusta | 26.0% | 11.9%(+14.1)#41 | 11.4%(+14.6)#2,057 |
| 42. | Elko New Market | 25.8% | 11.9%(+13.9)#42 | 11.4%(+14.4)#2,077 |
| 43. | Nowthen | 25.8% | 11.9%(+13.9)#43 | 11.4%(+14.4)#2,079 |
| 44. | Excelsior | 24.3% | 11.9%(+12.4)#44 | 11.4%(+12.9)#2,267 |
| 45. | Oronoco | 24.0% | 11.9%(+12.1)#45 | 11.4%(+12.6)#2,311 |
| 46. | Woodbury | 23.9% | 11.9%(+12.0)#46 | 11.4%(+12.5)#2,323 |
| 47. | Maple Grove | 23.9% | 11.9%(+12.0)#47 | 11.4%(+12.5)#2,324 |
| 48. | Birchwood Village | 23.6% | 11.9%(+11.7)#48 | 11.4%(+12.2)#2,385 |
| 49. | Savage | 23.5% | 11.9%(+11.6)#49 | 11.4%(+12.1)#2,389 |
| 50. | Lakeville | 23.4% | 11.9%(+11.5)#50 | 11.4%(+12.0)#2,404 |
| 51. | Carver | 23.3% | 11.9%(+11.4)#51 | 11.4%(+11.9)#2,425 |
| 52. | Ham Lake | 23.2% | 11.9%(+11.3)#52 | 11.4%(+11.8)#2,442 |
| 53. | Loretto | 23.2% | 11.9%(+11.3)#53 | 11.4%(+11.8)#2,454 |
| 54. | Minnetonka | 22.9% | 11.9%(+11.0)#54 | 11.4%(+11.5)#2,487 |
| 55. | Cologne | 22.8% | 11.9%(+10.9)#55 | 11.4%(+11.4)#2,509 |
| 56. | Rosemount | 22.7% | 11.9%(+10.8)#56 | 11.4%(+11.3)#2,515 |
| 57. | Golden Valley | 22.6% | 11.9%(+10.7)#57 | 11.4%(+11.2)#2,541 |
| 58. | Marine On St Croix | 22.3% | 11.9%(+10.4)#58 | 11.4%(+10.9)#2,610 |
| 59. | Arden Hills | 21.5% | 11.9%(+9.60)#59 | 11.4%(+10.1)#2,752 |
| 60. | Mendota | 20.4% | 11.9%(+8.50)#60 | 11.4%(+9.00)#2,964 |
| 61. | Lino Lakes | 20.1% | 11.9%(+8.20)#61 | 11.4%(+8.70)#3,012 |
| 62. | St Anthony City Hennepin And Ramsey Counties | 20.0% | 11.9%(+8.10)#62 | 11.4%(+8.60)#3,033 |
| 63. | Bigelow | 20.0% | 11.9%(+8.10)#63 | 11.4%(+8.60)#3,051 |
| 64. | Andover | 19.8% | 11.9%(+7.90)#64 | 11.4%(+8.40)#3,093 |
| 65. | Centerville | 19.0% | 11.9%(+7.10)#65 | 11.4%(+7.60)#3,273 |
| 66. | Scandia | 18.7% | 11.9%(+6.80)#66 | 11.4%(+7.30)#3,348 |
| 67. | Hugo | 18.6% | 11.9%(+6.70)#67 | 11.4%(+7.20)#3,362 |
| 68. | Eagan | 18.4% | 11.9%(+6.50)#68 | 11.4%(+7.00)#3,406 |
| 69. | Sabin | 18.3% | 11.9%(+6.40)#69 | 11.4%(+6.90)#3,435 |
| 70. | Delhi | 18.2% | 11.9%(+6.30)#70 | 11.4%(+6.80)#3,466 |
| 71. | Shoreview | 18.0% | 11.9%(+6.10)#71 | 11.4%(+6.60)#3,487 |
| 72. | Vadnais Heights | 18.0% | 11.9%(+6.10)#72 | 11.4%(+6.60)#3,490 |
| 73. | New Prague | 17.8% | 11.9%(+5.90)#73 | 11.4%(+6.40)#3,547 |
| 74. | Byron | 17.8% | 11.9%(+5.90)#74 | 11.4%(+6.40)#3,551 |
| 75. | Oak Grove | 17.6% | 11.9%(+5.70)#75 | 11.4%(+6.20)#3,594 |
| 76. | Lake St Croix Beach | 17.4% | 11.9%(+5.50)#76 | 11.4%(+6.00)#3,640 |
| 77. | Waconia | 17.3% | 11.9%(+5.40)#77 | 11.4%(+5.90)#3,653 |
| 78. | Nisswa | 17.3% | 11.9%(+5.40)#78 | 11.4%(+5.90)#3,663 |
| 79. | Chaska | 17.1% | 11.9%(+5.20)#79 | 11.4%(+5.70)#3,694 |
| 80. | Champlin | 17.0% | 11.9%(+5.10)#80 | 11.4%(+5.60)#3,723 |
| 81. | Cottage Grove | 16.9% | 11.9%(+5.00)#81 | 11.4%(+5.50)#3,739 |
| 82. | Mantorville | 16.9% | 11.9%(+5.00)#82 | 11.4%(+5.50)#3,745 |
| 83. | Mound | 16.7% | 11.9%(+4.80)#83 | 11.4%(+5.30)#3,783 |
| 84. | Kenneth | 16.7% | 11.9%(+4.80)#84 | 11.4%(+5.30)#3,802 |
| 85. | Manhattan Beach | 16.7% | 11.9%(+4.80)#85 | 11.4%(+5.30)#3,809 |
| 86. | Shakopee | 16.6% | 11.9%(+4.70)#86 | 11.4%(+5.20)#3,812 |
| 87. | Stillwater | 16.5% | 11.9%(+4.60)#87 | 11.4%(+5.10)#3,854 |
| 88. | Norcross | 16.3% | 11.9%(+4.40)#88 | 11.4%(+4.90)#3,918 |
| 89. | Dundas | 15.9% | 11.9%(+4.00)#89 | 11.4%(+4.50)#4,004 |
| 90. | Adams | 15.9% | 11.9%(+4.00)#90 | 11.4%(+4.50)#4,012 |
| 91. | Hammond | 15.8% | 11.9%(+3.90)#91 | 11.4%(+4.40)#4,049 |
| 92. | Fish Lake | 15.8% | 11.9%(+3.90)#92 | 11.4%(+4.40)#4,052 |
| 93. | Inver Grove Heights | 15.5% | 11.9%(+3.60)#93 | 11.4%(+4.10)#4,118 |
| 94. | St Louis Park | 15.4% | 11.9%(+3.50)#94 | 11.4%(+4.00)#4,144 |
| 95. | Otsego | 15.3% | 11.9%(+3.40)#95 | 11.4%(+3.90)#4,191 |
| 96. | Delano | 14.9% | 11.9%(+3.00)#96 | 11.4%(+3.50)#4,321 |
| 97. | Ottertail | 14.9% | 11.9%(+3.00)#97 | 11.4%(+3.50)#4,341 |
| 98. | Rockford | 14.8% | 11.9%(+2.90)#98 | 11.4%(+3.40)#4,364 |
| 99. | East Gull Lake | 14.7% | 11.9%(+2.80)#99 | 11.4%(+3.30)#4,400 |
| 100. | St Michael | 14.6% | 11.9%(+2.70)#100 | 11.4%(+3.20)#4,423 |
Common Questions
What are the Top 10 Cities with the Highest Percentage of Households with Income Above $200,000 in Minnesota?
Top 10 Cities with the Highest Percentage of Households with Income Above $200,000 in Minnesota are:
#1
64.9%
#2
63.5%
#3
56.4%
#4
54.8%
#5
51.1%
#6
50.7%
#7
49.6%
#8
48.1%
#9
46.7%
#10
43.6%
What city has the Highest Percentage of Households with Income Above $200,000 in Minnesota?
Sunfish Lake has the Highest Percentage of Households with Income Above $200,000 in Minnesota with 64.9%.
What is the Percentage of Households with Income Above $200,000 in the State of Minnesota?
Percentage of Households with Income Above $200,000 in Minnesota is 11.9%.
What is the Percentage of Households with Income Above $200,000 in the United States?
Percentage of Households with Income Above $200,000 in the United States is 11.4%.