Cities with the Highest Percentage of Households with Income Above $200,000 in Nebraska
RELATED REPORTS & OPTIONS
Household Income | $200k+
Nebraska
Compare Cities
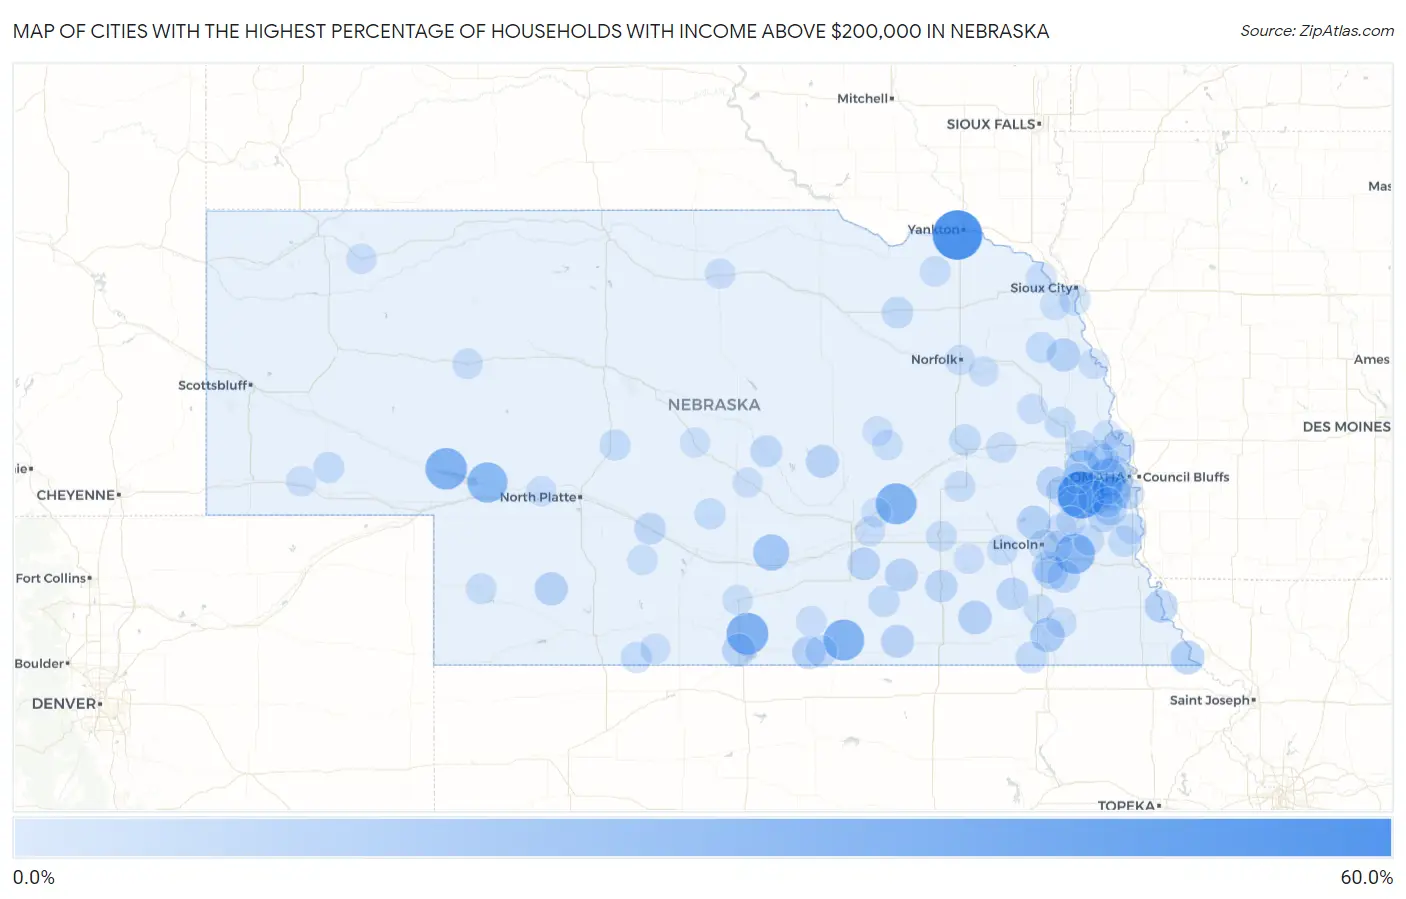
Map of Cities with the Highest Percentage of Households with Income Above $200,000 in Nebraska
0.0%
60.0%
Cities with the Highest Percentage of Households with Income Above $200,000 in Nebraska
| City | Households with Income > $200k | vs State | vs National | |
| 1. | Aten | 56.7% | 7.8%(+48.9)#1 | 11.4%(+45.3)#254 |
| 2. | Wann | 50.0% | 7.8%(+42.2)#2 | 11.4%(+38.6)#450 |
| 3. | Melia | 50.0% | 7.8%(+42.2)#3 | 11.4%(+38.6)#451 |
| 4. | Huntley | 35.7% | 7.8%(+27.9)#4 | 11.4%(+24.3)#1,112 |
| 5. | Belmar | 34.7% | 7.8%(+26.9)#5 | 11.4%(+23.3)#1,198 |
| 6. | Overland | 33.3% | 7.8%(+25.5)#6 | 11.4%(+21.9)#1,311 |
| 7. | Cowles | 33.3% | 7.8%(+25.5)#7 | 11.4%(+21.9)#1,320 |
| 8. | Keystone | 31.3% | 7.8%(+23.5)#8 | 11.4%(+19.9)#1,499 |
| 9. | Woodland Hills | 30.6% | 7.8%(+22.8)#9 | 11.4%(+19.2)#1,562 |
| 10. | Boys Town | 25.0% | 7.8%(+17.2)#10 | 11.4%(+13.6)#2,166 |
| 11. | Glenwood | 21.2% | 7.8%(+13.4)#11 | 11.4%(+9.80)#2,823 |
| 12. | Valley | 17.8% | 7.8%(+10.0)#12 | 11.4%(+6.40)#3,553 |
| 13. | Holmesville | 16.1% | 7.8%(+8.30)#13 | 11.4%(+4.70)#3,967 |
| 14. | Gretna | 15.6% | 7.8%(+7.80)#14 | 11.4%(+4.20)#4,095 |
| 15. | Papillion | 14.6% | 7.8%(+6.80)#15 | 11.4%(+3.20)#4,422 |
| 16. | Rulo | 14.5% | 7.8%(+6.70)#16 | 11.4%(+3.10)#4,476 |
| 17. | Cheney | 14.3% | 7.8%(+6.50)#17 | 11.4%(+2.90)#4,562 |
| 18. | Raymond | 14.1% | 7.8%(+6.30)#18 | 11.4%(+2.70)#4,627 |
| 19. | Daykin | 14.1% | 7.8%(+6.30)#19 | 11.4%(+2.70)#4,633 |
| 20. | Hickman | 13.5% | 7.8%(+5.70)#20 | 11.4%(+2.10)#4,870 |
| 21. | Cedar Creek | 13.5% | 7.8%(+5.70)#21 | 11.4%(+2.10)#4,880 |
| 22. | Rosalie | 13.3% | 7.8%(+5.50)#22 | 11.4%(+1.90)#4,952 |
| 23. | Hayes Center | 13.2% | 7.8%(+5.40)#23 | 11.4%(+1.80)#4,996 |
| 24. | Riverton | 13.2% | 7.8%(+5.40)#24 | 11.4%(+1.80)#5,001 |
| 25. | Brownville | 12.9% | 7.8%(+5.10)#25 | 11.4%(+1.50)#5,130 |
| 26. | Saronville | 12.5% | 7.8%(+4.70)#26 | 11.4%(+1.10)#5,313 |
| 27. | Cotesfield | 12.5% | 7.8%(+4.70)#27 | 11.4%(+1.10)#5,319 |
| 28. | Nora | 12.5% | 7.8%(+4.70)#28 | 11.4%(+1.10)#5,321 |
| 29. | Alma | 12.2% | 7.8%(+4.40)#29 | 11.4%(+0.800)#5,443 |
| 30. | Fort Calhoun | 12.1% | 7.8%(+4.30)#30 | 11.4%(+0.700)#5,498 |
| 31. | Trumbull | 11.9% | 7.8%(+4.10)#31 | 11.4%(+0.500)#5,596 |
| 32. | Panama | 11.7% | 7.8%(+3.90)#32 | 11.4%(+0.300)#5,694 |
| 33. | Geneva | 10.6% | 7.8%(+2.80)#33 | 11.4%(-0.800)#6,192 |
| 34. | Wahoo | 10.5% | 7.8%(+2.70)#34 | 11.4%(-0.900)#6,234 |
| 35. | Louisville | 10.5% | 7.8%(+2.70)#35 | 11.4%(-0.900)#6,242 |
| 36. | Wilber | 10.2% | 7.8%(+2.40)#36 | 11.4%(-1.20)#6,412 |
| 37. | Roca | 10.1% | 7.8%(+2.30)#37 | 11.4%(-1.30)#6,485 |
| 38. | Inavale | 10.0% | 7.8%(+2.20)#38 | 11.4%(-1.40)#6,544 |
| 39. | Gothenburg | 9.8% | 7.8%(+2.00)#39 | 11.4%(-1.60)#6,652 |
| 40. | Arcadia | 9.7% | 7.8%(+1.90)#40 | 11.4%(-1.70)#6,748 |
| 41. | Arlington | 9.6% | 7.8%(+1.80)#41 | 11.4%(-1.80)#6,784 |
| 42. | Brunswick | 9.2% | 7.8%(+1.40)#42 | 11.4%(-2.20)#7,086 |
| 43. | Omaha | 8.8% | 7.8%(+1.00)#43 | 11.4%(-2.60)#7,281 |
| 44. | Fairfield | 8.8% | 7.8%(+1.00)#44 | 11.4%(-2.60)#7,337 |
| 45. | Odell | 8.8% | 7.8%(+1.00)#45 | 11.4%(-2.60)#7,339 |
| 46. | Bennington | 8.7% | 7.8%(+0.900)#46 | 11.4%(-2.70)#7,392 |
| 47. | Lakeview | 8.5% | 7.8%(+0.700)#47 | 11.4%(-2.90)#7,567 |
| 48. | Nehawka | 8.1% | 7.8%(+0.300)#48 | 11.4%(-3.30)#7,893 |
| 49. | Elmwood | 8.0% | 7.8%(+0.200)#49 | 11.4%(-3.40)#7,955 |
| 50. | Eddyville | 8.0% | 7.8%(+0.200)#50 | 11.4%(-3.40)#7,979 |
| 51. | Dakota City | 7.9% | 7.8%(+0.100)#51 | 11.4%(-3.50)#8,019 |
| 52. | Hooper | 7.9% | 7.8%(+0.100)#52 | 11.4%(-3.50)#8,036 |
| 53. | Lebanon | 7.7% | 7.8%(-0.100)#53 | 11.4%(-3.70)#8,219 |
| 54. | Gandy | 7.7% | 7.8%(-0.100)#54 | 11.4%(-3.70)#8,226 |
| 55. | Pender | 7.6% | 7.8%(-0.200)#55 | 11.4%(-3.80)#8,288 |
| 56. | Gurley | 7.6% | 7.8%(-0.200)#56 | 11.4%(-3.80)#8,309 |
| 57. | Imperial | 7.5% | 7.8%(-0.300)#57 | 11.4%(-3.90)#8,361 |
| 58. | La Vista | 7.3% | 7.8%(-0.500)#58 | 11.4%(-4.10)#8,516 |
| 59. | Yutan | 7.3% | 7.8%(-0.500)#59 | 11.4%(-4.10)#8,550 |
| 60. | Shelby | 7.2% | 7.8%(-0.600)#60 | 11.4%(-4.20)#8,649 |
| 61. | Lincoln | 7.1% | 7.8%(-0.700)#61 | 11.4%(-4.30)#8,666 |
| 62. | York | 7.0% | 7.8%(-0.800)#62 | 11.4%(-4.40)#8,791 |
| 63. | Waverly | 7.0% | 7.8%(-0.800)#63 | 11.4%(-4.40)#8,800 |
| 64. | Milford | 6.9% | 7.8%(-0.900)#64 | 11.4%(-4.50)#8,908 |
| 65. | Ponca | 6.9% | 7.8%(-0.900)#65 | 11.4%(-4.50)#8,942 |
| 66. | Bellevue | 6.8% | 7.8%(-1.000)#66 | 11.4%(-4.60)#8,974 |
| 67. | Bloomfield | 6.8% | 7.8%(-1.000)#67 | 11.4%(-4.60)#9,060 |
| 68. | Hyannis | 6.7% | 7.8%(-1.10)#68 | 11.4%(-4.70)#9,203 |
| 69. | Schuyler | 6.6% | 7.8%(-1.20)#69 | 11.4%(-4.80)#9,243 |
| 70. | Campbell | 6.5% | 7.8%(-1.30)#70 | 11.4%(-4.90)#9,410 |
| 71. | Belgrade | 6.5% | 7.8%(-1.30)#71 | 11.4%(-4.90)#9,417 |
| 72. | Decatur | 6.4% | 7.8%(-1.40)#72 | 11.4%(-5.00)#9,514 |
| 73. | Murray | 6.4% | 7.8%(-1.40)#73 | 11.4%(-5.00)#9,517 |
| 74. | Washington | 6.4% | 7.8%(-1.40)#74 | 11.4%(-5.00)#9,521 |
| 75. | Sutherland | 6.3% | 7.8%(-1.50)#75 | 11.4%(-5.10)#9,599 |
| 76. | Hay Springs | 6.3% | 7.8%(-1.50)#76 | 11.4%(-5.10)#9,615 |
| 77. | Bassett | 6.3% | 7.8%(-1.50)#77 | 11.4%(-5.10)#9,624 |
| 78. | Cordova | 6.3% | 7.8%(-1.50)#78 | 11.4%(-5.10)#9,663 |
| 79. | Filley | 6.3% | 7.8%(-1.50)#79 | 11.4%(-5.10)#9,665 |
| 80. | Norfolk | 6.1% | 7.8%(-1.70)#80 | 11.4%(-5.30)#9,788 |
| 81. | Chalco | 6.1% | 7.8%(-1.70)#81 | 11.4%(-5.30)#9,804 |
| 82. | Holdrege | 6.1% | 7.8%(-1.70)#82 | 11.4%(-5.30)#9,818 |
| 83. | Farnam | 6.1% | 7.8%(-1.70)#83 | 11.4%(-5.30)#9,895 |
| 84. | Ithaca | 6.1% | 7.8%(-1.70)#84 | 11.4%(-5.30)#9,897 |
| 85. | Wilsonville | 6.1% | 7.8%(-1.70)#85 | 11.4%(-5.30)#9,904 |
| 86. | Snyder | 6.0% | 7.8%(-1.80)#86 | 11.4%(-5.40)#10,018 |
| 87. | Potter | 6.0% | 7.8%(-1.80)#87 | 11.4%(-5.40)#10,022 |
| 88. | Walton | 5.9% | 7.8%(-1.90)#88 | 11.4%(-5.50)#10,140 |
| 89. | Phillips | 5.9% | 7.8%(-1.90)#89 | 11.4%(-5.50)#10,145 |
| 90. | Stanton | 5.8% | 7.8%(-2.00)#90 | 11.4%(-5.60)#10,231 |
| 91. | Springfield | 5.8% | 7.8%(-2.00)#91 | 11.4%(-5.60)#10,235 |
| 92. | Merna | 5.8% | 7.8%(-2.00)#92 | 11.4%(-5.60)#10,282 |
| 93. | Mason City | 5.8% | 7.8%(-2.00)#93 | 11.4%(-5.60)#10,301 |
| 94. | Cedar Rapids | 5.7% | 7.8%(-2.10)#94 | 11.4%(-5.70)#10,399 |
| 95. | Chapman | 5.6% | 7.8%(-2.20)#95 | 11.4%(-5.80)#10,572 |
| 96. | Pickrell | 5.6% | 7.8%(-2.20)#96 | 11.4%(-5.80)#10,579 |
| 97. | Hubbard | 5.6% | 7.8%(-2.20)#97 | 11.4%(-5.80)#10,584 |
| 98. | Memphis | 5.6% | 7.8%(-2.20)#98 | 11.4%(-5.80)#10,595 |
| 99. | Greenwood | 5.5% | 7.8%(-2.30)#99 | 11.4%(-5.90)#10,716 |
| 100. | Blair | 5.4% | 7.8%(-2.40)#100 | 11.4%(-6.00)#10,770 |
Common Questions
What are the Top 10 Cities with the Highest Percentage of Households with Income Above $200,000 in Nebraska?
Top 10 Cities with the Highest Percentage of Households with Income Above $200,000 in Nebraska are:
What city has the Highest Percentage of Households with Income Above $200,000 in Nebraska?
Aten has the Highest Percentage of Households with Income Above $200,000 in Nebraska with 56.7%.
What is the Percentage of Households with Income Above $200,000 in the State of Nebraska?
Percentage of Households with Income Above $200,000 in Nebraska is 7.8%.
What is the Percentage of Households with Income Above $200,000 in the United States?
Percentage of Households with Income Above $200,000 in the United States is 11.4%.