Cities with the Highest Percentage of Households with Income Above $200,000 in Illinois
RELATED REPORTS & OPTIONS
Household Income | $200k+
Illinois
Compare Cities
Map of Cities with the Highest Percentage of Households with Income Above $200,000 in Illinois
0.0%
100.0%
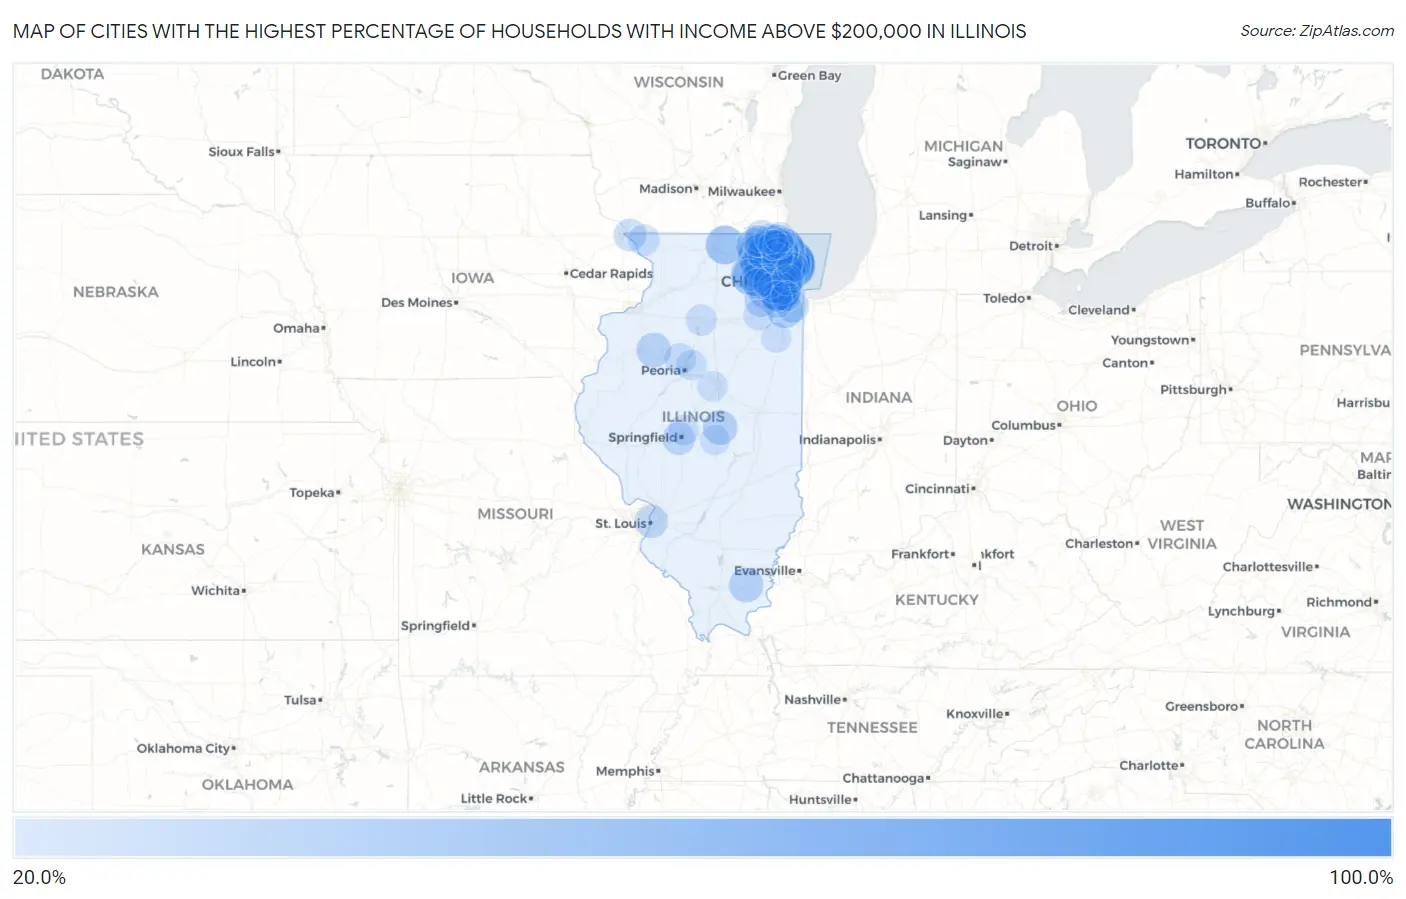
Cities with the Highest Percentage of Households with Income Above $200,000 in Illinois
| City | Households with Income > $200k | vs State | vs National | |
| 1. | Triumph | 82.6% | 12.1%(+70.5)#1 | 11.4%(+71.2)#29 |
| 2. | East Lynn | 69.4% | 12.1%(+57.3)#2 | 11.4%(+58.0)#83 |
| 3. | Kildeer | 67.7% | 12.1%(+55.6)#3 | 11.4%(+56.3)#94 |
| 4. | Winnetka | 64.0% | 12.1%(+51.9)#4 | 11.4%(+52.6)#125 |
| 5. | Kenilworth | 62.9% | 12.1%(+50.8)#5 | 11.4%(+51.5)#140 |
| 6. | Plum Valley | 61.1% | 12.1%(+49.0)#6 | 11.4%(+49.7)#163 |
| 7. | Golf | 59.8% | 12.1%(+47.7)#7 | 11.4%(+48.4)#194 |
| 8. | Riverwoods | 59.4% | 12.1%(+47.3)#8 | 11.4%(+48.0)#204 |
| 9. | Hinsdale | 58.4% | 12.1%(+46.3)#9 | 11.4%(+47.0)#221 |
| 10. | Long Grove | 57.7% | 12.1%(+45.6)#10 | 11.4%(+46.3)#234 |
| 11. | Hawthorn Woods | 55.3% | 12.1%(+43.2)#11 | 11.4%(+43.9)#283 |
| 12. | Glencoe | 53.6% | 12.1%(+41.5)#12 | 11.4%(+42.2)#344 |
| 13. | South Barrington | 53.4% | 12.1%(+41.3)#13 | 11.4%(+42.0)#348 |
| 14. | Inverness | 53.0% | 12.1%(+40.9)#14 | 11.4%(+41.6)#363 |
| 15. | Trout Valley | 52.8% | 12.1%(+40.7)#15 | 11.4%(+41.4)#370 |
| 16. | North Barrington | 51.6% | 12.1%(+39.5)#16 | 11.4%(+40.2)#402 |
| 17. | Lake Forest | 51.1% | 12.1%(+39.0)#17 | 11.4%(+39.7)#415 |
| 18. | Western Springs | 49.7% | 12.1%(+37.6)#18 | 11.4%(+38.3)#462 |
| 19. | Argyle | 48.1% | 12.1%(+36.0)#19 | 11.4%(+36.7)#507 |
| 20. | Lake Bluff | 47.3% | 12.1%(+35.2)#20 | 11.4%(+35.9)#524 |
| 21. | Wilmette | 46.6% | 12.1%(+34.5)#21 | 11.4%(+35.2)#560 |
| 22. | Campton Hills | 45.5% | 12.1%(+33.4)#22 | 11.4%(+34.1)#593 |
| 23. | Barrington Hills | 45.0% | 12.1%(+32.9)#23 | 11.4%(+33.6)#610 |
| 24. | Deerfield | 44.3% | 12.1%(+32.2)#24 | 11.4%(+32.9)#640 |
| 25. | Burr Ridge | 43.7% | 12.1%(+31.6)#25 | 11.4%(+32.3)#671 |
| 26. | Deer Park | 41.6% | 12.1%(+29.5)#26 | 11.4%(+30.2)#757 |
| 27. | Timberlane | 41.1% | 12.1%(+29.0)#27 | 11.4%(+29.7)#778 |
| 28. | Bannockburn | 41.0% | 12.1%(+28.9)#28 | 11.4%(+29.6)#781 |
| 29. | Highland Park | 40.5% | 12.1%(+28.4)#29 | 11.4%(+29.1)#795 |
| 30. | River Forest | 40.4% | 12.1%(+28.3)#30 | 11.4%(+29.0)#802 |
| 31. | Oak Brook | 40.4% | 12.1%(+28.3)#31 | 11.4%(+29.0)#803 |
| 32. | Northfield | 40.3% | 12.1%(+28.2)#32 | 11.4%(+28.9)#809 |
| 33. | Northbrook | 40.1% | 12.1%(+28.0)#33 | 11.4%(+28.7)#822 |
| 34. | Lincolnshire | 39.9% | 12.1%(+27.8)#34 | 11.4%(+28.5)#842 |
| 35. | Green Oaks | 39.7% | 12.1%(+27.6)#35 | 11.4%(+28.3)#853 |
| 36. | Libertyville | 39.6% | 12.1%(+27.5)#36 | 11.4%(+28.2)#856 |
| 37. | Barrington | 38.1% | 12.1%(+26.0)#37 | 11.4%(+26.7)#952 |
| 38. | Mettawa | 36.7% | 12.1%(+24.6)#38 | 11.4%(+25.3)#1,038 |
| 39. | Tower Lakes | 35.5% | 12.1%(+23.4)#39 | 11.4%(+24.1)#1,131 |
| 40. | Frankfort | 35.1% | 12.1%(+23.0)#40 | 11.4%(+23.7)#1,163 |
| 41. | Park Ridge | 34.8% | 12.1%(+22.7)#41 | 11.4%(+23.4)#1,189 |
| 42. | La Grange | 34.5% | 12.1%(+22.4)#42 | 11.4%(+23.1)#1,207 |
| 43. | Elmhurst | 33.5% | 12.1%(+21.4)#43 | 11.4%(+22.1)#1,284 |
| 44. | Clarendon Hills | 33.5% | 12.1%(+21.4)#44 | 11.4%(+22.1)#1,286 |
| 45. | Naperville | 33.3% | 12.1%(+21.2)#45 | 11.4%(+21.9)#1,301 |
| 46. | Glenview | 33.3% | 12.1%(+21.2)#46 | 11.4%(+21.9)#1,302 |
| 47. | Lake Barrington | 33.3% | 12.1%(+21.2)#47 | 11.4%(+21.9)#1,306 |
| 48. | Indian Creek | 33.3% | 12.1%(+21.2)#48 | 11.4%(+21.9)#1,310 |
| 49. | Bull Valley | 33.1% | 12.1%(+21.0)#49 | 11.4%(+21.7)#1,332 |
| 50. | Glen Ellyn | 32.2% | 12.1%(+20.1)#50 | 11.4%(+20.8)#1,409 |
| 51. | Forsyth | 31.6% | 12.1%(+19.5)#51 | 11.4%(+20.2)#1,468 |
| 52. | Oak Run | 31.6% | 12.1%(+19.5)#52 | 11.4%(+20.2)#1,469 |
| 53. | Muddy | 31.3% | 12.1%(+19.2)#53 | 11.4%(+19.9)#1,498 |
| 54. | Riverside | 31.1% | 12.1%(+19.0)#54 | 11.4%(+19.7)#1,508 |
| 55. | Sleepy Hollow | 31.1% | 12.1%(+19.0)#55 | 11.4%(+19.7)#1,511 |
| 56. | Wayne | 29.9% | 12.1%(+17.8)#56 | 11.4%(+18.5)#1,631 |
| 57. | Palos Park | 29.8% | 12.1%(+17.7)#57 | 11.4%(+18.4)#1,641 |
| 58. | Plainfield | 29.3% | 12.1%(+17.2)#58 | 11.4%(+17.9)#1,679 |
| 59. | Third Lake | 28.9% | 12.1%(+16.8)#59 | 11.4%(+17.5)#1,726 |
| 60. | Grandwood Park | 28.5% | 12.1%(+16.4)#60 | 11.4%(+17.1)#1,772 |
| 61. | Brooklyn | 28.4% | 12.1%(+16.3)#61 | 11.4%(+17.0)#1,789 |
| 62. | Geneva | 28.0% | 12.1%(+15.9)#62 | 11.4%(+16.6)#1,811 |
| 63. | Lake Zurich | 27.8% | 12.1%(+15.7)#63 | 11.4%(+16.4)#1,836 |
| 64. | Port Barrington | 27.7% | 12.1%(+15.6)#64 | 11.4%(+16.3)#1,855 |
| 65. | Flossmoor | 27.5% | 12.1%(+15.4)#65 | 11.4%(+16.1)#1,869 |
| 66. | Leland Grove | 27.2% | 12.1%(+15.1)#66 | 11.4%(+15.8)#1,916 |
| 67. | Prairie Grove | 27.1% | 12.1%(+15.0)#67 | 11.4%(+15.7)#1,927 |
| 68. | Knollwood | 26.9% | 12.1%(+14.8)#68 | 11.4%(+15.5)#1,949 |
| 69. | Baileyville | 26.8% | 12.1%(+14.7)#69 | 11.4%(+15.4)#1,960 |
| 70. | Menominee | 26.7% | 12.1%(+14.6)#70 | 11.4%(+15.3)#1,972 |
| 71. | Spring Grove | 26.5% | 12.1%(+14.4)#71 | 11.4%(+15.1)#1,995 |
| 72. | Indian Head Park | 26.3% | 12.1%(+14.2)#72 | 11.4%(+14.9)#2,017 |
| 73. | Winfield | 25.6% | 12.1%(+13.5)#73 | 11.4%(+14.2)#2,102 |
| 74. | Lily Lake | 25.3% | 12.1%(+13.2)#74 | 11.4%(+13.9)#2,137 |
| 75. | Johnsburg | 24.8% | 12.1%(+12.7)#75 | 11.4%(+13.4)#2,188 |
| 76. | The Galena Territory | 24.3% | 12.1%(+12.2)#76 | 11.4%(+12.9)#2,270 |
| 77. | Dunlap | 24.0% | 12.1%(+11.9)#77 | 11.4%(+12.6)#2,313 |
| 78. | Downers Grove | 23.8% | 12.1%(+11.7)#78 | 11.4%(+12.4)#2,341 |
| 79. | Ringwood | 23.7% | 12.1%(+11.6)#79 | 11.4%(+12.3)#2,368 |
| 80. | Lincolnwood | 23.6% | 12.1%(+11.5)#80 | 11.4%(+12.2)#2,372 |
| 81. | Vernon Hills | 23.5% | 12.1%(+11.4)#81 | 11.4%(+12.1)#2,390 |
| 82. | Sherman | 23.5% | 12.1%(+11.4)#82 | 11.4%(+12.1)#2,392 |
| 83. | Hollowayville | 23.5% | 12.1%(+11.4)#83 | 11.4%(+12.1)#2,402 |
| 84. | Buffalo Grove | 23.2% | 12.1%(+11.1)#84 | 11.4%(+11.8)#2,437 |
| 85. | Homer Glen | 23.2% | 12.1%(+11.1)#85 | 11.4%(+11.8)#2,440 |
| 86. | Wheaton | 23.1% | 12.1%(+11.0)#86 | 11.4%(+11.7)#2,459 |
| 87. | Oak Park | 22.7% | 12.1%(+10.6)#87 | 11.4%(+11.3)#2,514 |
| 88. | Channahon | 22.7% | 12.1%(+10.6)#88 | 11.4%(+11.3)#2,520 |
| 89. | Evanston | 22.6% | 12.1%(+10.5)#89 | 11.4%(+11.2)#2,538 |
| 90. | Germantown Hills | 22.6% | 12.1%(+10.5)#90 | 11.4%(+11.2)#2,545 |
| 91. | Lemont | 22.3% | 12.1%(+10.2)#91 | 11.4%(+10.9)#2,595 |
| 92. | Twin Grove | 22.3% | 12.1%(+10.2)#92 | 11.4%(+10.9)#2,606 |
| 93. | Batavia | 22.0% | 12.1%(+9.90)#93 | 11.4%(+10.6)#2,651 |
| 94. | Gurnee | 21.9% | 12.1%(+9.80)#94 | 11.4%(+10.5)#2,676 |
| 95. | Lake Villa | 21.6% | 12.1%(+9.50)#95 | 11.4%(+10.2)#2,724 |
| 96. | Wadsworth | 21.6% | 12.1%(+9.50)#96 | 11.4%(+10.2)#2,732 |
| 97. | Limestone | 21.6% | 12.1%(+9.50)#97 | 11.4%(+10.2)#2,736 |
| 98. | Boody | 21.6% | 12.1%(+9.50)#98 | 11.4%(+10.2)#2,740 |
| 99. | Grayslake | 21.3% | 12.1%(+9.20)#99 | 11.4%(+9.90)#2,788 |
| 100. | Palos Heights | 21.0% | 12.1%(+8.90)#100 | 11.4%(+9.60)#2,848 |
Common Questions
What are the Top 10 Cities with the Highest Percentage of Households with Income Above $200,000 in Illinois?
Top 10 Cities with the Highest Percentage of Households with Income Above $200,000 in Illinois are:
#1
67.7%
#2
64.0%
#3
62.9%
#4
59.8%
#5
59.4%
#6
58.4%
#7
57.7%
#8
55.3%
#9
53.6%
#10
53.4%
What city has the Highest Percentage of Households with Income Above $200,000 in Illinois?
Kildeer has the Highest Percentage of Households with Income Above $200,000 in Illinois with 67.7%.
What is the Percentage of Households with Income Above $200,000 in the State of Illinois?
Percentage of Households with Income Above $200,000 in Illinois is 12.1%.
What is the Percentage of Households with Income Above $200,000 in the United States?
Percentage of Households with Income Above $200,000 in the United States is 11.4%.