Del Rio, CA Map & Demographics
Del Rio Map
Del Rio Overview
$118,591
PER CAPITA INCOME
$191,071
AVG FAMILY INCOME
$186,333
AVG HOUSEHOLD INCOME
0.52
INEQUALITY / GINI INDEX
1,146
TOTAL POPULATION
555
MALE POPULATION
591
FEMALE POPULATION
93.91
MALES / 100 FEMALES
106.49
FEMALES / 100 MALES
63.6
MEDIAN AGE
2.7
AVG FAMILY SIZE
2.6
AVG HOUSEHOLD SIZE
368
LABOR FORCE [ PEOPLE ]
38.3%
PERCENT IN LABOR FORCE
2.2%
UNEMPLOYMENT RATE
Income in Del Rio
Income Overview in Del Rio
Per Capita Income in Del Rio is $118,591, while median incomes of families and households are $191,071 and $186,333 respectively.
| Characteristic | Number | Measure |
| Per Capita Income | 1,146 | $118,591 |
| Median Family Income | 418 | $191,071 |
| Mean Family Income | 418 | $321,040 |
| Median Household Income | 438 | $186,333 |
| Mean Household Income | 438 | $307,969 |
| Income Deficit | 418 | $0 |
| Wage / Income Gap (%) | 1,146 | 0.00% |
| Wage / Income Gap ($) | 1,146 | 100.00¢ per $1 |
| Gini / Inequality Index | 1,146 | 0.52 |
Earnings by Sex in Del Rio

| Sex | Number | Average Earnings |
| Male | 312 (64.6%) | $166,154 |
| Female | 171 (35.4%) | $0 |
| Total | 483 (100.0%) | $109,620 |
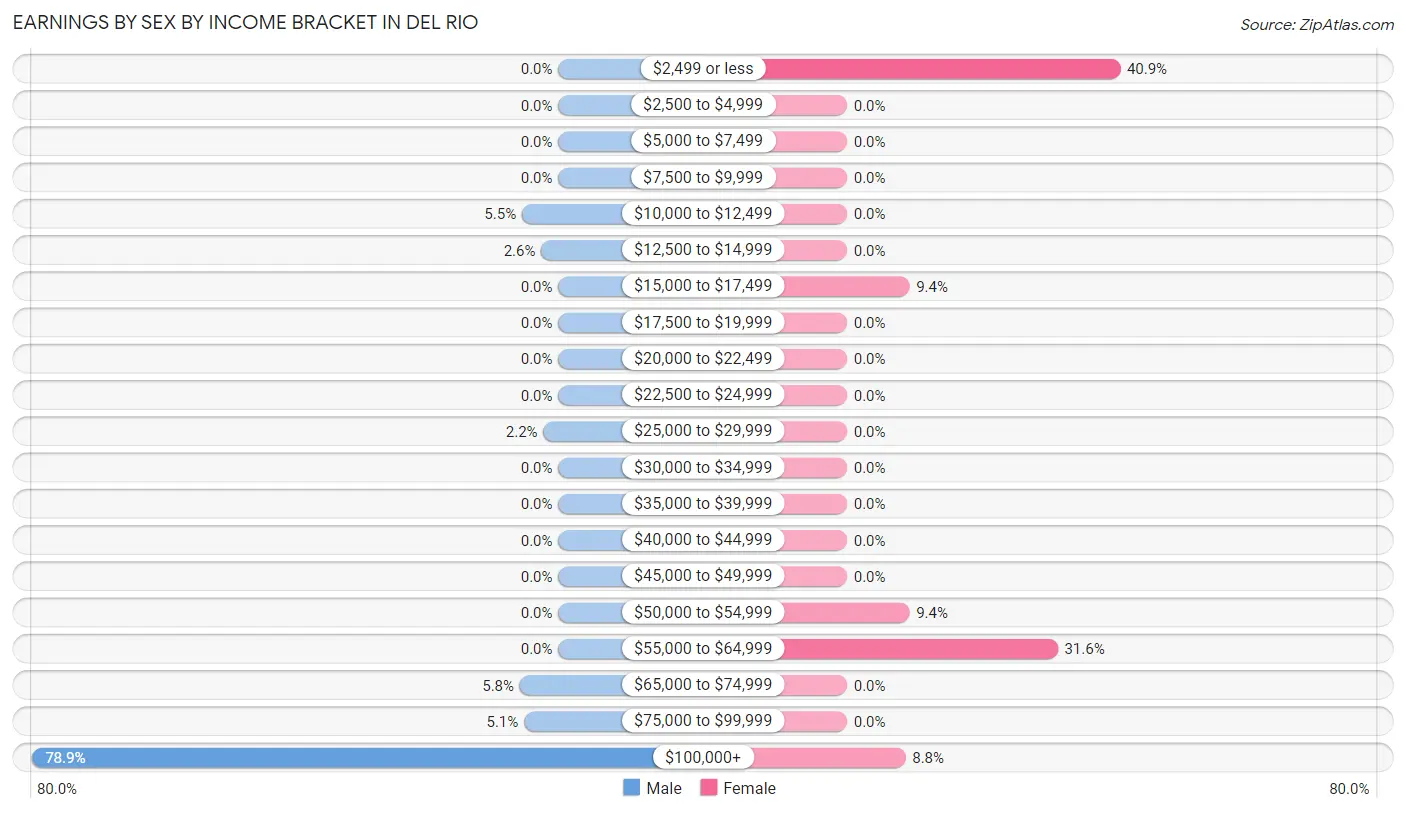
Earnings by Sex by Income Bracket in Del Rio
The most common earnings brackets in Del Rio are $100,000+ for men (246 | 78.8%) and $2,499 or less for women (70 | 40.9%).
| Income | Male | Female |
| $2,499 or less | 0 (0.0%) | 70 (40.9%) |
| $2,500 to $4,999 | 0 (0.0%) | 0 (0.0%) |
| $5,000 to $7,499 | 0 (0.0%) | 0 (0.0%) |
| $7,500 to $9,999 | 0 (0.0%) | 0 (0.0%) |
| $10,000 to $12,499 | 17 (5.4%) | 0 (0.0%) |
| $12,500 to $14,999 | 8 (2.6%) | 0 (0.0%) |
| $15,000 to $17,499 | 0 (0.0%) | 16 (9.4%) |
| $17,500 to $19,999 | 0 (0.0%) | 0 (0.0%) |
| $20,000 to $22,499 | 0 (0.0%) | 0 (0.0%) |
| $22,500 to $24,999 | 0 (0.0%) | 0 (0.0%) |
| $25,000 to $29,999 | 7 (2.2%) | 0 (0.0%) |
| $30,000 to $34,999 | 0 (0.0%) | 0 (0.0%) |
| $35,000 to $39,999 | 0 (0.0%) | 0 (0.0%) |
| $40,000 to $44,999 | 0 (0.0%) | 0 (0.0%) |
| $45,000 to $49,999 | 0 (0.0%) | 0 (0.0%) |
| $50,000 to $54,999 | 0 (0.0%) | 16 (9.4%) |
| $55,000 to $64,999 | 0 (0.0%) | 54 (31.6%) |
| $65,000 to $74,999 | 18 (5.8%) | 0 (0.0%) |
| $75,000 to $99,999 | 16 (5.1%) | 0 (0.0%) |
| $100,000+ | 246 (78.8%) | 15 (8.8%) |
| Total | 312 (100.0%) | 171 (100.0%) |
Earnings by Sex by Educational Attainment in Del Rio
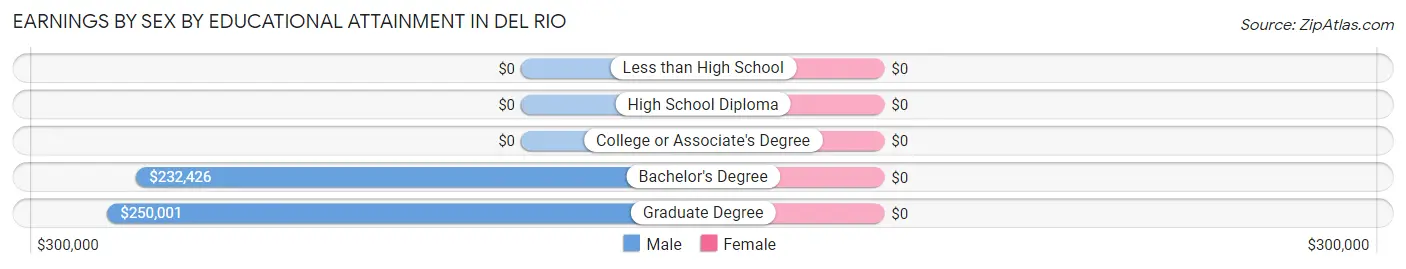
| Educational Attainment | Male Income | Female Income |
| Less than High School | - | - |
| High School Diploma | - | - |
| College or Associate's Degree | - | - |
| Bachelor's Degree | $232,426 | $0 |
| Graduate Degree | $250,001 | $0 |
| Total | $166,923 | $0 |
Family Income in Del Rio
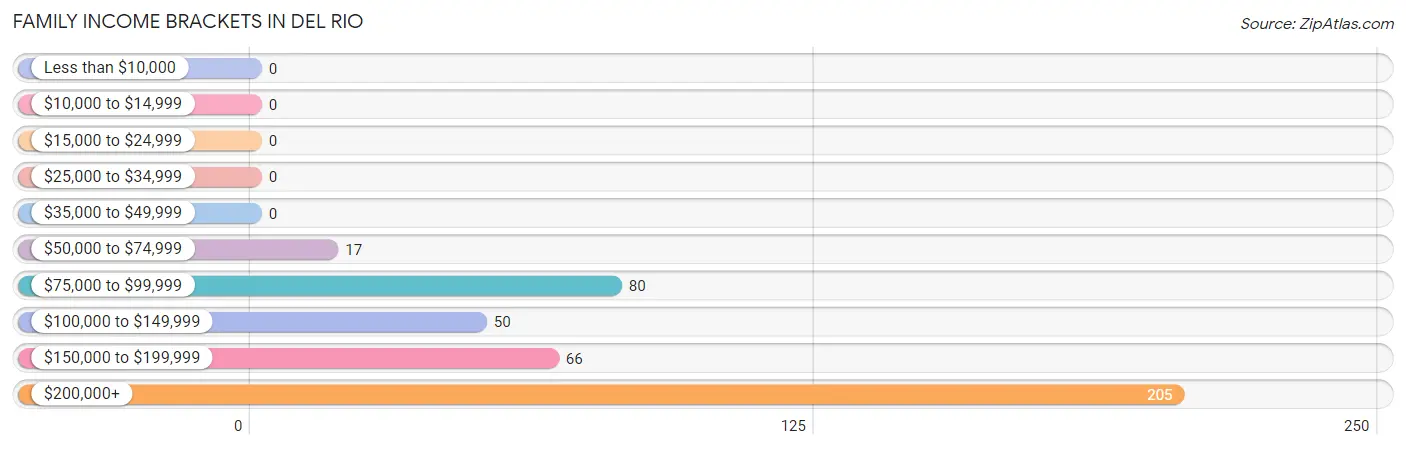
Family Income Brackets in Del Rio
According to the Del Rio family income data, there are 205 families falling into the $200,000+ income range, which is the most common income bracket and makes up 49.0% of all families.
| Income Bracket | # Families | % Families |
| Less than $10,000 | 0 | 0.0% |
| $10,000 to $14,999 | 0 | 0.0% |
| $15,000 to $24,999 | 0 | 0.0% |
| $25,000 to $34,999 | 0 | 0.0% |
| $35,000 to $49,999 | 0 | 0.0% |
| $50,000 to $74,999 | 17 | 4.1% |
| $75,000 to $99,999 | 80 | 19.1% |
| $100,000 to $149,999 | 50 | 12.0% |
| $150,000 to $199,999 | 66 | 15.8% |
| $200,000+ | 205 | 49.0% |
Family Income by Famaliy Size in Del Rio
2-person families (322 | 77.0%) account for the highest median family income in Del Rio with $213,450 per family, while 2-person families (322 | 77.0%) have the highest median income of $106,725 per family member.
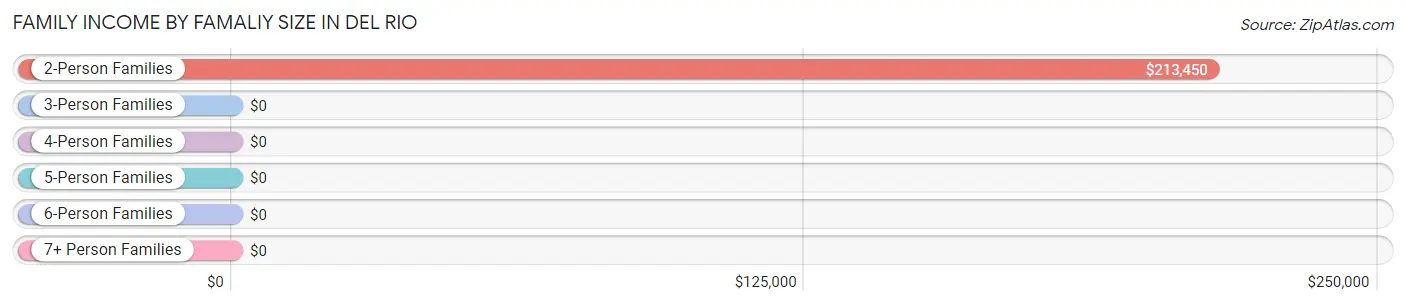
| Income Bracket | # Families | Median Income |
| 2-Person Families | 322 (77.0%) | $213,450 |
| 3-Person Families | 24 (5.7%) | $0 |
| 4-Person Families | 31 (7.4%) | $0 |
| 5-Person Families | 25 (6.0%) | $0 |
| 6-Person Families | 0 (0.0%) | $0 |
| 7+ Person Families | 16 (3.8%) | $0 |
| Total | 418 (100.0%) | $191,071 |
Family Income by Number of Earners in Del Rio
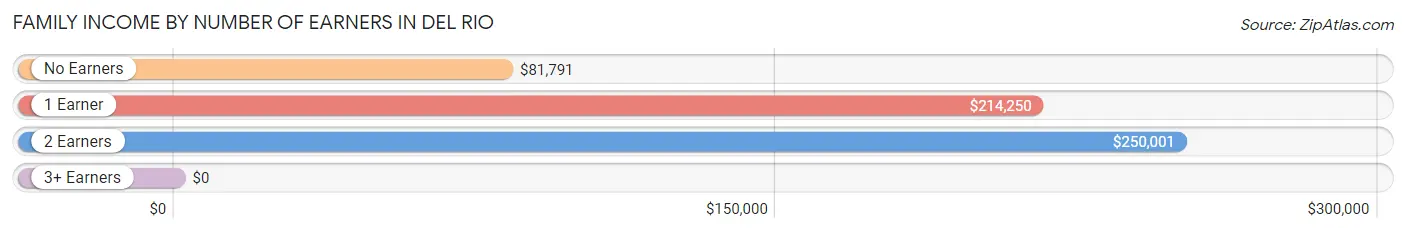
| Number of Earners | # Families | Median Income |
| No Earners | 96 (23.0%) | $81,791 |
| 1 Earner | 196 (46.9%) | $214,250 |
| 2 Earners | 104 (24.9%) | $250,001 |
| 3+ Earners | 22 (5.3%) | $0 |
| Total | 418 (100.0%) | $191,071 |
Household Income in Del Rio
Household Income Brackets in Del Rio
With 205 households falling in the category, the $200,000+ income range is the most frequent in Del Rio, accounting for 46.8% of all households.
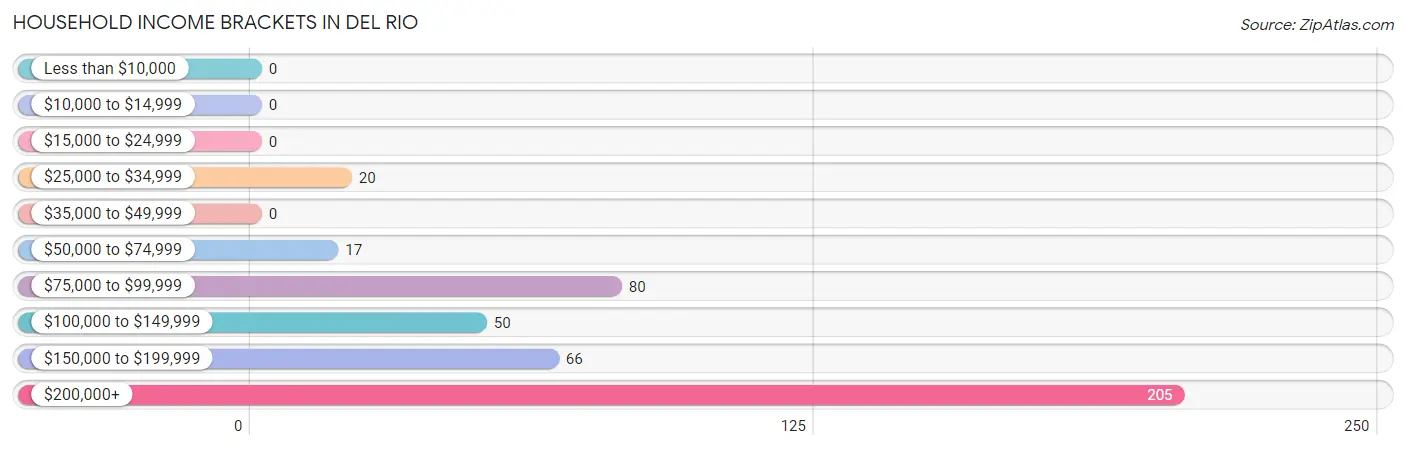
| Income Bracket | # Households | % Households |
| Less than $10,000 | 0 | 0.0% |
| $10,000 to $14,999 | 0 | 0.0% |
| $15,000 to $24,999 | 0 | 0.0% |
| $25,000 to $34,999 | 20 | 4.6% |
| $35,000 to $49,999 | 0 | 0.0% |
| $50,000 to $74,999 | 17 | 3.9% |
| $75,000 to $99,999 | 80 | 18.3% |
| $100,000 to $149,999 | 50 | 11.4% |
| $150,000 to $199,999 | 66 | 15.1% |
| $200,000+ | 205 | 46.8% |
Household Income by Householder Age in Del Rio
The median household income in Del Rio is $186,333, with the highest median household income of $250,001 found in the 45 to 64 years age bracket for the primary householder. A total of 97 households (22.2%) fall into this category.
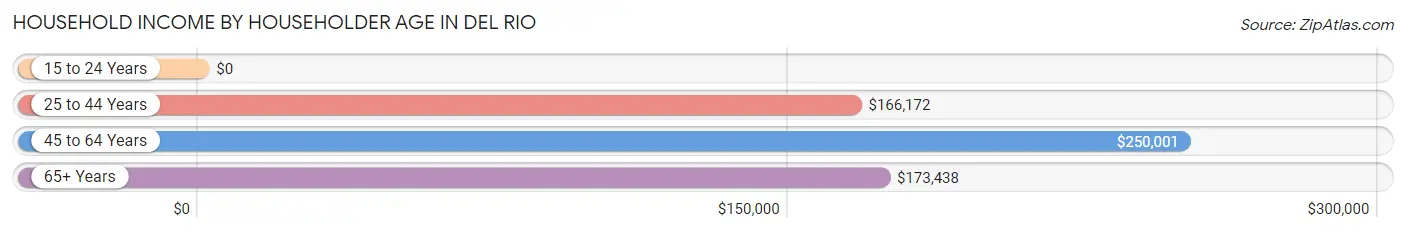
| Income Bracket | # Households | Median Income |
| 15 to 24 Years | 0 (0.0%) | $0 |
| 25 to 44 Years | 47 (10.7%) | $166,172 |
| 45 to 64 Years | 97 (22.2%) | $250,001 |
| 65+ Years | 294 (67.1%) | $173,438 |
| Total | 438 (100.0%) | $186,333 |
Poverty in Del Rio
Income Below Poverty by Sex and Age in Del Rio
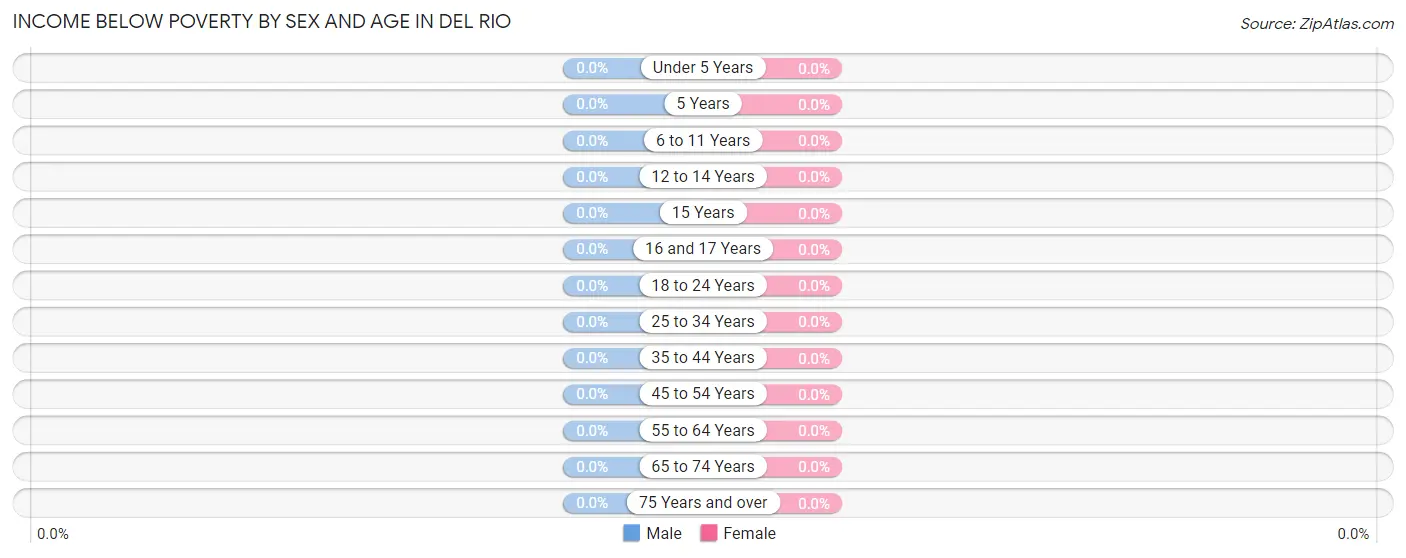
| Age Bracket | Male | Female |
| Under 5 Years | 0 (0.0%) | 0 (0.0%) |
| 5 Years | 0 (0.0%) | 0 (0.0%) |
| 6 to 11 Years | 0 (0.0%) | 0 (0.0%) |
| 12 to 14 Years | 0 (0.0%) | 0 (0.0%) |
| 15 Years | 0 (0.0%) | 0 (0.0%) |
| 16 and 17 Years | 0 (0.0%) | 0 (0.0%) |
| 18 to 24 Years | 0 (0.0%) | 0 (0.0%) |
| 25 to 34 Years | 0 (0.0%) | 0 (0.0%) |
| 35 to 44 Years | 0 (0.0%) | 0 (0.0%) |
| 45 to 54 Years | 0 (0.0%) | 0 (0.0%) |
| 55 to 64 Years | 0 (0.0%) | 0 (0.0%) |
| 65 to 74 Years | 0 (0.0%) | 0 (0.0%) |
| 75 Years and over | 0 (0.0%) | 0 (0.0%) |
| Total | 0 (0.0%) | 0 (0.0%) |
Income Above Poverty by Sex and Age in Del Rio
According to the poverty statistics in Del Rio, males aged 6 to 11 years and females aged 6 to 11 years are the age groups that are most secure financially, with 100.0% of males and 100.0% of females in these age groups living above the poverty line.
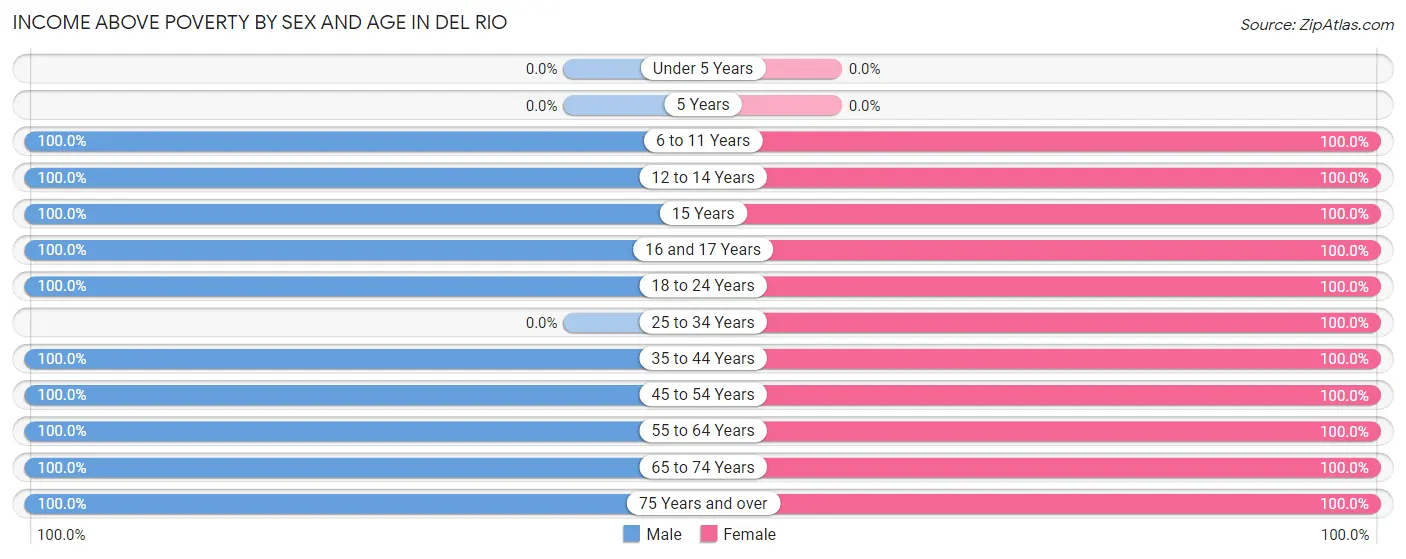
| Age Bracket | Male | Female |
| Under 5 Years | 0 (0.0%) | 0 (0.0%) |
| 5 Years | 0 (0.0%) | 0 (0.0%) |
| 6 to 11 Years | 32 (100.0%) | 32 (100.0%) |
| 12 to 14 Years | 16 (100.0%) | 74 (100.0%) |
| 15 Years | 14 (100.0%) | 18 (100.0%) |
| 16 and 17 Years | 16 (100.0%) | 29 (100.0%) |
| 18 to 24 Years | 8 (100.0%) | 19 (100.0%) |
| 25 to 34 Years | 0 (0.0%) | 16 (100.0%) |
| 35 to 44 Years | 50 (100.0%) | 31 (100.0%) |
| 45 to 54 Years | 62 (100.0%) | 11 (100.0%) |
| 55 to 64 Years | 65 (100.0%) | 106 (100.0%) |
| 65 to 74 Years | 121 (100.0%) | 72 (100.0%) |
| 75 Years and over | 171 (100.0%) | 183 (100.0%) |
| Total | 555 (100.0%) | 591 (100.0%) |
Income Below Poverty Among Married-Couple Families in Del Rio
| Children | Above Poverty | Below Poverty |
| No Children | 346 (100.0%) | 0 (0.0%) |
| 1 or 2 Children | 31 (100.0%) | 0 (0.0%) |
| 3 or 4 Children | 25 (100.0%) | 0 (0.0%) |
| 5 or more Children | 16 (100.0%) | 0 (0.0%) |
| Total | 418 (100.0%) | 0 (0.0%) |
Income Below Poverty Among Single-Parent Households in Del Rio
| Children | Single Father | Single Mother |
| No Children | 0 (0.0%) | 0 (0.0%) |
| 1 or 2 Children | 0 (0.0%) | 0 (0.0%) |
| 3 or 4 Children | 0 (0.0%) | 0 (0.0%) |
| 5 or more Children | 0 (0.0%) | 0 (0.0%) |
| Total | 0 (0.0%) | 0 (0.0%) |
Income Below Poverty Among Married-Couple vs Single-Parent Households in Del Rio
| Children | Married-Couple Families | Single-Parent Households |
| No Children | 0 (0.0%) | 0 (0.0%) |
| 1 or 2 Children | 0 (0.0%) | 0 (0.0%) |
| 3 or 4 Children | 0 (0.0%) | 0 (0.0%) |
| 5 or more Children | 0 (0.0%) | 0 (0.0%) |
| Total | 0 (0.0%) | 0 (0.0%) |
Race in Del Rio
The most populous races in Del Rio are White / Caucasian (868 | 75.7%), Asian (156 | 13.6%), and Hispanic or Latino (125 | 10.9%).
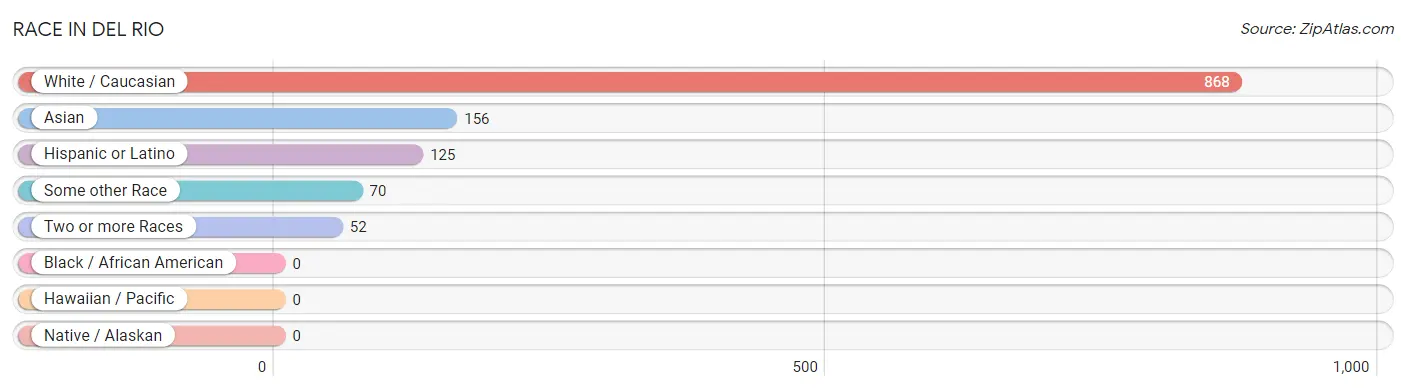
| Race | # Population | % Population |
| Asian | 156 | 13.6% |
| Black / African American | 0 | 0.0% |
| Hawaiian / Pacific | 0 | 0.0% |
| Hispanic or Latino | 125 | 10.9% |
| Native / Alaskan | 0 | 0.0% |
| White / Caucasian | 868 | 75.7% |
| Two or more Races | 52 | 4.5% |
| Some other Race | 70 | 6.1% |
| Total | 1,146 | 100.0% |
Ancestry in Del Rio
The most populous ancestries reported in Del Rio are English (198 | 17.3%), Irish (171 | 14.9%), Italian (126 | 11.0%), Mexican (111 | 9.7%), and Northern European (101 | 8.8%), together accounting for 61.7% of all Del Rio residents.
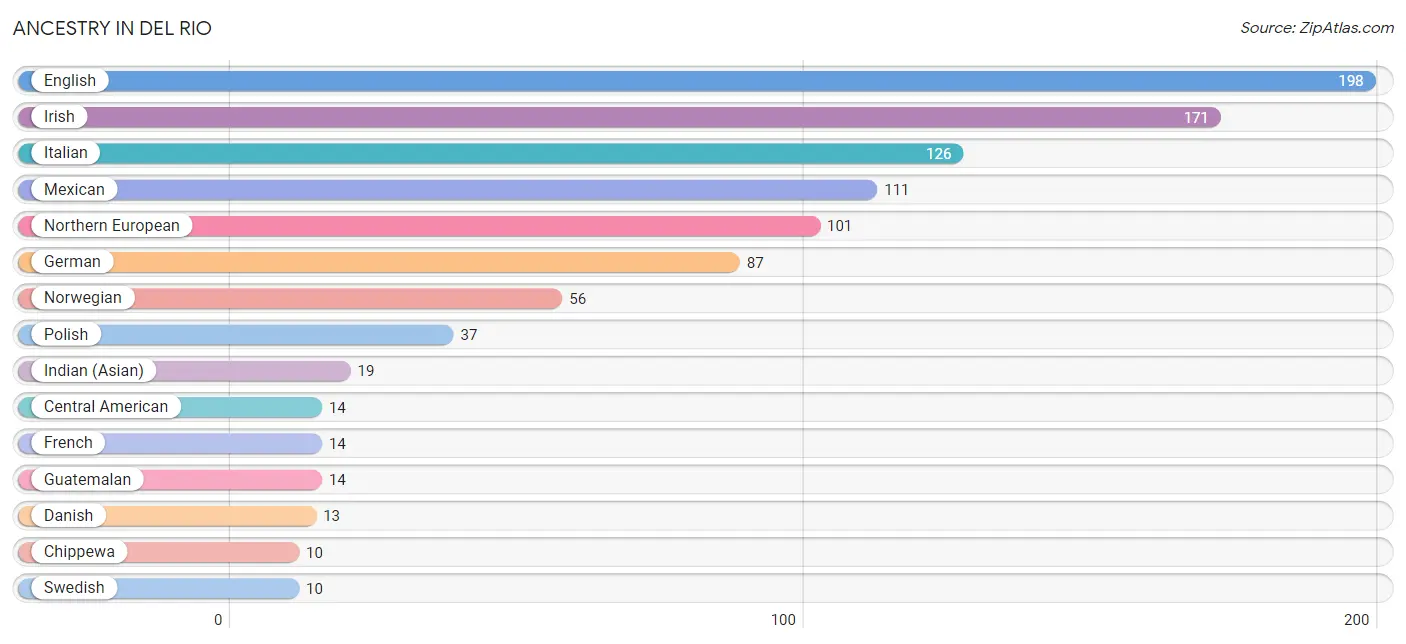
| Ancestry | # Population | % Population |
| Central American | 14 | 1.2% |
| Chippewa | 10 | 0.9% |
| Danish | 13 | 1.1% |
| English | 198 | 17.3% |
| French | 14 | 1.2% |
| German | 87 | 7.6% |
| Guatemalan | 14 | 1.2% |
| Indian (Asian) | 19 | 1.7% |
| Irish | 171 | 14.9% |
| Italian | 126 | 11.0% |
| Mexican | 111 | 9.7% |
| Northern European | 101 | 8.8% |
| Norwegian | 56 | 4.9% |
| Polish | 37 | 3.2% |
| Swedish | 10 | 0.9% | View All 15 Rows |
Immigrants in Del Rio
The most numerous immigrant groups reported in Del Rio came from Asia (69 | 6.0%), South Central Asia (50 | 4.4%), Sri Lanka (50 | 4.4%), Eastern Europe (23 | 2.0%), and Europe (23 | 2.0%), together accounting for 18.8% of all Del Rio residents.
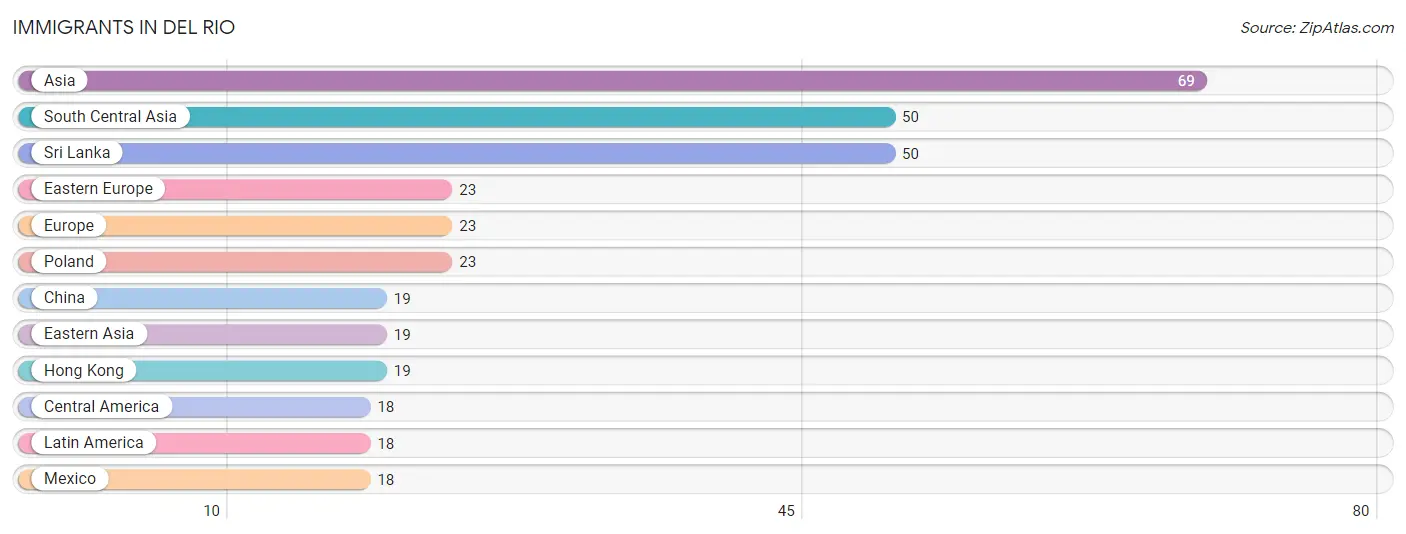
| Immigration Origin | # Population | % Population |
| Asia | 69 | 6.0% |
| Central America | 18 | 1.6% |
| China | 19 | 1.7% |
| Eastern Asia | 19 | 1.7% |
| Eastern Europe | 23 | 2.0% |
| Europe | 23 | 2.0% |
| Hong Kong | 19 | 1.7% |
| Latin America | 18 | 1.6% |
| Mexico | 18 | 1.6% |
| Poland | 23 | 2.0% |
| South Central Asia | 50 | 4.4% |
| Sri Lanka | 50 | 4.4% | View All 12 Rows |
Sex and Age in Del Rio
Sex and Age in Del Rio
The most populous age groups in Del Rio are 65 to 69 Years (92 | 16.6%) for men and 85 Years and over (107 | 18.1%) for women.
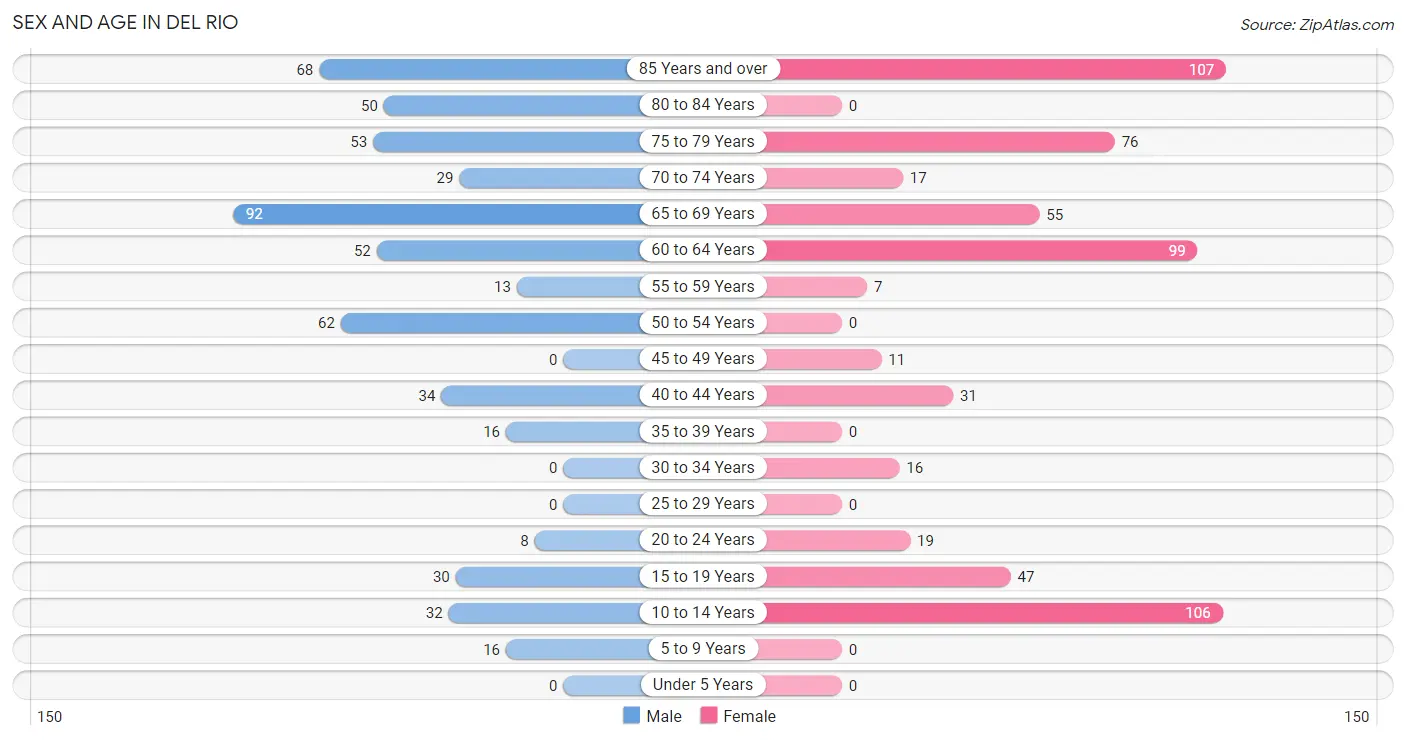
| Age Bracket | Male | Female |
| Under 5 Years | 0 (0.0%) | 0 (0.0%) |
| 5 to 9 Years | 16 (2.9%) | 0 (0.0%) |
| 10 to 14 Years | 32 (5.8%) | 106 (17.9%) |
| 15 to 19 Years | 30 (5.4%) | 47 (8.0%) |
| 20 to 24 Years | 8 (1.4%) | 19 (3.2%) |
| 25 to 29 Years | 0 (0.0%) | 0 (0.0%) |
| 30 to 34 Years | 0 (0.0%) | 16 (2.7%) |
| 35 to 39 Years | 16 (2.9%) | 0 (0.0%) |
| 40 to 44 Years | 34 (6.1%) | 31 (5.2%) |
| 45 to 49 Years | 0 (0.0%) | 11 (1.9%) |
| 50 to 54 Years | 62 (11.2%) | 0 (0.0%) |
| 55 to 59 Years | 13 (2.3%) | 7 (1.2%) |
| 60 to 64 Years | 52 (9.4%) | 99 (16.8%) |
| 65 to 69 Years | 92 (16.6%) | 55 (9.3%) |
| 70 to 74 Years | 29 (5.2%) | 17 (2.9%) |
| 75 to 79 Years | 53 (9.6%) | 76 (12.9%) |
| 80 to 84 Years | 50 (9.0%) | 0 (0.0%) |
| 85 Years and over | 68 (12.2%) | 107 (18.1%) |
| Total | 555 (100.0%) | 591 (100.0%) |
Families and Households in Del Rio
Median Family Size in Del Rio
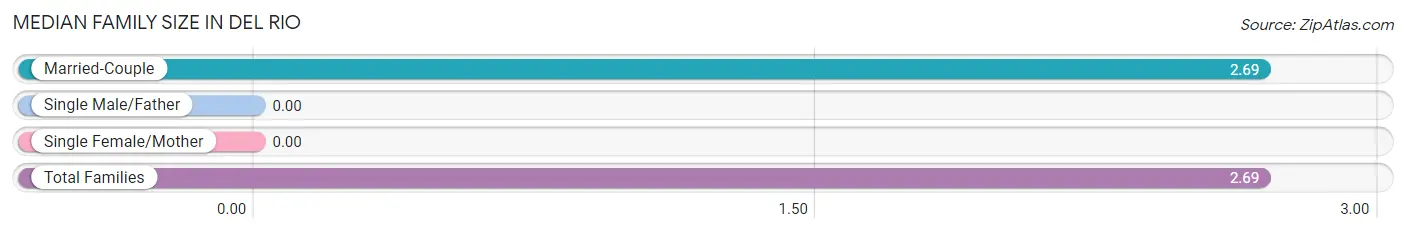
| Family Type | # Families | Family Size |
| Married-Couple | 418 (100.0%) | 2.69 |
| Single Male/Father | 0 (0.0%) | - |
| Single Female/Mother | 0 (0.0%) | - |
| Total Families | 418 (100.0%) | 2.69 |
Median Household Size in Del Rio
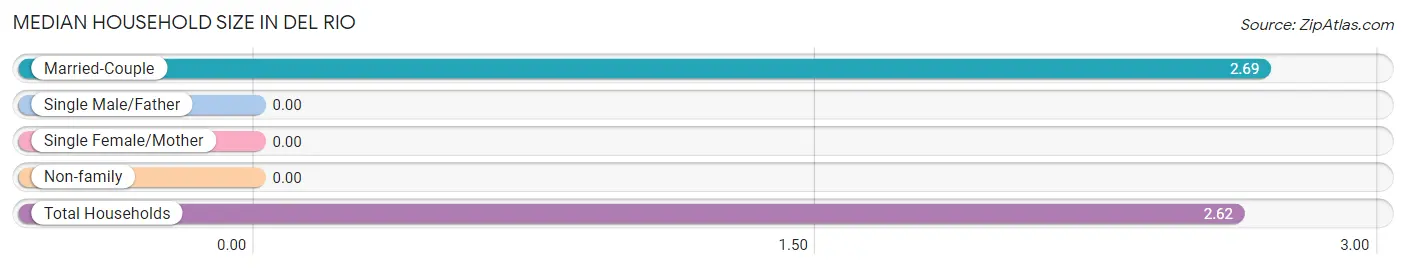
| Household Type | # Households | Household Size |
| Married-Couple | 418 (95.4%) | 2.69 |
| Single Male/Father | 0 (0.0%) | - |
| Single Female/Mother | 0 (0.0%) | - |
| Non-family | 20 (4.6%) | - |
| Total Households | 438 (100.0%) | 2.62 |
Household Size by Marriage Status in Del Rio
Out of a total of 438 households in Del Rio, 418 (95.4%) are family households, while 20 (4.6%) are nonfamily households. The most numerous type of family households are 2-person households, comprising 322, and the most common type of nonfamily households are 1-person households, comprising 20.
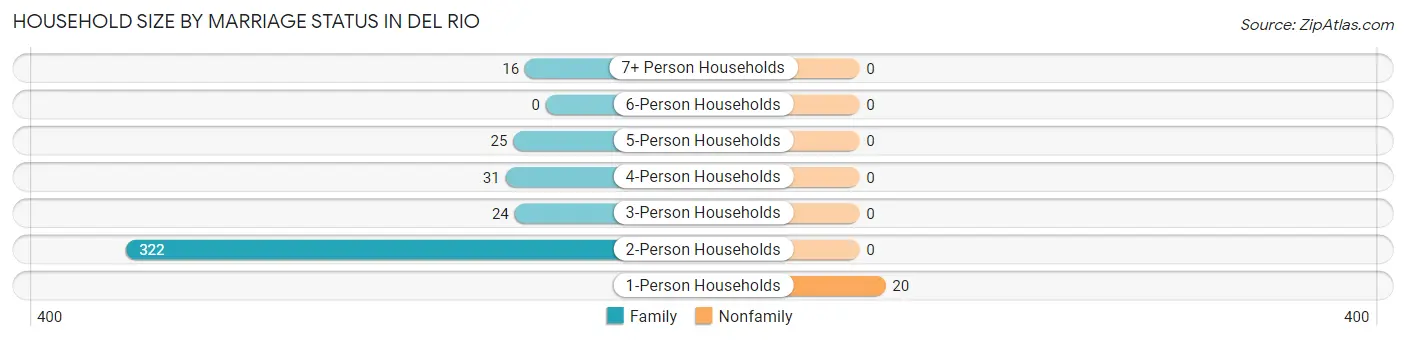
| Household Size | Family Households | Nonfamily Households |
| 1-Person Households | - | 20 (4.6%) |
| 2-Person Households | 322 (73.5%) | 0 (0.0%) |
| 3-Person Households | 24 (5.5%) | 0 (0.0%) |
| 4-Person Households | 31 (7.1%) | 0 (0.0%) |
| 5-Person Households | 25 (5.7%) | 0 (0.0%) |
| 6-Person Households | 0 (0.0%) | 0 (0.0%) |
| 7+ Person Households | 16 (3.6%) | 0 (0.0%) |
| Total | 418 (95.4%) | 20 (4.6%) |
Female Fertility in Del Rio
Fertility by Age in Del Rio
| Age Bracket | Women with Births | Births / 1,000 Women |
| 15 to 19 years | 0 (0.0%) | 0.0 |
| 20 to 34 years | 0 (0.0%) | 0.0 |
| 35 to 50 years | 0 (0.0%) | 0.0 |
| Total | 0 (0.0%) | 0.0 |
Fertility by Age by Marriage Status in Del Rio
| Age Bracket | Married | Unmarried |
| 15 to 19 years | 0 (0.0%) | 0 (0.0%) |
| 20 to 34 years | 0 (0.0%) | 0 (0.0%) |
| 35 to 50 years | 0 (0.0%) | 0 (0.0%) |
| Total | 0 (0.0%) | 0 (0.0%) |
Fertility by Education in Del Rio
| Educational Attainment | Women with Births | Births / 1,000 Women |
| Less than High School | 0 (0.0%) | 0.0 |
| High School Diploma | 0 (0.0%) | 0.0 |
| College or Associate's Degree | 0 (0.0%) | 0.0 |
| Bachelor's Degree | 0 (0.0%) | 0.0 |
| Graduate Degree | 0 (0.0%) | 0.0 |
| Total | 0 (0.0%) | 0.0 |
Fertility by Education by Marriage Status in Del Rio
| Educational Attainment | Married | Unmarried |
| Less than High School | 0 (0.0%) | 0 (0.0%) |
| High School Diploma | 0 (0.0%) | 0 (0.0%) |
| College or Associate's Degree | 0 (0.0%) | 0 (0.0%) |
| Bachelor's Degree | 0 (0.0%) | 0 (0.0%) |
| Graduate Degree | 0 (0.0%) | 0 (0.0%) |
| Total | 0 (0.0%) | 0 (0.0%) |
Employment Characteristics in Del Rio
Employment by Class of Employer in Del Rio
Among the 360 employed individuals in Del Rio, private company employees (164 | 45.6%), self-employed (not incorporated) (76 | 21.1%), and not-for-profit organizations (52 | 14.4%) make up the most common classes of employment.
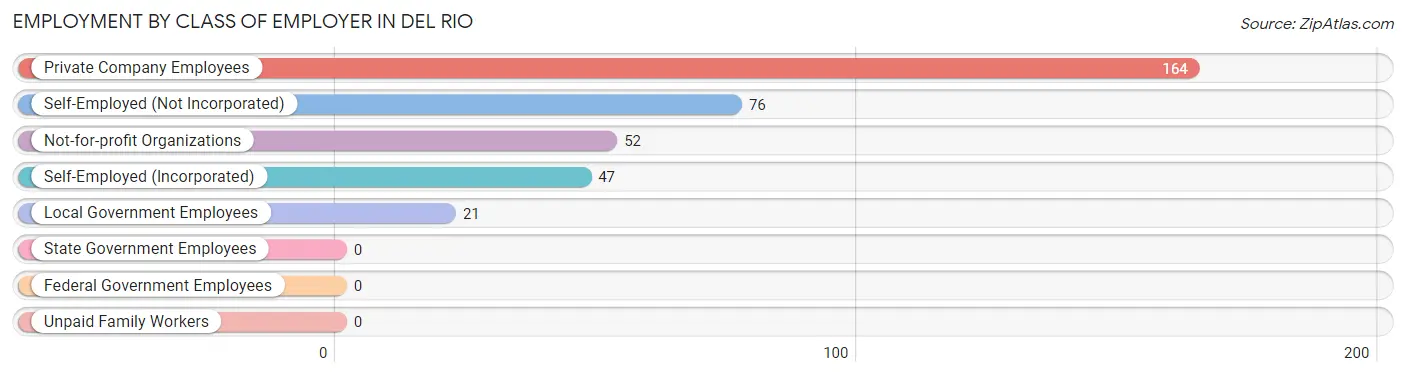
| Employer Class | # Employees | % Employees |
| Private Company Employees | 164 | 45.6% |
| Self-Employed (Incorporated) | 47 | 13.1% |
| Self-Employed (Not Incorporated) | 76 | 21.1% |
| Not-for-profit Organizations | 52 | 14.4% |
| Local Government Employees | 21 | 5.8% |
| State Government Employees | 0 | 0.0% |
| Federal Government Employees | 0 | 0.0% |
| Unpaid Family Workers | 0 | 0.0% |
| Total | 360 | 100.0% |
Employment Status by Age in Del Rio
According to the labor force statistics for Del Rio, out of the total population over 16 years of age (960), 38.3% or 368 individuals are in the labor force, with 2.2% or 8 of them unemployed. The age group with the highest labor force participation rate is 20 to 24 years, with 100.0% or 27 individuals in the labor force. Within the labor force, the 20 to 24 years age range has the highest percentage of unemployed individuals, with 29.6% or 8 of them being unemployed.
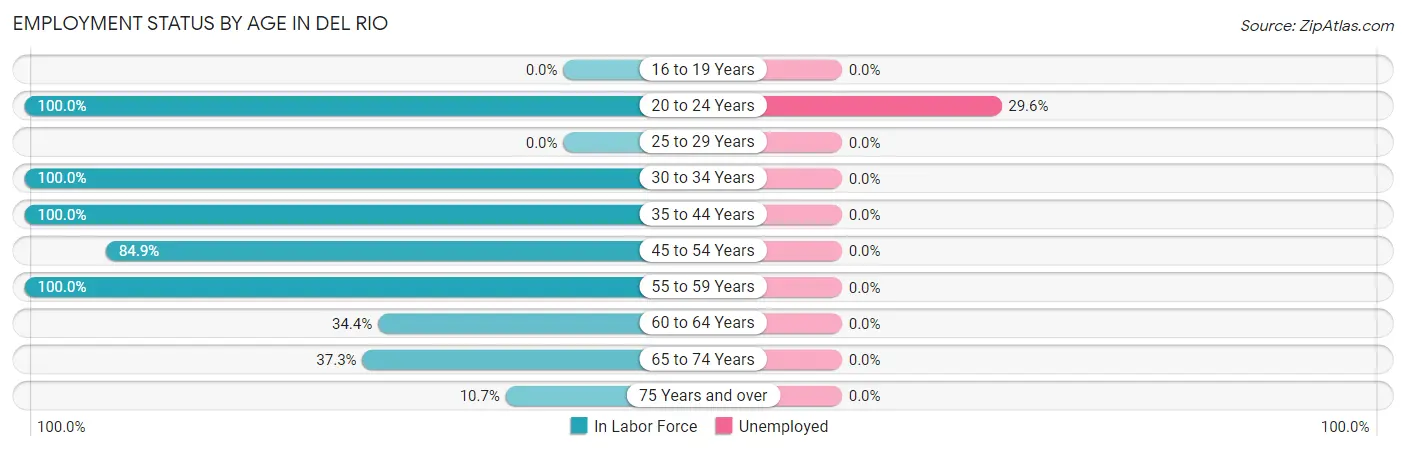
| Age Bracket | In Labor Force | Unemployed |
| 16 to 19 Years | 0 (0.0%) | 0 (0.0%) |
| 20 to 24 Years | 27 (100.0%) | 8 (29.6%) |
| 25 to 29 Years | 0 (0.0%) | 0 (0.0%) |
| 30 to 34 Years | 16 (100.0%) | 0 (0.0%) |
| 35 to 44 Years | 81 (100.0%) | 0 (0.0%) |
| 45 to 54 Years | 62 (84.9%) | 0 (0.0%) |
| 55 to 59 Years | 20 (100.0%) | 0 (0.0%) |
| 60 to 64 Years | 52 (34.4%) | 0 (0.0%) |
| 65 to 74 Years | 72 (37.3%) | 0 (0.0%) |
| 75 Years and over | 38 (10.7%) | 0 (0.0%) |
| Total | 368 (38.3%) | 8 (2.2%) |
Employment Status by Educational Attainment in Del Rio

| Educational Attainment | In Labor Force | Unemployed |
| Less than High School | 41 (100.0%) | 0 (0.0%) |
| High School Diploma | 31 (100.0%) | 0 (0.0%) |
| College / Associate Degree | 52 (65.0%) | 0 (0.0%) |
| Bachelor's Degree or higher | 107 (56.6%) | 0 (0.0%) |
| Total | 231 (67.7%) | 0 (0.0%) |
Employment Occupations by Sex in Del Rio
Management, Business, Science and Arts Occupations
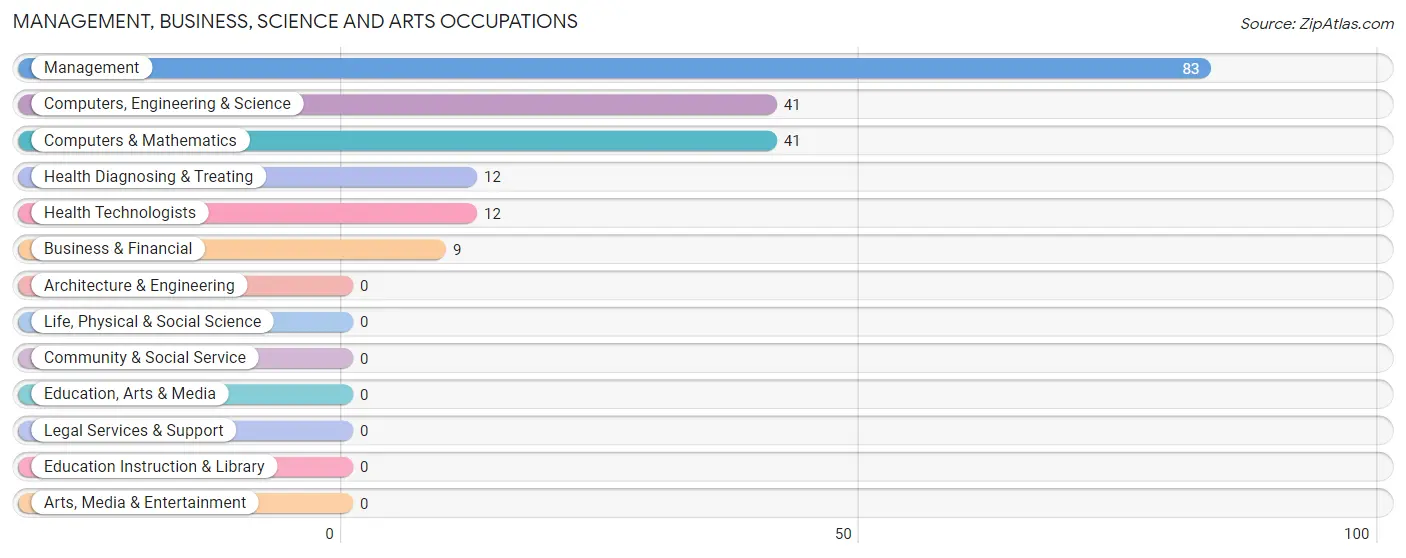
The most common Management, Business, Science and Arts occupations in Del Rio are Management (83 | 23.1%), Computers, Engineering & Science (41 | 11.4%), Computers & Mathematics (41 | 11.4%), Health Diagnosing & Treating (12 | 3.3%), and Health Technologists (12 | 3.3%).
Management, Business, Science and Arts Occupations by Sex
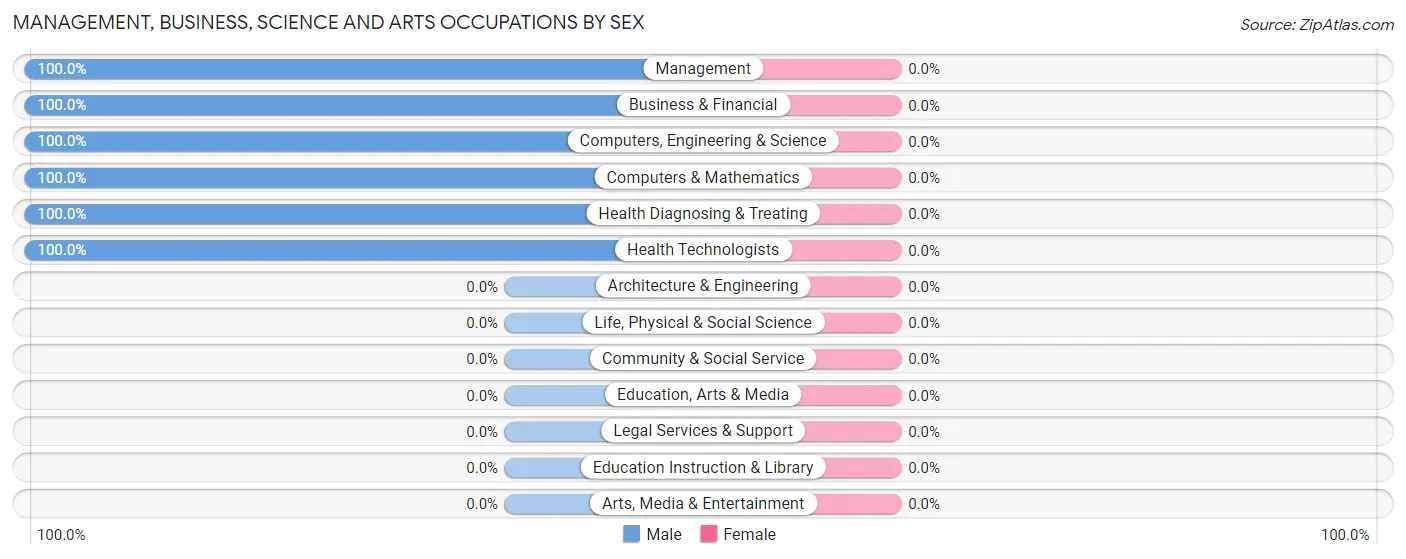
| Occupation | Male | Female |
| Management | 83 (100.0%) | 0 (0.0%) |
| Business & Financial | 9 (100.0%) | 0 (0.0%) |
| Computers, Engineering & Science | 41 (100.0%) | 0 (0.0%) |
| Computers & Mathematics | 41 (100.0%) | 0 (0.0%) |
| Architecture & Engineering | 0 (0.0%) | 0 (0.0%) |
| Life, Physical & Social Science | 0 (0.0%) | 0 (0.0%) |
| Community & Social Service | 0 (0.0%) | 0 (0.0%) |
| Education, Arts & Media | 0 (0.0%) | 0 (0.0%) |
| Legal Services & Support | 0 (0.0%) | 0 (0.0%) |
| Education Instruction & Library | 0 (0.0%) | 0 (0.0%) |
| Arts, Media & Entertainment | 0 (0.0%) | 0 (0.0%) |
| Health Diagnosing & Treating | 12 (100.0%) | 0 (0.0%) |
| Health Technologists | 12 (100.0%) | 0 (0.0%) |
| Total (Category) | 145 (100.0%) | 0 (0.0%) |
| Total (Overall) | 287 (79.7%) | 73 (20.3%) |
Services Occupations
The most common Services occupations in Del Rio are Security & Protection (7 | 1.9%), and Law Enforcement (7 | 1.9%).
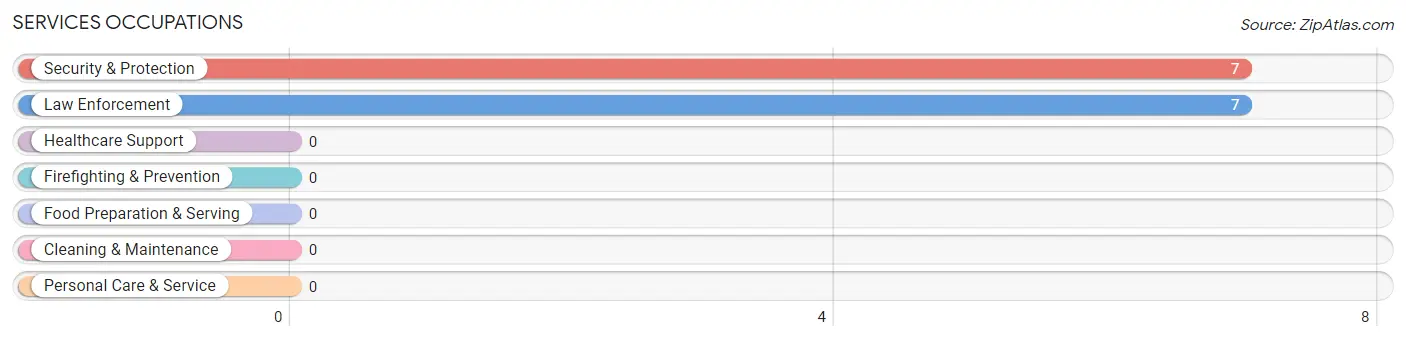
Services Occupations by Sex
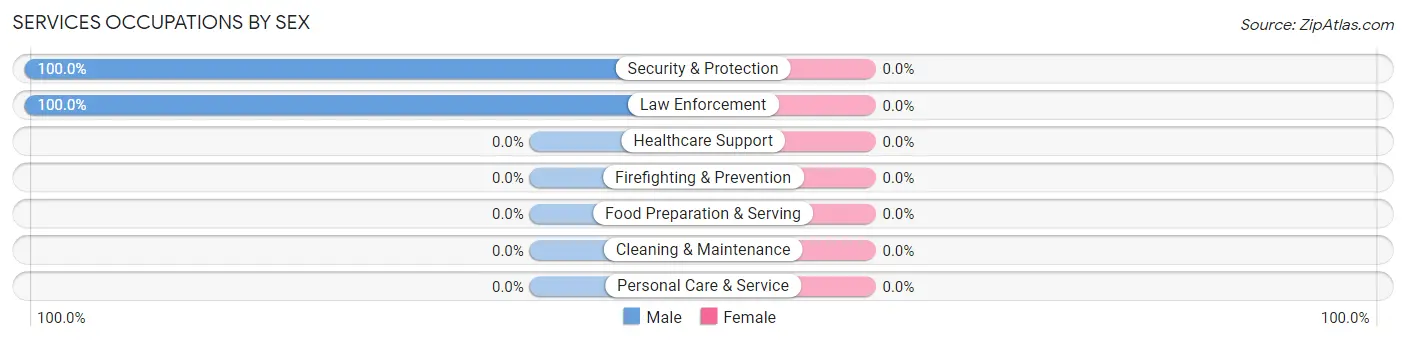
| Occupation | Male | Female |
| Healthcare Support | 0 (0.0%) | 0 (0.0%) |
| Security & Protection | 7 (100.0%) | 0 (0.0%) |
| Firefighting & Prevention | 0 (0.0%) | 0 (0.0%) |
| Law Enforcement | 7 (100.0%) | 0 (0.0%) |
| Food Preparation & Serving | 0 (0.0%) | 0 (0.0%) |
| Cleaning & Maintenance | 0 (0.0%) | 0 (0.0%) |
| Personal Care & Service | 0 (0.0%) | 0 (0.0%) |
| Total (Category) | 7 (100.0%) | 0 (0.0%) |
| Total (Overall) | 287 (79.7%) | 73 (20.3%) |
Sales and Office Occupations
The most common Sales and Office occupations in Del Rio are Sales & Related (115 | 31.9%), and Office & Administration (34 | 9.4%).

Sales and Office Occupations by Sex

| Occupation | Male | Female |
| Sales & Related | 92 (80.0%) | 23 (20.0%) |
| Office & Administration | 0 (0.0%) | 34 (100.0%) |
| Total (Category) | 92 (61.7%) | 57 (38.3%) |
| Total (Overall) | 287 (79.7%) | 73 (20.3%) |
Natural Resources, Construction and Maintenance Occupations
The most common Natural Resources, Construction and Maintenance occupations in Del Rio are , and Construction & Extraction (18 | 5.0%).
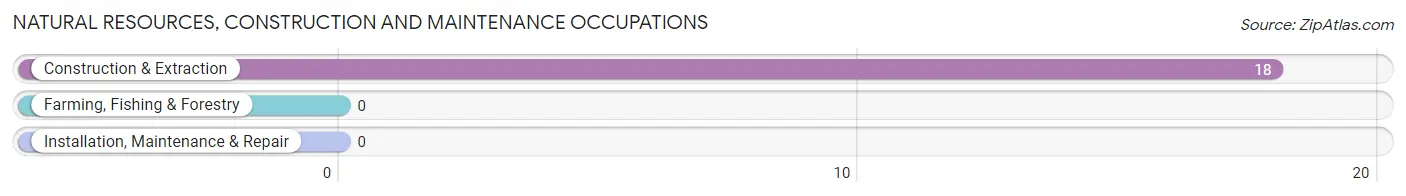
Natural Resources, Construction and Maintenance Occupations by Sex

| Occupation | Male | Female |
| Farming, Fishing & Forestry | 0 (0.0%) | 0 (0.0%) |
| Construction & Extraction | 18 (100.0%) | 0 (0.0%) |
| Installation, Maintenance & Repair | 0 (0.0%) | 0 (0.0%) |
| Total (Category) | 18 (100.0%) | 0 (0.0%) |
| Total (Overall) | 287 (79.7%) | 73 (20.3%) |
Production, Transportation and Moving Occupations
The most common Production, Transportation and Moving occupations in Del Rio are Production (25 | 6.9%), and Material Moving (16 | 4.4%).
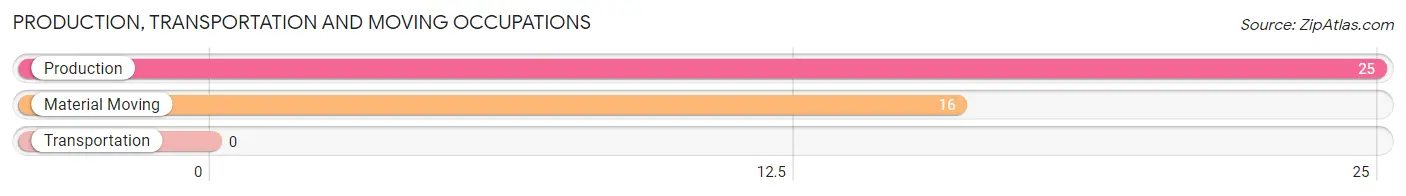
Production, Transportation and Moving Occupations by Sex

| Occupation | Male | Female |
| Production | 25 (100.0%) | 0 (0.0%) |
| Transportation | 0 (0.0%) | 0 (0.0%) |
| Material Moving | 0 (0.0%) | 16 (100.0%) |
| Total (Category) | 25 (61.0%) | 16 (39.0%) |
| Total (Overall) | 287 (79.7%) | 73 (20.3%) |
Employment Industries by Sex in Del Rio
Employment Industries in Del Rio
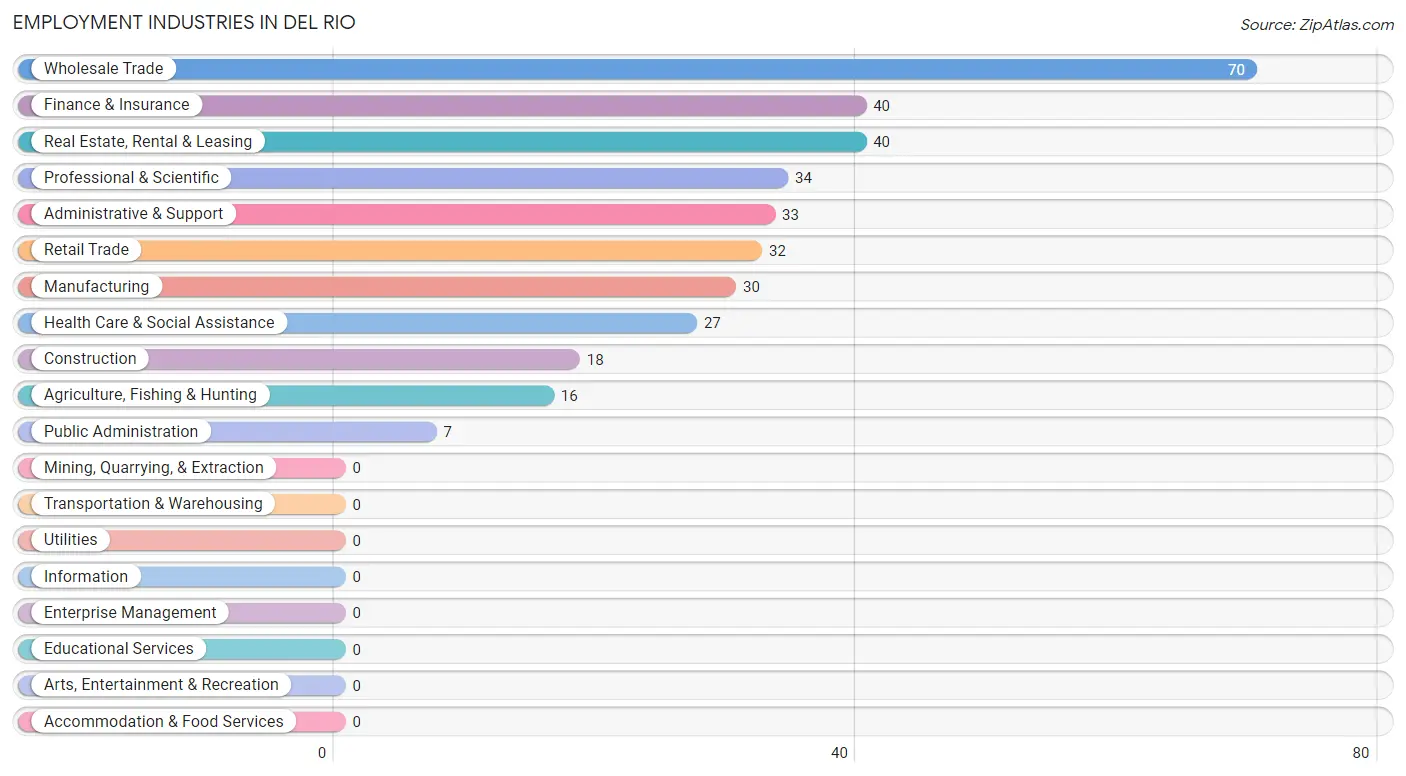
The major employment industries in Del Rio include Wholesale Trade (70 | 19.4%), Finance & Insurance (40 | 11.1%), Real Estate, Rental & Leasing (40 | 11.1%), Professional & Scientific (34 | 9.4%), and Administrative & Support (33 | 9.2%).
Employment Industries by Sex in Del Rio
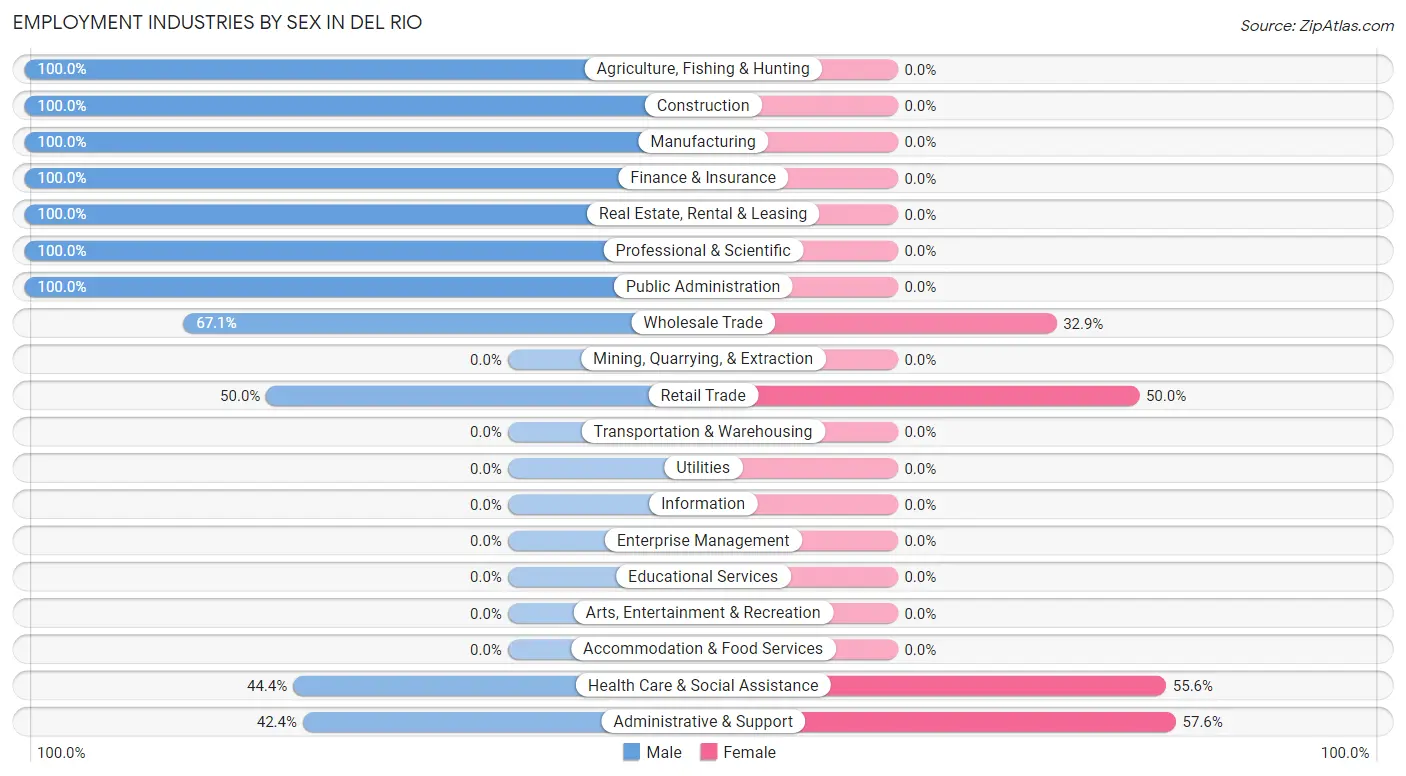
The Del Rio industries that see more men than women are Agriculture, Fishing & Hunting (100.0%), Construction (100.0%), and Manufacturing (100.0%), whereas the industries that tend to have a higher number of women are Administrative & Support (57.6%), Health Care & Social Assistance (55.6%), and Retail Trade (50.0%).
| Industry | Male | Female |
| Agriculture, Fishing & Hunting | 16 (100.0%) | 0 (0.0%) |
| Mining, Quarrying, & Extraction | 0 (0.0%) | 0 (0.0%) |
| Construction | 18 (100.0%) | 0 (0.0%) |
| Manufacturing | 30 (100.0%) | 0 (0.0%) |
| Wholesale Trade | 47 (67.1%) | 23 (32.9%) |
| Retail Trade | 16 (50.0%) | 16 (50.0%) |
| Transportation & Warehousing | 0 (0.0%) | 0 (0.0%) |
| Utilities | 0 (0.0%) | 0 (0.0%) |
| Information | 0 (0.0%) | 0 (0.0%) |
| Finance & Insurance | 40 (100.0%) | 0 (0.0%) |
| Real Estate, Rental & Leasing | 40 (100.0%) | 0 (0.0%) |
| Professional & Scientific | 34 (100.0%) | 0 (0.0%) |
| Enterprise Management | 0 (0.0%) | 0 (0.0%) |
| Administrative & Support | 14 (42.4%) | 19 (57.6%) |
| Educational Services | 0 (0.0%) | 0 (0.0%) |
| Health Care & Social Assistance | 12 (44.4%) | 15 (55.6%) |
| Arts, Entertainment & Recreation | 0 (0.0%) | 0 (0.0%) |
| Accommodation & Food Services | 0 (0.0%) | 0 (0.0%) |
| Public Administration | 7 (100.0%) | 0 (0.0%) |
| Total | 287 (79.7%) | 73 (20.3%) |
Education in Del Rio
School Enrollment in Del Rio
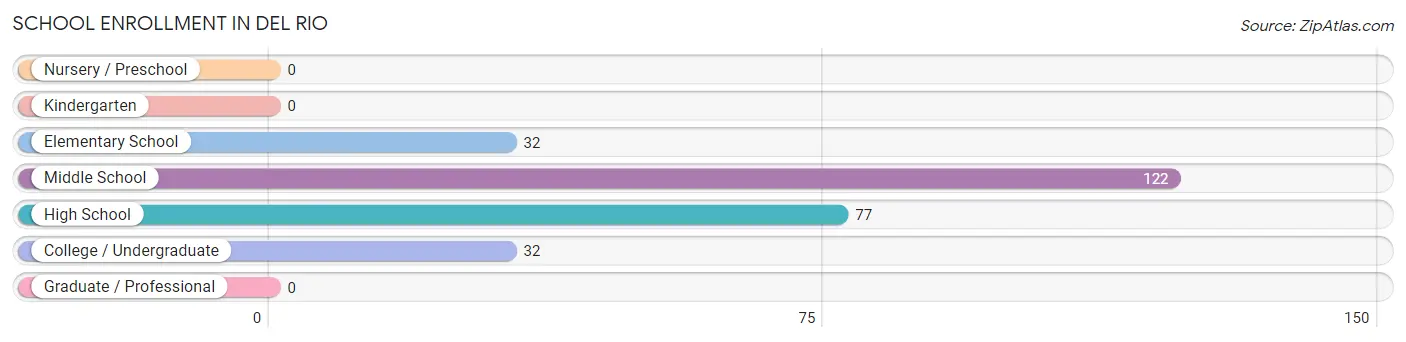
The most common levels of schooling among the 263 students in Del Rio are middle school (122 | 46.4%), high school (77 | 29.3%), and elementary school (32 | 12.2%).
| School Level | # Students | % Students |
| Nursery / Preschool | 0 | 0.0% |
| Kindergarten | 0 | 0.0% |
| Elementary School | 32 | 12.2% |
| Middle School | 122 | 46.4% |
| High School | 77 | 29.3% |
| College / Undergraduate | 32 | 12.2% |
| Graduate / Professional | 0 | 0.0% |
| Total | 263 | 100.0% |
School Enrollment by Age by Funding Source in Del Rio
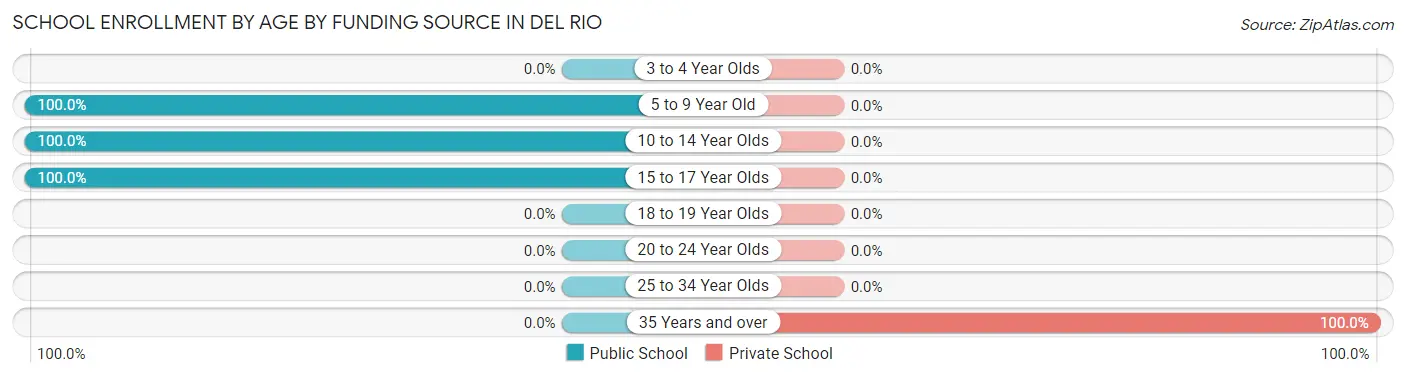
Out of a total of 263 students who are enrolled in schools in Del Rio, 32 (12.2%) attend a private institution, while the remaining 231 (87.8%) are enrolled in public schools. The age group of 35 years and over has the highest likelihood of being enrolled in private schools, with 32 (100.0% in the age bracket) enrolled. Conversely, the age group of 5 to 9 year old has the lowest likelihood of being enrolled in a private school, with 16 (100.0% in the age bracket) attending a public institution.
| Age Bracket | Public School | Private School |
| 3 to 4 Year Olds | 0 (0.0%) | 0 (0.0%) |
| 5 to 9 Year Old | 16 (100.0%) | 0 (0.0%) |
| 10 to 14 Year Olds | 138 (100.0%) | 0 (0.0%) |
| 15 to 17 Year Olds | 77 (100.0%) | 0 (0.0%) |
| 18 to 19 Year Olds | 0 (0.0%) | 0 (0.0%) |
| 20 to 24 Year Olds | 0 (0.0%) | 0 (0.0%) |
| 25 to 34 Year Olds | 0 (0.0%) | 0 (0.0%) |
| 35 Years and over | 0 (0.0%) | 32 (100.0%) |
| Total | 231 (87.8%) | 32 (12.2%) |
Educational Attainment by Field of Study in Del Rio
Social sciences (121 | 23.2%), business (103 | 19.7%), engineering (59 | 11.3%), literature & languages (57 | 10.9%), and psychology (46 | 8.8%) are the most common fields of study among 522 individuals in Del Rio who have obtained a bachelor's degree or higher.
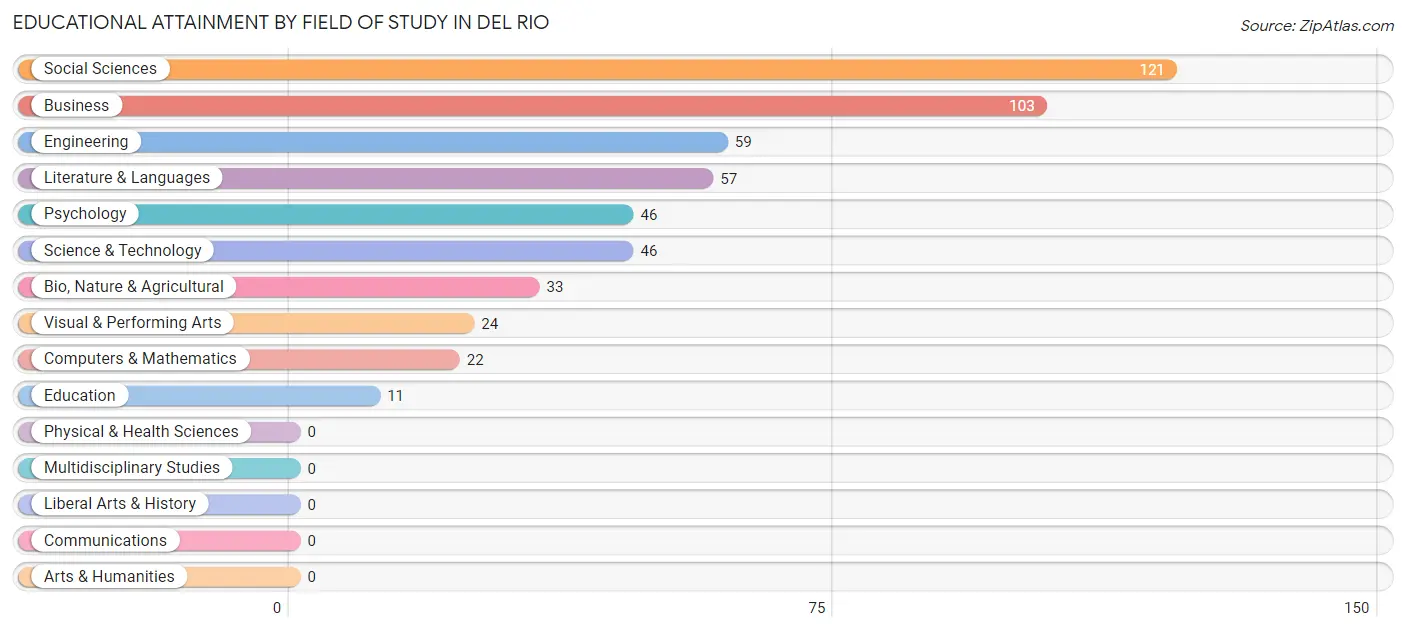
| Field of Study | # Graduates | % Graduates |
| Computers & Mathematics | 22 | 4.2% |
| Bio, Nature & Agricultural | 33 | 6.3% |
| Physical & Health Sciences | 0 | 0.0% |
| Psychology | 46 | 8.8% |
| Social Sciences | 121 | 23.2% |
| Engineering | 59 | 11.3% |
| Multidisciplinary Studies | 0 | 0.0% |
| Science & Technology | 46 | 8.8% |
| Business | 103 | 19.7% |
| Education | 11 | 2.1% |
| Literature & Languages | 57 | 10.9% |
| Liberal Arts & History | 0 | 0.0% |
| Visual & Performing Arts | 24 | 4.6% |
| Communications | 0 | 0.0% |
| Arts & Humanities | 0 | 0.0% |
| Total | 522 | 100.0% |
Transportation & Commute in Del Rio
Vehicle Availability by Sex in Del Rio
The most prevalent vehicle ownership categories in Del Rio are males with 3 vehicles (146, accounting for 50.9%) and females with 3 vehicles (16, making up 200.0%).
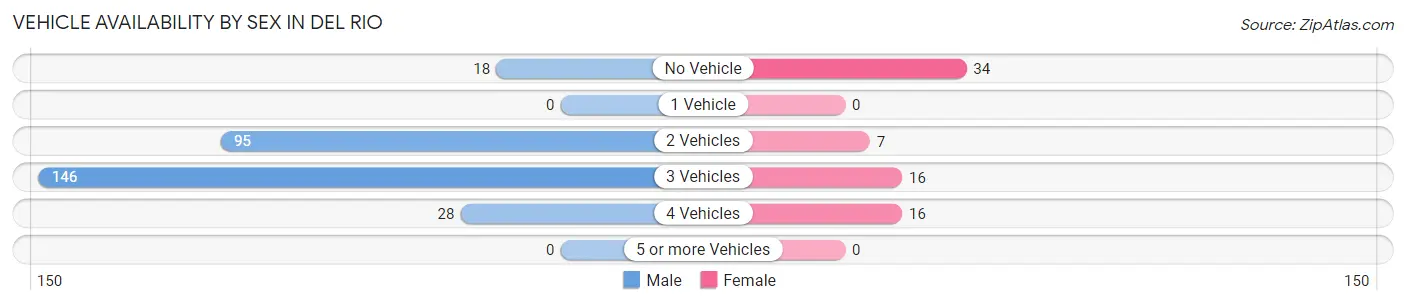
| Vehicles Available | Male | Female |
| No Vehicle | 18 (6.3%) | 34 (46.6%) |
| 1 Vehicle | 0 (0.0%) | 0 (0.0%) |
| 2 Vehicles | 95 (33.1%) | 7 (9.6%) |
| 3 Vehicles | 146 (50.9%) | 16 (21.9%) |
| 4 Vehicles | 28 (9.8%) | 16 (21.9%) |
| 5 or more Vehicles | 0 (0.0%) | 0 (0.0%) |
| Total | 287 (100.0%) | 73 (100.0%) |
Commute Time in Del Rio
The most frequently occuring commute durations in Del Rio are 5 to 9 minutes (56 commuters, 18.9%), 90 or more minutes (55 commuters, 18.6%), and 20 to 24 minutes (53 commuters, 17.9%).
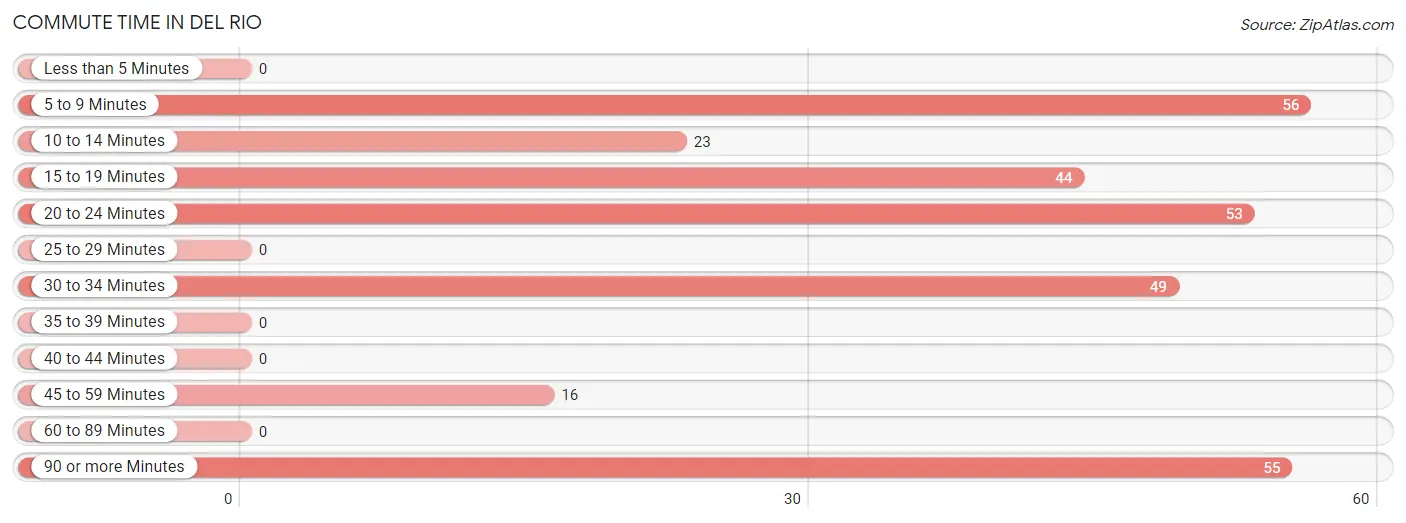
| Commute Time | # Commuters | % Commuters |
| Less than 5 Minutes | 0 | 0.0% |
| 5 to 9 Minutes | 56 | 18.9% |
| 10 to 14 Minutes | 23 | 7.8% |
| 15 to 19 Minutes | 44 | 14.9% |
| 20 to 24 Minutes | 53 | 17.9% |
| 25 to 29 Minutes | 0 | 0.0% |
| 30 to 34 Minutes | 49 | 16.6% |
| 35 to 39 Minutes | 0 | 0.0% |
| 40 to 44 Minutes | 0 | 0.0% |
| 45 to 59 Minutes | 16 | 5.4% |
| 60 to 89 Minutes | 0 | 0.0% |
| 90 or more Minutes | 55 | 18.6% |
Commute Time by Sex in Del Rio
The most common commute times in Del Rio are 90 or more minutes (55 commuters, 24.7%) for males and 30 to 34 minutes (35 commuters, 47.9%) for females.
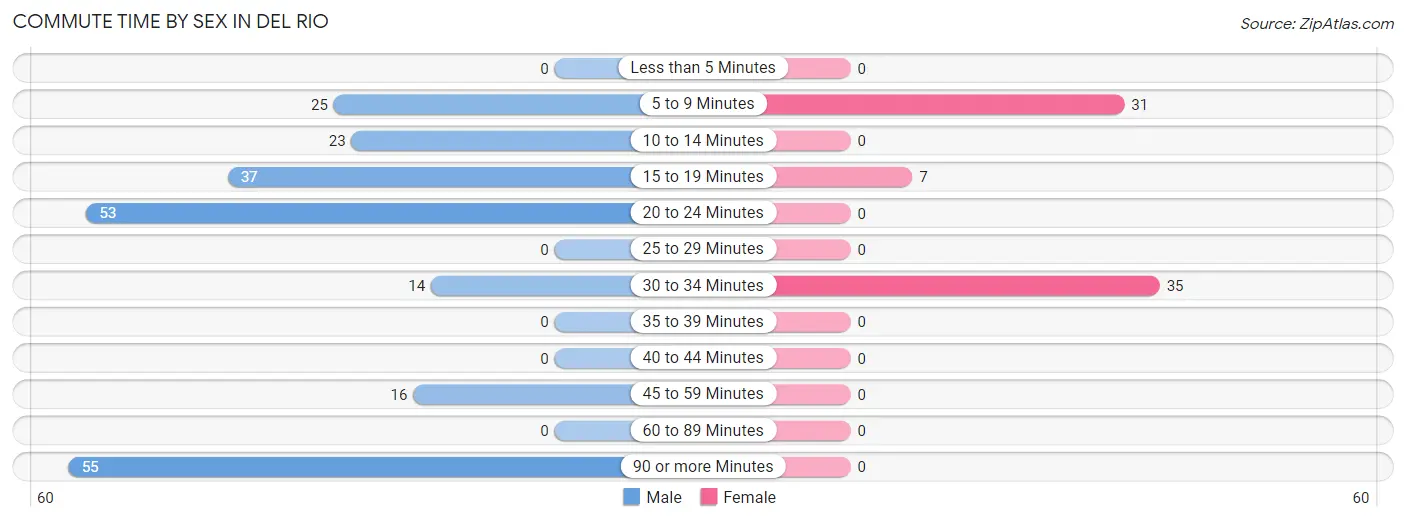
| Commute Time | Male | Female |
| Less than 5 Minutes | 0 (0.0%) | 0 (0.0%) |
| 5 to 9 Minutes | 25 (11.2%) | 31 (42.5%) |
| 10 to 14 Minutes | 23 (10.3%) | 0 (0.0%) |
| 15 to 19 Minutes | 37 (16.6%) | 7 (9.6%) |
| 20 to 24 Minutes | 53 (23.8%) | 0 (0.0%) |
| 25 to 29 Minutes | 0 (0.0%) | 0 (0.0%) |
| 30 to 34 Minutes | 14 (6.3%) | 35 (47.9%) |
| 35 to 39 Minutes | 0 (0.0%) | 0 (0.0%) |
| 40 to 44 Minutes | 0 (0.0%) | 0 (0.0%) |
| 45 to 59 Minutes | 16 (7.2%) | 0 (0.0%) |
| 60 to 89 Minutes | 0 (0.0%) | 0 (0.0%) |
| 90 or more Minutes | 55 (24.7%) | 0 (0.0%) |
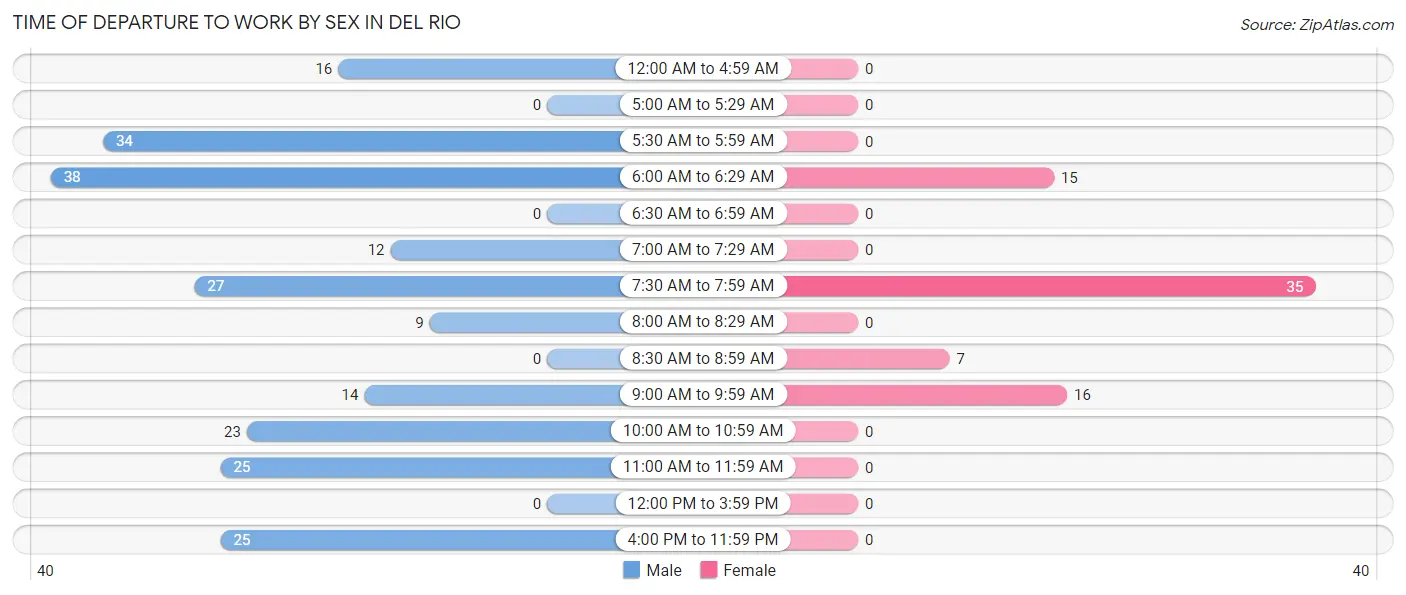
Time of Departure to Work by Sex in Del Rio
The most frequent times of departure to work in Del Rio are 6:00 AM to 6:29 AM (38, 17.0%) for males and 7:30 AM to 7:59 AM (35, 47.9%) for females.
| Time of Departure | Male | Female |
| 12:00 AM to 4:59 AM | 16 (7.2%) | 0 (0.0%) |
| 5:00 AM to 5:29 AM | 0 (0.0%) | 0 (0.0%) |
| 5:30 AM to 5:59 AM | 34 (15.2%) | 0 (0.0%) |
| 6:00 AM to 6:29 AM | 38 (17.0%) | 15 (20.5%) |
| 6:30 AM to 6:59 AM | 0 (0.0%) | 0 (0.0%) |
| 7:00 AM to 7:29 AM | 12 (5.4%) | 0 (0.0%) |
| 7:30 AM to 7:59 AM | 27 (12.1%) | 35 (47.9%) |
| 8:00 AM to 8:29 AM | 9 (4.0%) | 0 (0.0%) |
| 8:30 AM to 8:59 AM | 0 (0.0%) | 7 (9.6%) |
| 9:00 AM to 9:59 AM | 14 (6.3%) | 16 (21.9%) |
| 10:00 AM to 10:59 AM | 23 (10.3%) | 0 (0.0%) |
| 11:00 AM to 11:59 AM | 25 (11.2%) | 0 (0.0%) |
| 12:00 PM to 3:59 PM | 0 (0.0%) | 0 (0.0%) |
| 4:00 PM to 11:59 PM | 25 (11.2%) | 0 (0.0%) |
| Total | 223 (100.0%) | 73 (100.0%) |
Housing Occupancy in Del Rio
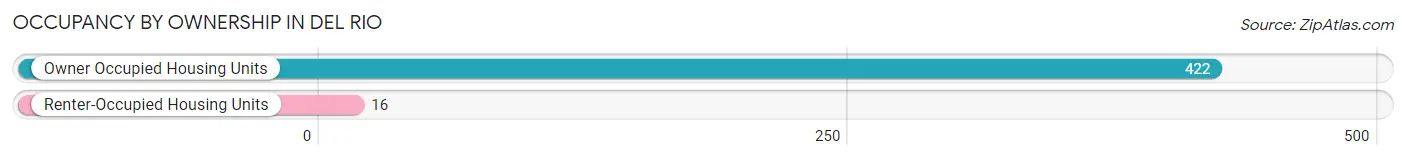
Occupancy by Ownership in Del Rio
Of the total 438 dwellings in Del Rio, owner-occupied units account for 422 (96.4%), while renter-occupied units make up 16 (3.6%).
| Occupancy | # Housing Units | % Housing Units |
| Owner Occupied Housing Units | 422 | 96.4% |
| Renter-Occupied Housing Units | 16 | 3.6% |
| Total Occupied Housing Units | 438 | 100.0% |
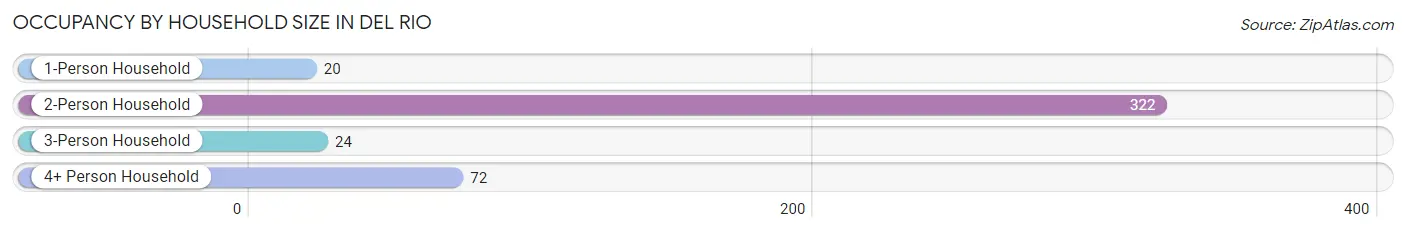
Occupancy by Household Size in Del Rio
| Household Size | # Housing Units | % Housing Units |
| 1-Person Household | 20 | 4.6% |
| 2-Person Household | 322 | 73.5% |
| 3-Person Household | 24 | 5.5% |
| 4+ Person Household | 72 | 16.4% |
| Total Housing Units | 438 | 100.0% |
Occupancy by Ownership by Household Size in Del Rio
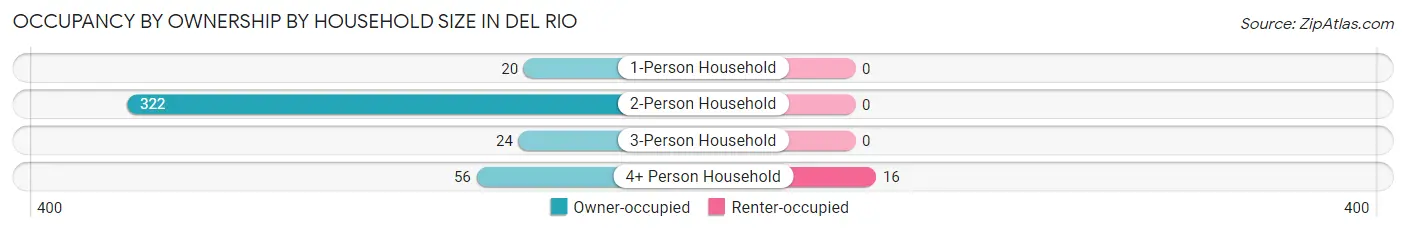
| Household Size | Owner-occupied | Renter-occupied |
| 1-Person Household | 20 (100.0%) | 0 (0.0%) |
| 2-Person Household | 322 (100.0%) | 0 (0.0%) |
| 3-Person Household | 24 (100.0%) | 0 (0.0%) |
| 4+ Person Household | 56 (77.8%) | 16 (22.2%) |
| Total Housing Units | 422 (96.4%) | 16 (3.6%) |
Occupancy by Educational Attainment in Del Rio
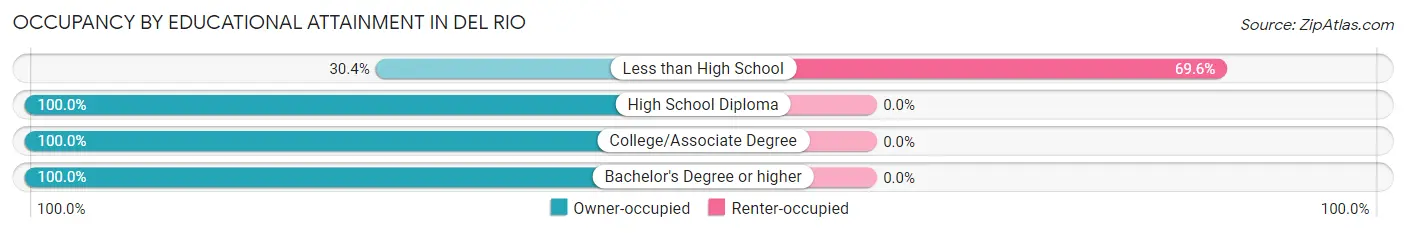
| Household Size | Owner-occupied | Renter-occupied |
| Less than High School | 7 (30.4%) | 16 (69.6%) |
| High School Diploma | 35 (100.0%) | 0 (0.0%) |
| College/Associate Degree | 79 (100.0%) | 0 (0.0%) |
| Bachelor's Degree or higher | 301 (100.0%) | 0 (0.0%) |
Occupancy by Age of Householder in Del Rio
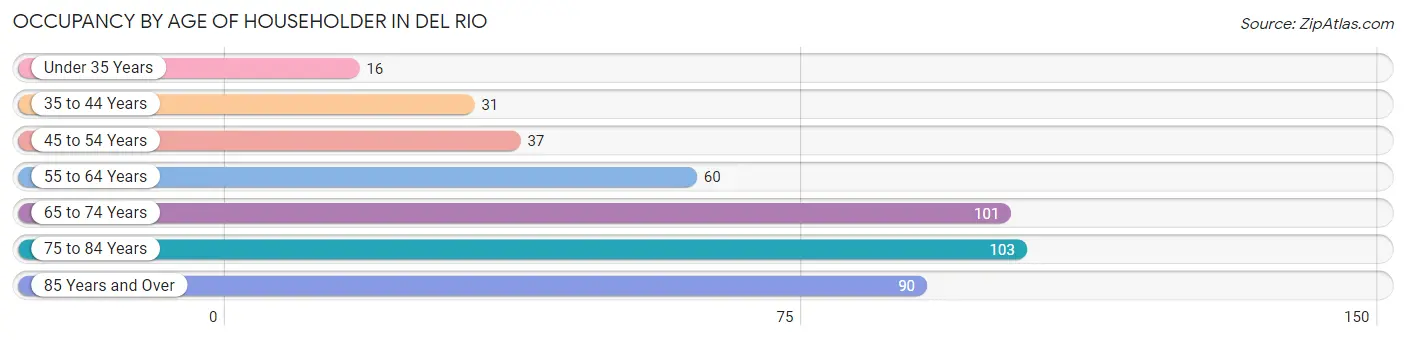
| Age Bracket | # Households | % Households |
| Under 35 Years | 16 | 3.6% |
| 35 to 44 Years | 31 | 7.1% |
| 45 to 54 Years | 37 | 8.5% |
| 55 to 64 Years | 60 | 13.7% |
| 65 to 74 Years | 101 | 23.1% |
| 75 to 84 Years | 103 | 23.5% |
| 85 Years and Over | 90 | 20.5% |
| Total | 438 | 100.0% |
Housing Finances in Del Rio
Median Income by Occupancy in Del Rio
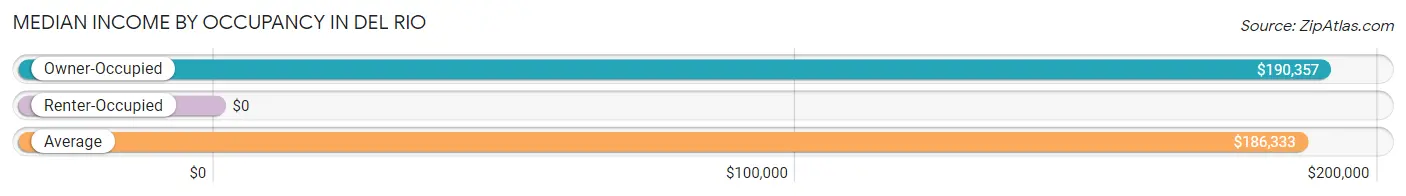
| Occupancy Type | # Households | Median Income |
| Owner-Occupied | 422 (96.4%) | $190,357 |
| Renter-Occupied | 16 (3.6%) | $0 |
| Average | 438 (100.0%) | $186,333 |
Occupancy by Householder Income Bracket in Del Rio
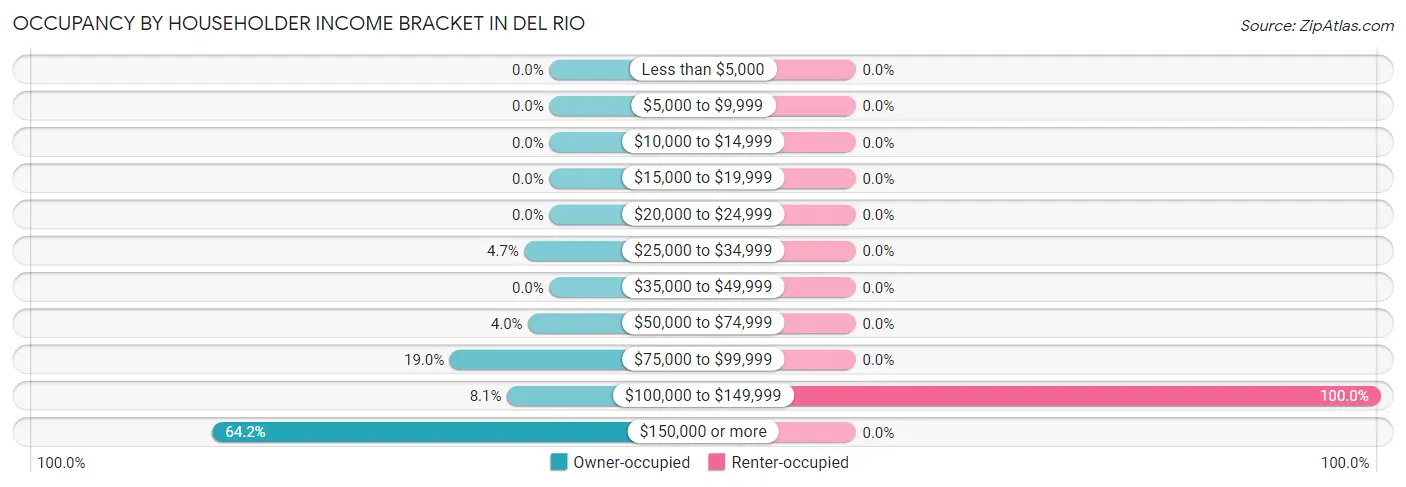
| Income Bracket | Owner-occupied | Renter-occupied |
| Less than $5,000 | 0 (0.0%) | 0 (0.0%) |
| $5,000 to $9,999 | 0 (0.0%) | 0 (0.0%) |
| $10,000 to $14,999 | 0 (0.0%) | 0 (0.0%) |
| $15,000 to $19,999 | 0 (0.0%) | 0 (0.0%) |
| $20,000 to $24,999 | 0 (0.0%) | 0 (0.0%) |
| $25,000 to $34,999 | 20 (4.7%) | 0 (0.0%) |
| $35,000 to $49,999 | 0 (0.0%) | 0 (0.0%) |
| $50,000 to $74,999 | 17 (4.0%) | 0 (0.0%) |
| $75,000 to $99,999 | 80 (19.0%) | 0 (0.0%) |
| $100,000 to $149,999 | 34 (8.1%) | 16 (100.0%) |
| $150,000 or more | 271 (64.2%) | 0 (0.0%) |
| Total | 422 (100.0%) | 16 (100.0%) |
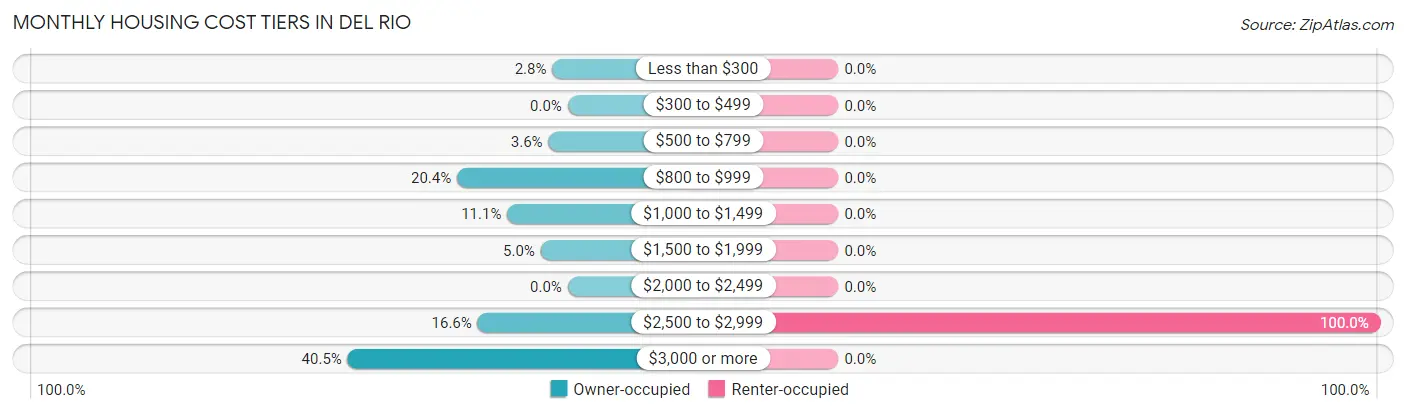
Monthly Housing Cost Tiers in Del Rio
| Monthly Cost | Owner-occupied | Renter-occupied |
| Less than $300 | 12 (2.8%) | 0 (0.0%) |
| $300 to $499 | 0 (0.0%) | 0 (0.0%) |
| $500 to $799 | 15 (3.5%) | 0 (0.0%) |
| $800 to $999 | 86 (20.4%) | 0 (0.0%) |
| $1,000 to $1,499 | 47 (11.1%) | 0 (0.0%) |
| $1,500 to $1,999 | 21 (5.0%) | 0 (0.0%) |
| $2,000 to $2,499 | 0 (0.0%) | 0 (0.0%) |
| $2,500 to $2,999 | 70 (16.6%) | 16 (100.0%) |
| $3,000 or more | 171 (40.5%) | 0 (0.0%) |
| Total | 422 (100.0%) | 16 (100.0%) |
Physical Housing Characteristics in Del Rio
Housing Structures in Del Rio
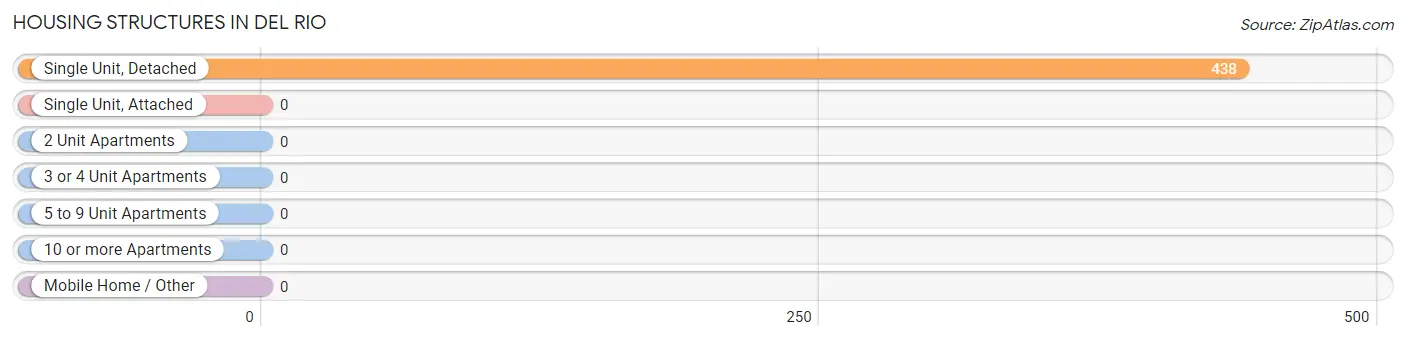
| Structure Type | # Housing Units | % Housing Units |
| Single Unit, Detached | 438 | 100.0% |
| Single Unit, Attached | 0 | 0.0% |
| 2 Unit Apartments | 0 | 0.0% |
| 3 or 4 Unit Apartments | 0 | 0.0% |
| 5 to 9 Unit Apartments | 0 | 0.0% |
| 10 or more Apartments | 0 | 0.0% |
| Mobile Home / Other | 0 | 0.0% |
| Total | 438 | 100.0% |
Housing Structures by Occupancy in Del Rio
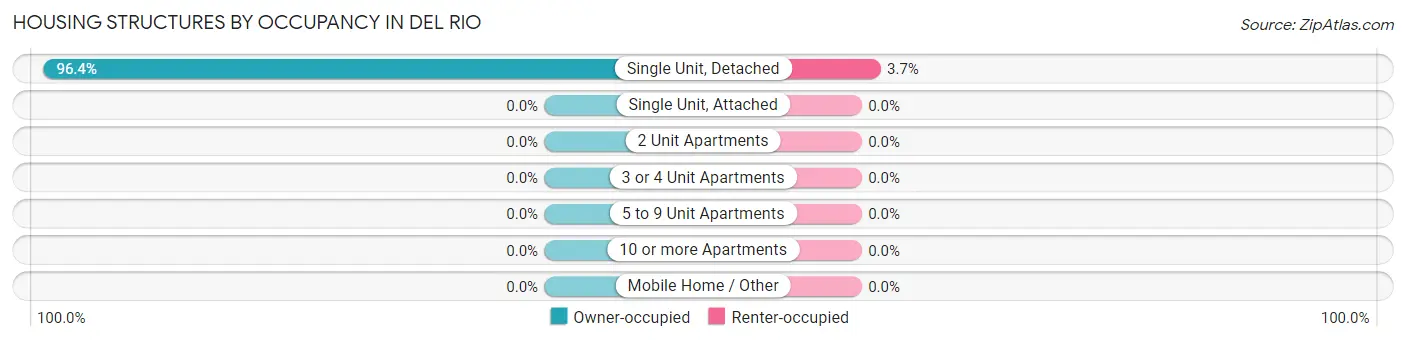
| Structure Type | Owner-occupied | Renter-occupied |
| Single Unit, Detached | 422 (96.4%) | 16 (3.6%) |
| Single Unit, Attached | 0 (0.0%) | 0 (0.0%) |
| 2 Unit Apartments | 0 (0.0%) | 0 (0.0%) |
| 3 or 4 Unit Apartments | 0 (0.0%) | 0 (0.0%) |
| 5 to 9 Unit Apartments | 0 (0.0%) | 0 (0.0%) |
| 10 or more Apartments | 0 (0.0%) | 0 (0.0%) |
| Mobile Home / Other | 0 (0.0%) | 0 (0.0%) |
| Total | 422 (96.4%) | 16 (3.6%) |
Housing Structures by Number of Rooms in Del Rio
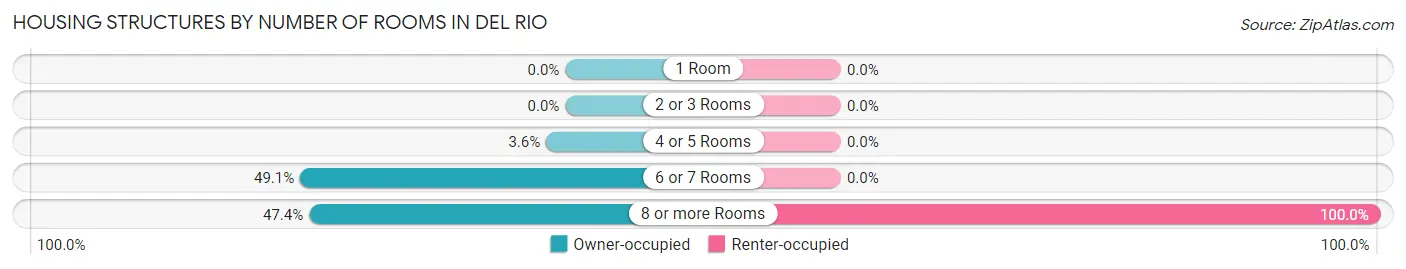
| Number of Rooms | Owner-occupied | Renter-occupied |
| 1 Room | 0 (0.0%) | 0 (0.0%) |
| 2 or 3 Rooms | 0 (0.0%) | 0 (0.0%) |
| 4 or 5 Rooms | 15 (3.5%) | 0 (0.0%) |
| 6 or 7 Rooms | 207 (49.0%) | 0 (0.0%) |
| 8 or more Rooms | 200 (47.4%) | 16 (100.0%) |
| Total | 422 (100.0%) | 16 (100.0%) |
Housing Structure by Heating Type in Del Rio
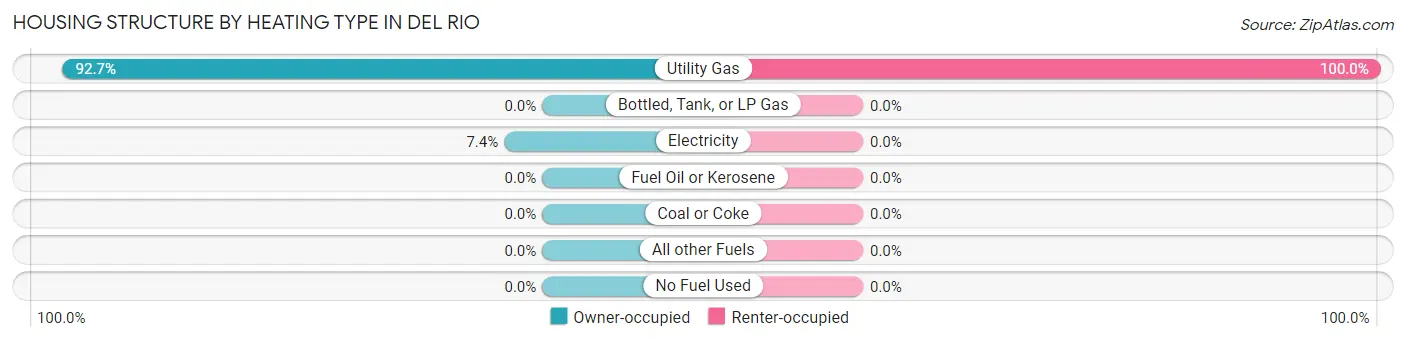
| Heating Type | Owner-occupied | Renter-occupied |
| Utility Gas | 391 (92.6%) | 16 (100.0%) |
| Bottled, Tank, or LP Gas | 0 (0.0%) | 0 (0.0%) |
| Electricity | 31 (7.3%) | 0 (0.0%) |
| Fuel Oil or Kerosene | 0 (0.0%) | 0 (0.0%) |
| Coal or Coke | 0 (0.0%) | 0 (0.0%) |
| All other Fuels | 0 (0.0%) | 0 (0.0%) |
| No Fuel Used | 0 (0.0%) | 0 (0.0%) |
| Total | 422 (100.0%) | 16 (100.0%) |
Household Vehicle Usage in Del Rio
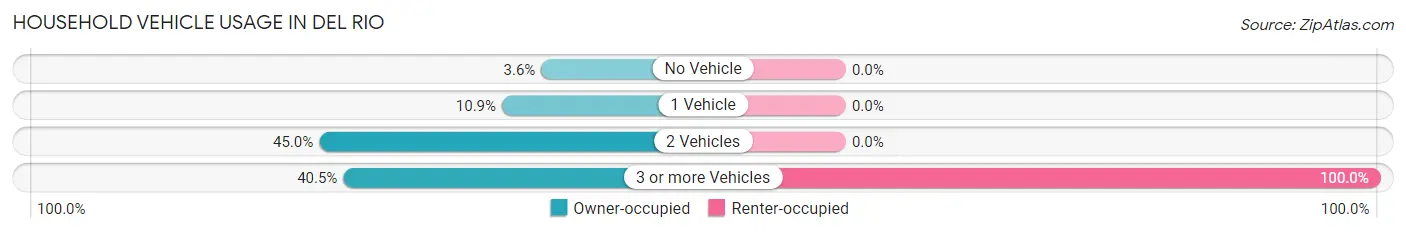
| Vehicles per Household | Owner-occupied | Renter-occupied |
| No Vehicle | 15 (3.5%) | 0 (0.0%) |
| 1 Vehicle | 46 (10.9%) | 0 (0.0%) |
| 2 Vehicles | 190 (45.0%) | 0 (0.0%) |
| 3 or more Vehicles | 171 (40.5%) | 16 (100.0%) |
| Total | 422 (100.0%) | 16 (100.0%) |
Real Estate & Mortgages in Del Rio
Real Estate and Mortgage Overview in Del Rio
| Characteristic | Without Mortgage | With Mortgage |
| Housing Units | 251 | 171 |
| Median Property Value | $1,022,800 | $1,452,100 |
| Median Household Income | $173,359 | $128 |
| Monthly Housing Costs | $1,040 | $171 |
| Real Estate Taxes | $7,596 | $0 |
Property Value by Mortgage Status in Del Rio
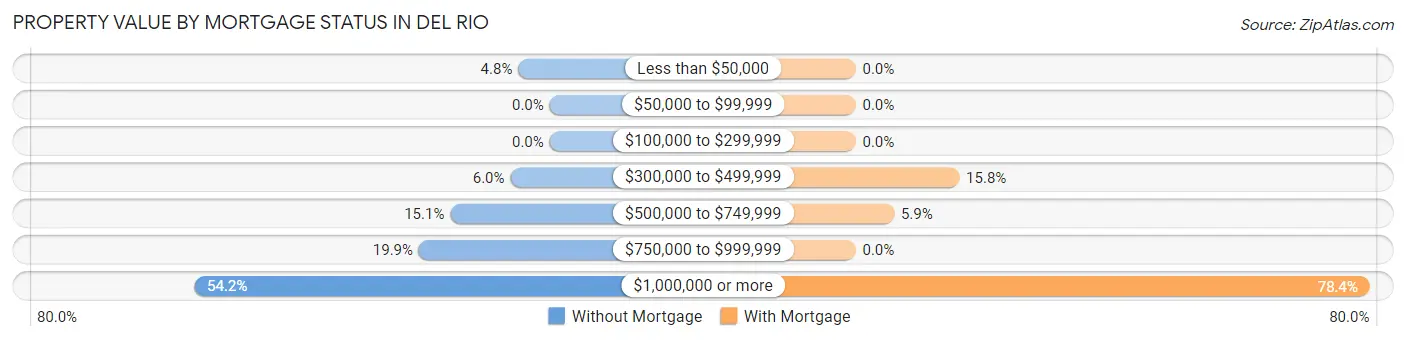
| Property Value | Without Mortgage | With Mortgage |
| Less than $50,000 | 12 (4.8%) | 0 (0.0%) |
| $50,000 to $99,999 | 0 (0.0%) | 0 (0.0%) |
| $100,000 to $299,999 | 0 (0.0%) | 0 (0.0%) |
| $300,000 to $499,999 | 15 (6.0%) | 27 (15.8%) |
| $500,000 to $749,999 | 38 (15.1%) | 10 (5.9%) |
| $750,000 to $999,999 | 50 (19.9%) | 0 (0.0%) |
| $1,000,000 or more | 136 (54.2%) | 134 (78.4%) |
| Total | 251 (100.0%) | 171 (100.0%) |
Household Income by Mortgage Status in Del Rio
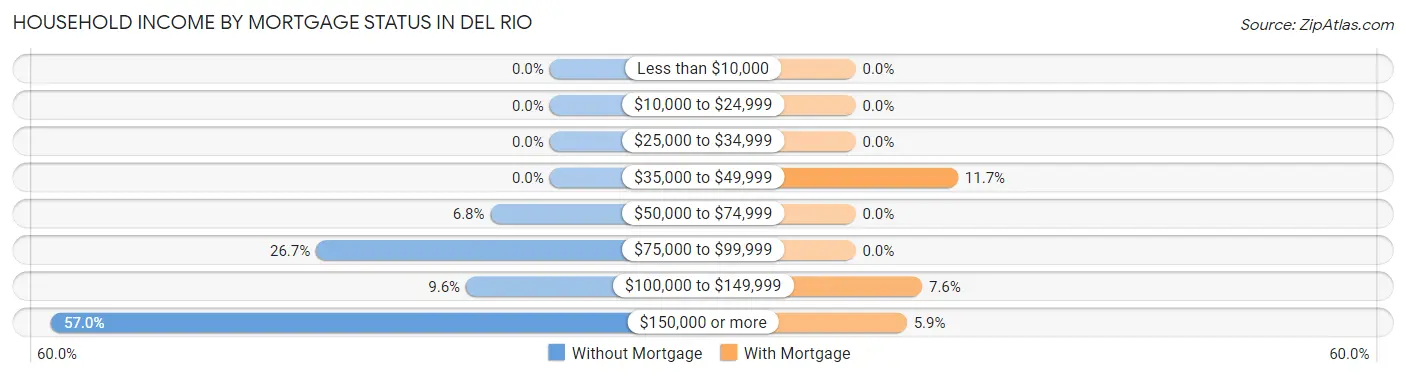
| Household Income | Without Mortgage | With Mortgage |
| Less than $10,000 | 0 (0.0%) | 0 (0.0%) |
| $10,000 to $24,999 | 0 (0.0%) | 0 (0.0%) |
| $25,000 to $34,999 | 0 (0.0%) | 0 (0.0%) |
| $35,000 to $49,999 | 0 (0.0%) | 20 (11.7%) |
| $50,000 to $74,999 | 17 (6.8%) | 0 (0.0%) |
| $75,000 to $99,999 | 67 (26.7%) | 0 (0.0%) |
| $100,000 to $149,999 | 24 (9.6%) | 13 (7.6%) |
| $150,000 or more | 143 (57.0%) | 10 (5.9%) |
| Total | 251 (100.0%) | 171 (100.0%) |
Property Value to Household Income Ratio in Del Rio
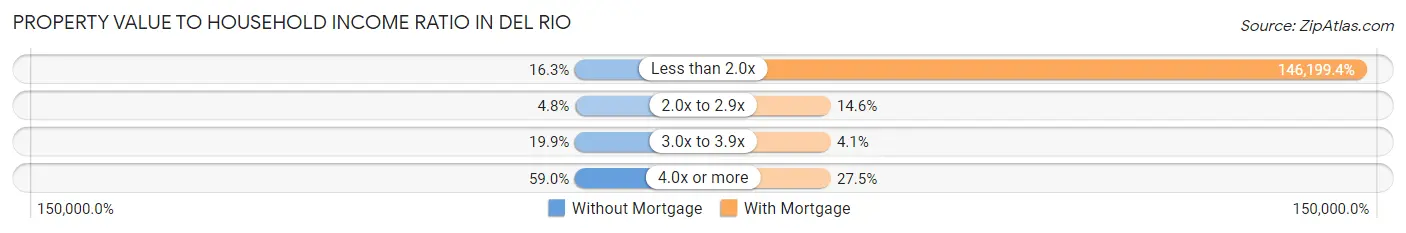
| Value-to-Income Ratio | Without Mortgage | With Mortgage |
| Less than 2.0x | 41 (16.3%) | 250,001 (146,199.4%) |
| 2.0x to 2.9x | 12 (4.8%) | 25 (14.6%) |
| 3.0x to 3.9x | 50 (19.9%) | 7 (4.1%) |
| 4.0x or more | 148 (59.0%) | 47 (27.5%) |
| Total | 251 (100.0%) | 171 (100.0%) |
Real Estate Taxes by Mortgage Status in Del Rio

| Property Taxes | Without Mortgage | With Mortgage |
| Less than $800 | 0 (0.0%) | 0 (0.0%) |
| $800 to $1,499 | 0 (0.0%) | 0 (0.0%) |
| $800 to $1,499 | 239 (95.2%) | 0 (0.0%) |
| Total | 251 (100.0%) | 171 (100.0%) |
Health & Disability in Del Rio
Health Insurance Coverage by Age in Del Rio
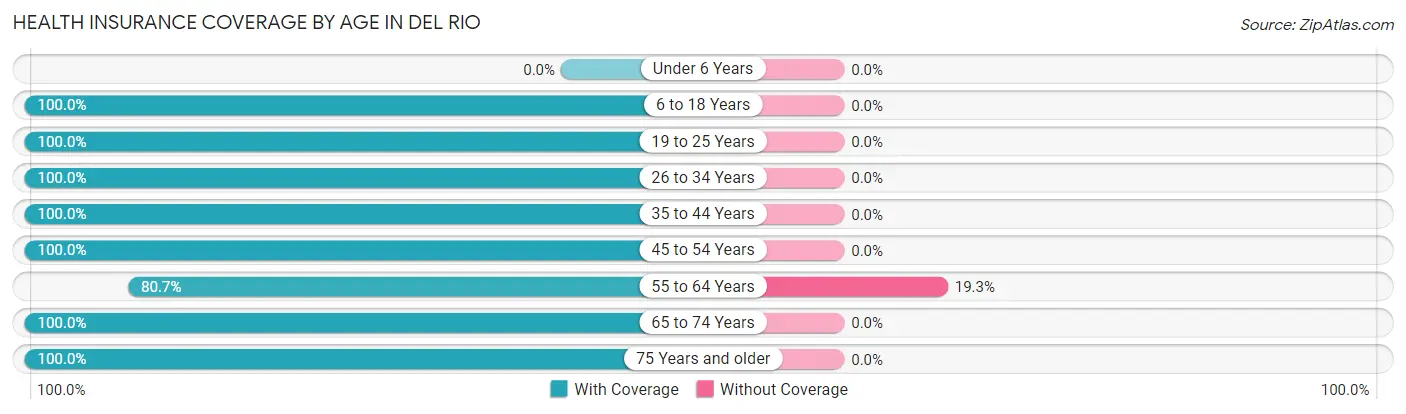
| Age Bracket | With Coverage | Without Coverage |
| Under 6 Years | 0 (0.0%) | 0 (0.0%) |
| 6 to 18 Years | 231 (100.0%) | 0 (0.0%) |
| 19 to 25 Years | 27 (100.0%) | 0 (0.0%) |
| 26 to 34 Years | 16 (100.0%) | 0 (0.0%) |
| 35 to 44 Years | 81 (100.0%) | 0 (0.0%) |
| 45 to 54 Years | 73 (100.0%) | 0 (0.0%) |
| 55 to 64 Years | 138 (80.7%) | 33 (19.3%) |
| 65 to 74 Years | 193 (100.0%) | 0 (0.0%) |
| 75 Years and older | 354 (100.0%) | 0 (0.0%) |
| Total | 1,113 (97.1%) | 33 (2.9%) |
Health Insurance Coverage by Citizenship Status in Del Rio

| Citizenship Status | With Coverage | Without Coverage |
| Native Born | 0 (0.0%) | 0 (0.0%) |
| Foreign Born, Citizen | 231 (100.0%) | 0 (0.0%) |
| Foreign Born, not a Citizen | 27 (100.0%) | 0 (0.0%) |
Health Insurance Coverage by Household Income in Del Rio

| Household Income | With Coverage | Without Coverage |
| Under $25,000 | 0 (0.0%) | 0 (0.0%) |
| $25,000 to $49,999 | 20 (100.0%) | 0 (0.0%) |
| $50,000 to $74,999 | 54 (100.0%) | 0 (0.0%) |
| $75,000 to $99,999 | 163 (100.0%) | 0 (0.0%) |
| $100,000 and over | 876 (96.4%) | 33 (3.6%) |
Public vs Private Health Insurance Coverage by Age in Del Rio
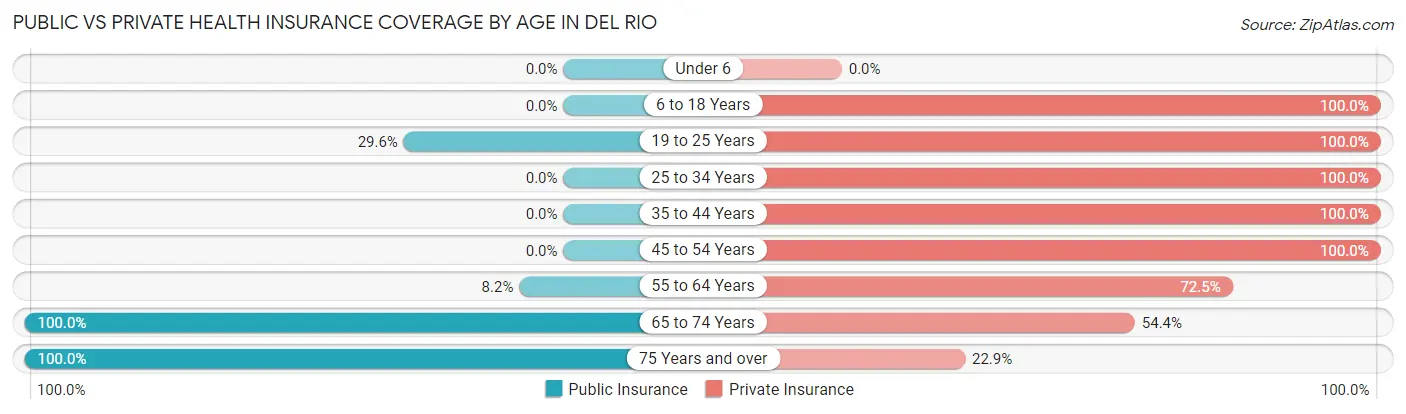
| Age Bracket | Public Insurance | Private Insurance |
| Under 6 | 0 (0.0%) | 0 (0.0%) |
| 6 to 18 Years | 0 (0.0%) | 231 (100.0%) |
| 19 to 25 Years | 8 (29.6%) | 27 (100.0%) |
| 25 to 34 Years | 0 (0.0%) | 16 (100.0%) |
| 35 to 44 Years | 0 (0.0%) | 81 (100.0%) |
| 45 to 54 Years | 0 (0.0%) | 73 (100.0%) |
| 55 to 64 Years | 14 (8.2%) | 124 (72.5%) |
| 65 to 74 Years | 193 (100.0%) | 105 (54.4%) |
| 75 Years and over | 354 (100.0%) | 81 (22.9%) |
| Total | 569 (49.6%) | 738 (64.4%) |
Disability Status by Sex by Age in Del Rio
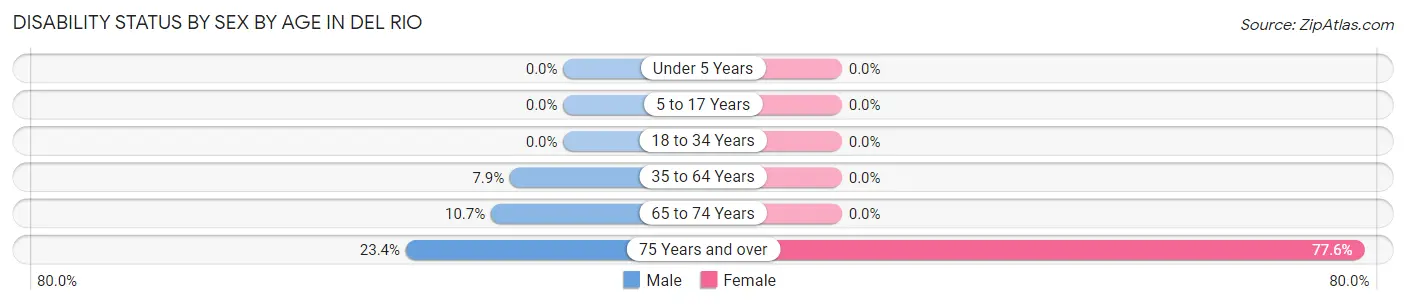
| Age Bracket | Male | Female |
| Under 5 Years | 0 (0.0%) | 0 (0.0%) |
| 5 to 17 Years | 0 (0.0%) | 0 (0.0%) |
| 18 to 34 Years | 0 (0.0%) | 0 (0.0%) |
| 35 to 64 Years | 14 (7.9%) | 0 (0.0%) |
| 65 to 74 Years | 13 (10.7%) | 0 (0.0%) |
| 75 Years and over | 40 (23.4%) | 142 (77.6%) |
Disability Class by Sex by Age in Del Rio
Disability Class: Hearing Difficulty
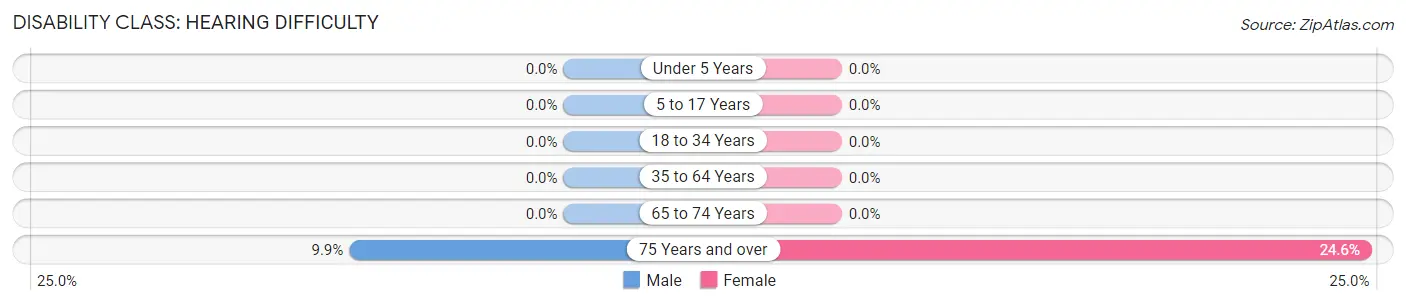
| Age Bracket | Male | Female |
| Under 5 Years | 0 (0.0%) | 0 (0.0%) |
| 5 to 17 Years | 0 (0.0%) | 0 (0.0%) |
| 18 to 34 Years | 0 (0.0%) | 0 (0.0%) |
| 35 to 64 Years | 0 (0.0%) | 0 (0.0%) |
| 65 to 74 Years | 0 (0.0%) | 0 (0.0%) |
| 75 Years and over | 17 (9.9%) | 45 (24.6%) |
Disability Class: Vision Difficulty
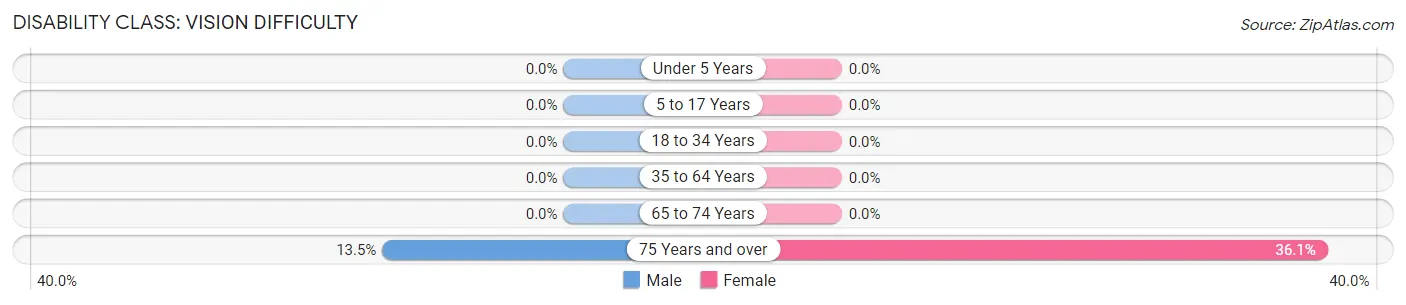
| Age Bracket | Male | Female |
| Under 5 Years | 0 (0.0%) | 0 (0.0%) |
| 5 to 17 Years | 0 (0.0%) | 0 (0.0%) |
| 18 to 34 Years | 0 (0.0%) | 0 (0.0%) |
| 35 to 64 Years | 0 (0.0%) | 0 (0.0%) |
| 65 to 74 Years | 0 (0.0%) | 0 (0.0%) |
| 75 Years and over | 23 (13.5%) | 66 (36.1%) |
Disability Class: Cognitive Difficulty
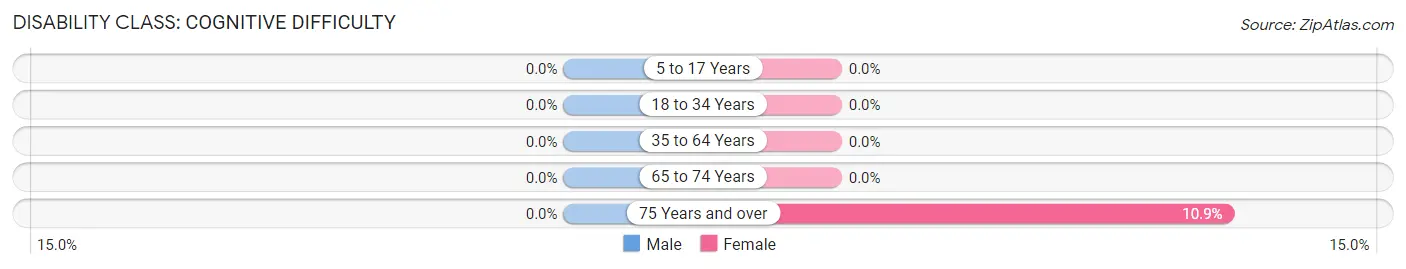
| Age Bracket | Male | Female |
| 5 to 17 Years | 0 (0.0%) | 0 (0.0%) |
| 18 to 34 Years | 0 (0.0%) | 0 (0.0%) |
| 35 to 64 Years | 0 (0.0%) | 0 (0.0%) |
| 65 to 74 Years | 0 (0.0%) | 0 (0.0%) |
| 75 Years and over | 0 (0.0%) | 20 (10.9%) |
Disability Class: Ambulatory Difficulty
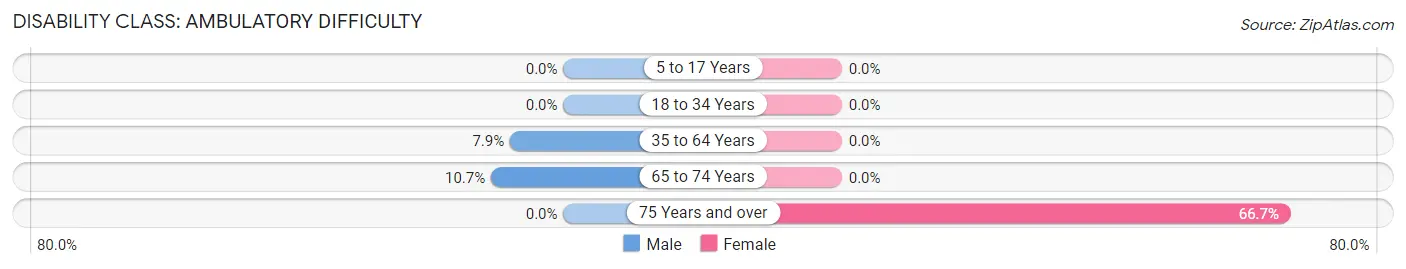
| Age Bracket | Male | Female |
| 5 to 17 Years | 0 (0.0%) | 0 (0.0%) |
| 18 to 34 Years | 0 (0.0%) | 0 (0.0%) |
| 35 to 64 Years | 14 (7.9%) | 0 (0.0%) |
| 65 to 74 Years | 13 (10.7%) | 0 (0.0%) |
| 75 Years and over | 0 (0.0%) | 122 (66.7%) |
Disability Class: Self-Care Difficulty
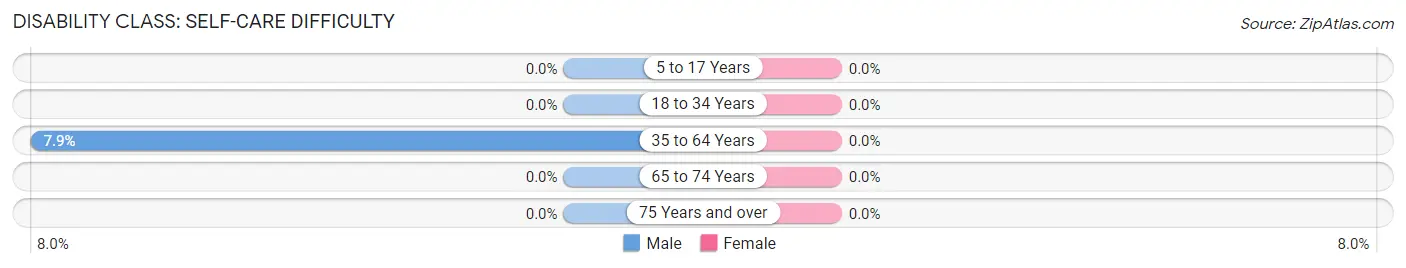
| Age Bracket | Male | Female |
| 5 to 17 Years | 0 (0.0%) | 0 (0.0%) |
| 18 to 34 Years | 0 (0.0%) | 0 (0.0%) |
| 35 to 64 Years | 14 (7.9%) | 0 (0.0%) |
| 65 to 74 Years | 0 (0.0%) | 0 (0.0%) |
| 75 Years and over | 0 (0.0%) | 0 (0.0%) |
Technology Access in Del Rio
Computing Device Access in Del Rio
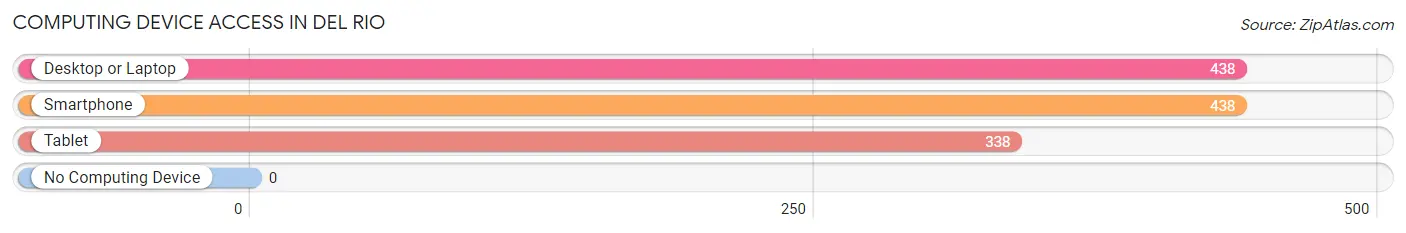
| Device Type | # Households | % Households |
| Desktop or Laptop | 438 | 100.0% |
| Smartphone | 438 | 100.0% |
| Tablet | 338 | 77.2% |
| No Computing Device | 0 | 0.0% |
| Total | 438 | 100.0% |
Internet Access in Del Rio
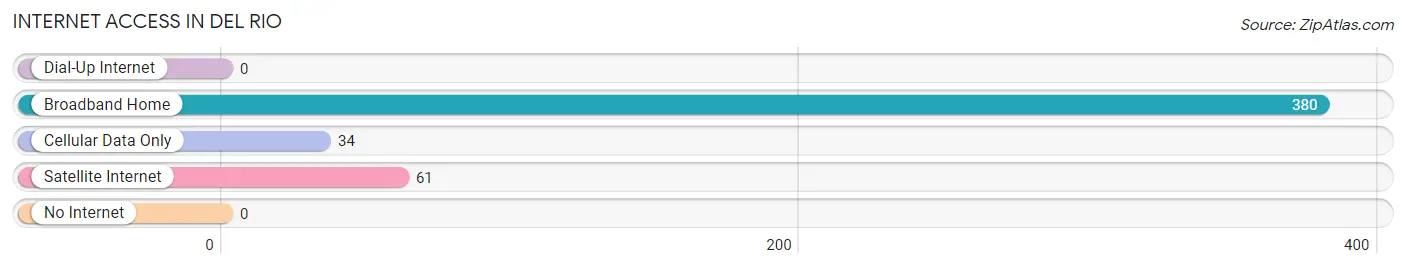
| Internet Type | # Households | % Households |
| Dial-Up Internet | 0 | 0.0% |
| Broadband Home | 380 | 86.8% |
| Cellular Data Only | 34 | 7.8% |
| Satellite Internet | 61 | 13.9% |
| No Internet | 0 | 0.0% |
| Total | 438 | 100.0% |
Del Rio Summary
Del Rio, California is a small town located in San Benito County, California. It is situated in the foothills of the Santa Cruz Mountains, about 25 miles south of San Jose. The town has a population of about 1,500 people and is known for its rural charm and small-town atmosphere.
History
Del Rio was founded in 1868 by a group of settlers from the nearby town of San Juan Bautista. The settlers were looking for a place to settle and farm, and they chose the area because of its fertile soil and abundant water supply. The town was originally called "Del Rio de San Juan Bautista," but the name was eventually shortened to Del Rio.
The town grew slowly over the years, and by the early 1900s, it had become a thriving agricultural community. The town was known for its production of fruits and vegetables, and it was also home to several dairies and a winery.
In the 1950s, the town began to experience a decline in population as people moved away to larger cities. However, in the late 1970s, the town experienced a resurgence in population as people began to move back to the area.
Geography
Del Rio is located in the foothills of the Santa Cruz Mountains, about 25 miles south of San Jose. The town is situated in a valley surrounded by rolling hills and is bordered by the Pajaro River to the east and the San Benito River to the west. The town is located at an elevation of about 1,000 feet and has a mild climate with warm summers and cool winters.
Economy
The economy of Del Rio is largely based on agriculture. The town is known for its production of fruits and vegetables, and it is also home to several dairies and a winery. In addition, the town is home to several small businesses, including a grocery store, a hardware store, and a few restaurants.
Demographics
As of the 2010 census, the population of Del Rio was 1,500. The town is predominantly Hispanic, with about 75% of the population identifying as Hispanic or Latino. The median household income in Del Rio is $45,000, and the median age is 37. The town is also home to a large number of immigrants, with about 25% of the population being foreign-born.
Conclusion
Del Rio is a small town located in San Benito County, California. It is situated in the foothills of the Santa Cruz Mountains, about 25 miles south of San Jose. The town has a population of about 1,500 people and is known for its rural charm and small-town atmosphere. The economy of Del Rio is largely based on agriculture, and the town is predominantly Hispanic. Del Rio is a great place to live for those looking for a quiet, rural lifestyle.
Common Questions
What is Per Capita Income in Del Rio?
Per Capita income in Del Rio is $118,591.
What is the Median Family Income in Del Rio?
Median Family Income in Del Rio is $191,071.
What is the Median Household income in Del Rio?
Median Household Income in Del Rio is $186,333.
What is Inequality or Gini Index in Del Rio?
Inequality or Gini Index in Del Rio is 0.52.
What is the Total Population of Del Rio?
Total Population of Del Rio is 1,146.
What is the Total Male Population of Del Rio?
Total Male Population of Del Rio is 555.
What is the Total Female Population of Del Rio?
Total Female Population of Del Rio is 591.
What is the Ratio of Males per 100 Females in Del Rio?
There are 93.91 Males per 100 Females in Del Rio.
What is the Ratio of Females per 100 Males in Del Rio?
There are 106.49 Females per 100 Males in Del Rio.
What is the Median Population Age in Del Rio?
Median Population Age in Del Rio is 63.6 Years.
What is the Average Family Size in Del Rio
Average Family Size in Del Rio is 2.7 People.
What is the Average Household Size in Del Rio
Average Household Size in Del Rio is 2.6 People.
How Large is the Labor Force in Del Rio?
There are 368 People in the Labor Forcein in Del Rio.
What is the Percentage of People in the Labor Force in Del Rio?
38.3% of People are in the Labor Force in Del Rio.
What is the Unemployment Rate in Del Rio?
Unemployment Rate in Del Rio is 2.2%.