Cities with the Highest Percentage of Households with Income Above $200,000 in Connecticut
RELATED REPORTS & OPTIONS
Household Income | $200k+
Connecticut
Compare Cities
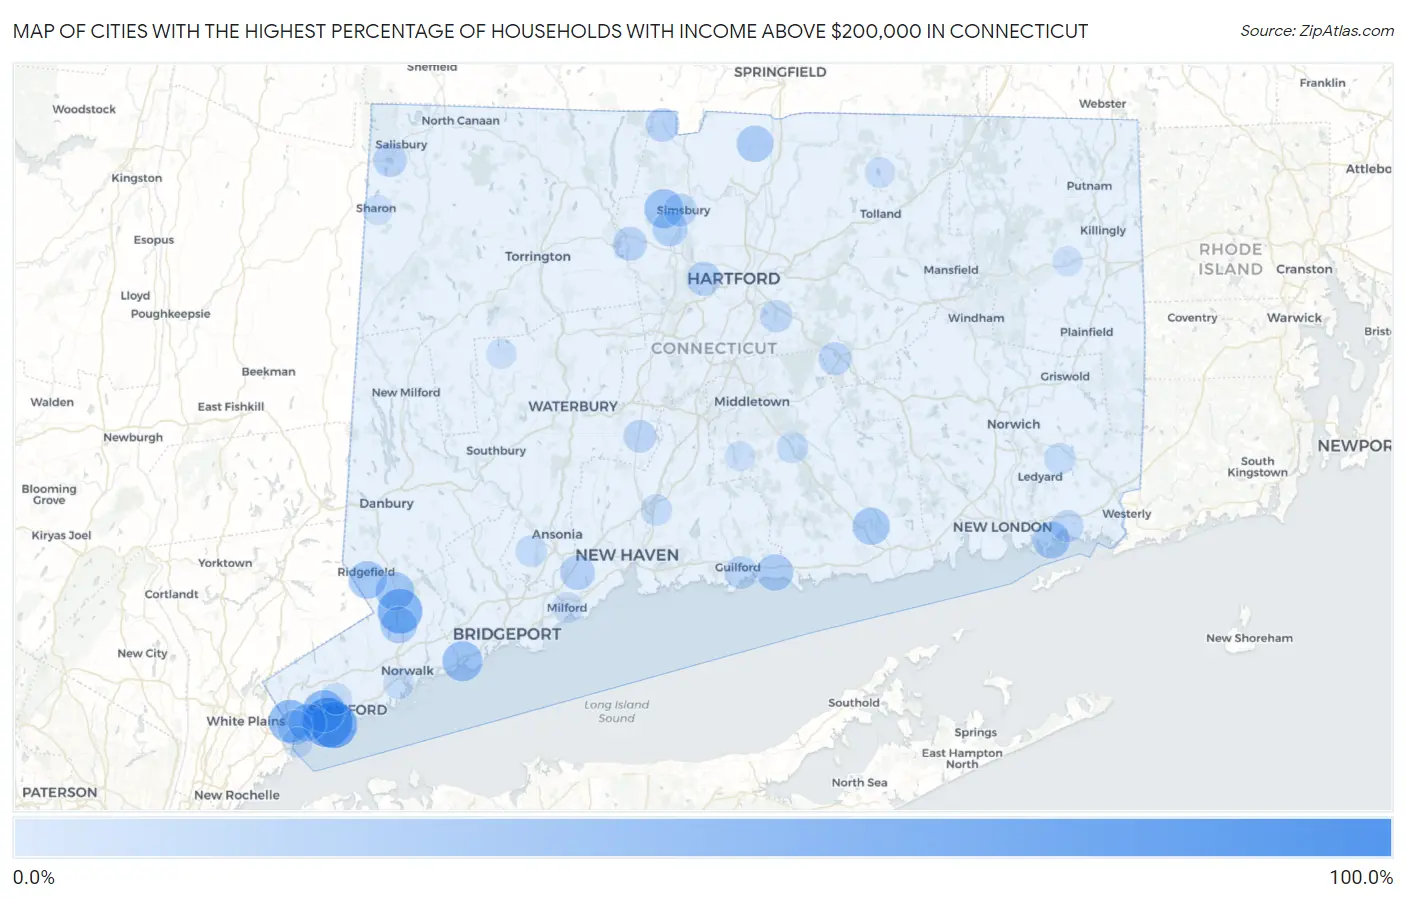
Map of Cities with the Highest Percentage of Households with Income Above $200,000 in Connecticut
0.0%
100.0%
Cities with the Highest Percentage of Households with Income Above $200,000 in Connecticut
| City | Households with Income > $200k | vs State | vs National | |
| 1. | West Mountain | 82.5% | 17.0%(+65.5)#1 | 11.4%(+71.1)#30 |
| 2. | Hawleyville | 78.9% | 17.0%(+61.9)#2 | 11.4%(+67.5)#35 |
| 3. | Witches Woods | 73.2% | 17.0%(+56.2)#3 | 11.4%(+61.8)#56 |
| 4. | Tokeneke | 73.0% | 17.0%(+56.0)#4 | 11.4%(+61.6)#57 |
| 5. | Sail Harbor | 72.9% | 17.0%(+55.9)#5 | 11.4%(+61.5)#60 |
| 6. | Old Hill | 67.1% | 17.0%(+50.1)#6 | 11.4%(+55.7)#97 |
| 7. | Greens Farms | 65.0% | 17.0%(+48.0)#7 | 11.4%(+53.6)#113 |
| 8. | Riverside | 64.6% | 17.0%(+47.6)#8 | 11.4%(+53.2)#120 |
| 9. | Coleytown | 60.8% | 17.0%(+43.8)#9 | 11.4%(+49.4)#171 |
| 10. | Mamanasco Lake | 60.2% | 17.0%(+43.2)#10 | 11.4%(+48.8)#182 |
| 11. | Brookfield Center | 60.0% | 17.0%(+43.0)#11 | 11.4%(+48.6)#186 |
| 12. | Noroton | 59.5% | 17.0%(+42.5)#12 | 11.4%(+48.1)#200 |
| 13. | Candlewood Isle | 59.5% | 17.0%(+42.5)#13 | 11.4%(+48.1)#201 |
| 14. | Candlewood Lake Club | 59.5% | 17.0%(+42.5)#14 | 11.4%(+48.1)#202 |
| 15. | Weston | 57.9% | 17.0%(+40.9)#15 | 11.4%(+46.5)#230 |
| 16. | Old Greenwich | 57.6% | 17.0%(+40.6)#16 | 11.4%(+46.2)#237 |
| 17. | Indian Field | 57.6% | 17.0%(+40.6)#17 | 11.4%(+46.2)#238 |
| 18. | Poplar Plains | 56.8% | 17.0%(+39.8)#18 | 11.4%(+45.4)#251 |
| 19. | Bogus Hill | 56.1% | 17.0%(+39.1)#19 | 11.4%(+44.7)#272 |
| 20. | Murray | 56.0% | 17.0%(+39.0)#20 | 11.4%(+44.6)#273 |
| 21. | Lakes East | 55.0% | 17.0%(+38.0)#21 | 11.4%(+43.6)#294 |
| 22. | Ridgebury | 54.9% | 17.0%(+37.9)#22 | 11.4%(+43.5)#299 |
| 23. | Noroton Heights | 54.8% | 17.0%(+37.8)#23 | 11.4%(+43.4)#302 |
| 24. | Rock Ridge | 54.0% | 17.0%(+37.0)#24 | 11.4%(+42.6)#334 |
| 25. | Westport | 53.9% | 17.0%(+36.9)#25 | 11.4%(+42.5)#336 |
| 26. | Cannondale | 52.7% | 17.0%(+35.7)#26 | 11.4%(+41.3)#372 |
| 27. | Staples | 51.7% | 17.0%(+34.7)#27 | 11.4%(+40.3)#396 |
| 28. | Lakes West | 51.7% | 17.0%(+34.7)#28 | 11.4%(+40.3)#398 |
| 29. | Compo | 51.5% | 17.0%(+34.5)#29 | 11.4%(+40.1)#407 |
| 30. | Botsford | 50.8% | 17.0%(+33.8)#30 | 11.4%(+39.4)#427 |
| 31. | Saugatuck | 49.6% | 17.0%(+32.6)#31 | 11.4%(+38.2)#466 |
| 32. | Glenville | 48.2% | 17.0%(+31.2)#32 | 11.4%(+36.8)#502 |
| 33. | Lakeside Woods | 47.3% | 17.0%(+30.3)#33 | 11.4%(+35.9)#525 |
| 34. | Cos Cob | 46.8% | 17.0%(+29.8)#34 | 11.4%(+35.4)#543 |
| 35. | Daniels Farm | 46.7% | 17.0%(+29.7)#35 | 11.4%(+35.3)#554 |
| 36. | New Canaan | 44.0% | 17.0%(+27.0)#36 | 11.4%(+32.6)#656 |
| 37. | Tashua | 43.4% | 17.0%(+26.4)#37 | 11.4%(+32.0)#679 |
| 38. | Darien Downtown | 43.1% | 17.0%(+26.1)#38 | 11.4%(+31.7)#691 |
| 39. | Fenwick Borough | 41.7% | 17.0%(+24.7)#39 | 11.4%(+30.3)#749 |
| 40. | Southport | 41.4% | 17.0%(+24.4)#40 | 11.4%(+30.0)#767 |
| 41. | South Wilton | 40.7% | 17.0%(+23.7)#41 | 11.4%(+29.3)#790 |
| 42. | Knollcrest | 39.6% | 17.0%(+22.6)#42 | 11.4%(+28.2)#864 |
| 43. | Mill Plain | 39.4% | 17.0%(+22.4)#43 | 11.4%(+28.0)#874 |
| 44. | West Simsbury | 39.0% | 17.0%(+22.0)#44 | 11.4%(+27.6)#902 |
| 45. | Georgetown | 37.6% | 17.0%(+20.6)#45 | 11.4%(+26.2)#982 |
| 46. | East | 37.3% | 17.0%(+20.3)#46 | 11.4%(+25.9)#992 |
| 47. | Ridgefield | 36.2% | 17.0%(+19.2)#47 | 11.4%(+24.8)#1,066 |
| 48. | Sandy Hook | 35.6% | 17.0%(+18.6)#48 | 11.4%(+24.2)#1,118 |
| 49. | Greenwich | 35.5% | 17.0%(+18.5)#49 | 11.4%(+24.1)#1,124 |
| 50. | Plattsville | 35.4% | 17.0%(+18.4)#50 | 11.4%(+24.0)#1,141 |
| 51. | Essex Village | 34.5% | 17.0%(+17.5)#51 | 11.4%(+23.1)#1,211 |
| 52. | Noank | 34.2% | 17.0%(+17.2)#52 | 11.4%(+22.8)#1,230 |
| 53. | Wilton Center | 33.3% | 17.0%(+16.3)#53 | 11.4%(+21.9)#1,308 |
| 54. | Suffield Depot | 32.8% | 17.0%(+15.8)#54 | 11.4%(+21.4)#1,355 |
| 55. | Madison Center | 32.8% | 17.0%(+15.8)#55 | 11.4%(+21.4)#1,356 |
| 56. | Groton Long Point Borough | 32.4% | 17.0%(+15.4)#56 | 11.4%(+21.0)#1,388 |
| 57. | Cornwall | 32.4% | 17.0%(+15.4)#57 | 11.4%(+21.0)#1,391 |
| 58. | Newtown Borough | 32.0% | 17.0%(+15.0)#58 | 11.4%(+20.6)#1,429 |
| 59. | Stonington Borough | 29.8% | 17.0%(+12.8)#59 | 11.4%(+18.4)#1,643 |
| 60. | Quasset Lake | 29.8% | 17.0%(+12.8)#60 | 11.4%(+18.4)#1,646 |
| 61. | Weatogue | 29.5% | 17.0%(+12.5)#61 | 11.4%(+18.1)#1,667 |
| 62. | Pemberwick | 29.1% | 17.0%(+12.1)#62 | 11.4%(+17.7)#1,700 |
| 63. | Orange | 29.0% | 17.0%(+12.0)#63 | 11.4%(+17.6)#1,706 |
| 64. | Redding Center | 28.4% | 17.0%(+11.4)#64 | 11.4%(+17.0)#1,790 |
| 65. | West Hartford | 27.3% | 17.0%(+10.3)#65 | 11.4%(+15.9)#1,885 |
| 66. | Bridgewater | 27.3% | 17.0%(+10.3)#66 | 11.4%(+15.9)#1,907 |
| 67. | Stepney | 26.9% | 17.0%(+9.90)#67 | 11.4%(+15.5)#1,945 |
| 68. | Collinsville | 26.8% | 17.0%(+9.80)#68 | 11.4%(+15.4)#1,958 |
| 69. | Lakeville | 26.5% | 17.0%(+9.50)#69 | 11.4%(+15.1)#1,997 |
| 70. | North Granby | 26.1% | 17.0%(+9.10)#70 | 11.4%(+14.7)#2,049 |
| 71. | Simsbury Center | 25.3% | 17.0%(+8.30)#71 | 11.4%(+13.9)#2,133 |
| 72. | Terramuggus | 24.8% | 17.0%(+7.80)#72 | 11.4%(+13.4)#2,190 |
| 73. | Candlewood Orchards | 24.8% | 17.0%(+7.80)#73 | 11.4%(+13.4)#2,192 |
| 74. | Northford | 24.5% | 17.0%(+7.50)#74 | 11.4%(+13.1)#2,228 |
| 75. | Ball Pond | 24.4% | 17.0%(+7.40)#75 | 11.4%(+13.0)#2,249 |
| 76. | Cheshire Village | 24.3% | 17.0%(+7.30)#76 | 11.4%(+12.9)#2,259 |
| 77. | Guilford Center | 24.3% | 17.0%(+7.30)#77 | 11.4%(+12.9)#2,265 |
| 78. | Woodmont Borough | 24.0% | 17.0%(+7.00)#78 | 11.4%(+12.6)#2,312 |
| 79. | Candlewood Shores | 24.0% | 17.0%(+7.00)#79 | 11.4%(+12.6)#2,316 |
| 80. | Trumbull Center | 23.4% | 17.0%(+6.40)#80 | 11.4%(+12.0)#2,411 |
| 81. | Glastonbury Center | 23.3% | 17.0%(+6.30)#81 | 11.4%(+11.9)#2,424 |
| 82. | Mystic | 23.1% | 17.0%(+6.10)#82 | 11.4%(+11.7)#2,466 |
| 83. | Stamford | 21.5% | 17.0%(+4.50)#83 | 11.4%(+10.1)#2,744 |
| 84. | Mashantucket | 21.4% | 17.0%(+4.40)#84 | 11.4%(+10.00)#2,779 |
| 85. | Shelton | 21.3% | 17.0%(+4.30)#85 | 11.4%(+9.90)#2,783 |
| 86. | Gaylordsville | 21.0% | 17.0%(+4.00)#86 | 11.4%(+9.60)#2,852 |
| 87. | Higganum | 20.9% | 17.0%(+3.90)#87 | 11.4%(+9.50)#2,869 |
| 88. | North Haven | 20.7% | 17.0%(+3.70)#88 | 11.4%(+9.30)#2,896 |
| 89. | Lordship | 20.7% | 17.0%(+3.70)#89 | 11.4%(+9.30)#2,901 |
| 90. | Norwalk | 20.2% | 17.0%(+3.20)#90 | 11.4%(+8.80)#2,995 |
| 91. | Milford City Balance | 19.8% | 17.0%(+2.80)#91 | 11.4%(+8.40)#3,089 |
| 92. | Topstone | 19.3% | 17.0%(+2.30)#92 | 11.4%(+7.90)#3,204 |
| 93. | Crystal Lake | 19.2% | 17.0%(+2.20)#93 | 11.4%(+7.80)#3,222 |
| 94. | West Cornwall | 19.2% | 17.0%(+2.20)#94 | 11.4%(+7.80)#3,234 |
| 95. | Byram | 19.1% | 17.0%(+2.10)#95 | 11.4%(+7.70)#3,244 |
| 96. | Litchfield Borough | 18.8% | 17.0%(+1.80)#96 | 11.4%(+7.40)#3,327 |
| 97. | Bethlehem Village | 18.3% | 17.0%(+1.30)#97 | 11.4%(+6.90)#3,433 |
| 98. | Durham | 17.9% | 17.0%(+0.900)#98 | 11.4%(+6.50)#3,520 |
| 99. | Brooklyn | 17.9% | 17.0%(+0.900)#99 | 11.4%(+6.50)#3,529 |
| 100. | Sharon | 17.8% | 17.0%(+0.800)#100 | 11.4%(+6.40)#3,564 |
Common Questions
What are the Top 10 Cities with the Highest Percentage of Households with Income Above $200,000 in Connecticut?
Top 10 Cities with the Highest Percentage of Households with Income Above $200,000 in Connecticut are:
#1
64.6%
#2
57.6%
#3
52.7%
#4
48.2%
#5
46.8%
#6
41.4%
#7
39.0%
#8
37.6%
#9
36.2%
#10
35.5%
What city has the Highest Percentage of Households with Income Above $200,000 in Connecticut?
Riverside has the Highest Percentage of Households with Income Above $200,000 in Connecticut with 64.6%.
What is the Percentage of Households with Income Above $200,000 in the State of Connecticut?
Percentage of Households with Income Above $200,000 in Connecticut is 17.0%.
What is the Percentage of Households with Income Above $200,000 in the United States?
Percentage of Households with Income Above $200,000 in the United States is 11.4%.