Zip Codes with the Highest Percentage of Households with Income Above $200,000 in Los Angeles, CA
RELATED REPORTS & OPTIONS
Household Income | $200k+
Los Angeles
Compare Zip Codes
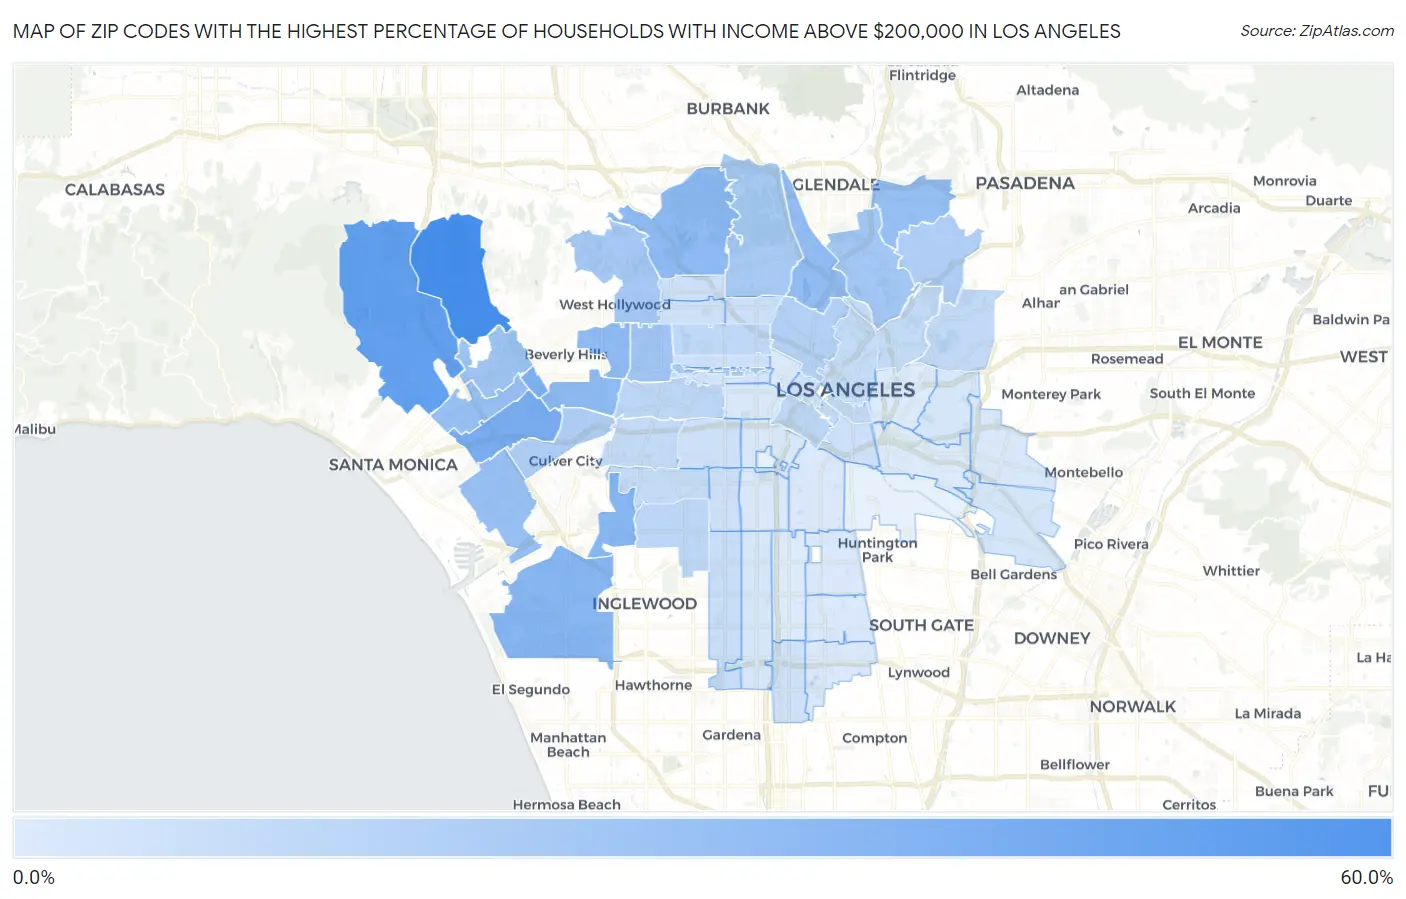
Map of Zip Codes with the Highest Percentage of Households with Income Above $200,000 in Los Angeles
2.3%
51.1%
Zip Codes with the Highest Percentage of Households with Income Above $200,000 in Los Angeles, CA
| Zip Code | Households with Income > $200k | vs State | vs National | |
| 1. | 90077 | 51.1% | 17.9%(+33.2)#45 | 11.4%(+39.7)#249 |
| 2. | 90049 | 40.5% | 17.9%(+22.6)#130 | 11.4%(+29.1)#628 |
| 3. | 90064 | 32.6% | 17.9%(+14.7)#207 | 11.4%(+21.2)#1,189 |
| 4. | 90067 | 31.0% | 17.9%(+13.1)#236 | 11.4%(+19.6)#1,354 |
| 5. | 90045 | 27.7% | 17.9%(+9.80)#305 | 11.4%(+16.3)#1,770 |
| 6. | 90056 | 27.4% | 17.9%(+9.50)#316 | 11.4%(+16.0)#1,816 |
| 7. | 90035 | 25.6% | 17.9%(+7.70)#352 | 11.4%(+14.2)#2,081 |
| 8. | 90068 | 25.3% | 17.9%(+7.40)#360 | 11.4%(+13.9)#2,129 |
| 9. | 90048 | 25.2% | 17.9%(+7.30)#364 | 11.4%(+13.8)#2,149 |
| 10. | 90039 | 25.0% | 17.9%(+7.10)#368 | 11.4%(+13.6)#2,186 |
| 11. | 90041 | 22.9% | 17.9%(+5.00)#426 | 11.4%(+11.5)#2,572 |
| 12. | 90066 | 22.6% | 17.9%(+4.70)#434 | 11.4%(+11.2)#2,647 |
| 13. | 90025 | 22.5% | 17.9%(+4.60)#439 | 11.4%(+11.1)#2,676 |
| 14. | 90024 | 20.4% | 17.9%(+2.50)#509 | 11.4%(+9.00)#3,171 |
| 15. | 90036 | 19.9% | 17.9%(+2.00)#519 | 11.4%(+8.50)#3,308 |
| 16. | 90065 | 18.8% | 17.9%(+0.900)#563 | 11.4%(+7.40)#3,607 |
| 17. | 90046 | 17.9% | 17.9%(=0.000)#598 | 11.4%(+6.50)#3,869 |
| 18. | 90027 | 17.2% | 17.9%(-0.700)#624 | 11.4%(+5.80)#4,095 |
| 19. | 90010 | 17.2% | 17.9%(-0.700)#628 | 11.4%(+5.80)#4,125 |
| 20. | 90042 | 15.4% | 17.9%(-2.50)#699 | 11.4%(+4.00)#4,800 |
| 21. | 90034 | 15.3% | 17.9%(-2.60)#704 | 11.4%(+3.90)#4,837 |
| 22. | 90026 | 14.1% | 17.9%(-3.80)#750 | 11.4%(+2.70)#5,398 |
| 23. | 90043 | 11.5% | 17.9%(-6.40)#870 | 11.4%(+0.100)#7,010 |
| 24. | 90015 | 11.5% | 17.9%(-6.40)#872 | 11.4%(+0.100)#7,023 |
| 25. | 90019 | 11.2% | 17.9%(-6.70)#887 | 11.4%(-0.200)#7,217 |
| 26. | 90004 | 10.5% | 17.9%(-7.40)#926 | 11.4%(-0.900)#7,772 |
| 27. | 90014 | 10.2% | 17.9%(-7.70)#946 | 11.4%(-1.20)#8,073 |
| 28. | 90032 | 9.8% | 17.9%(-8.10)#973 | 11.4%(-1.60)#8,434 |
| 29. | 90013 | 9.8% | 17.9%(-8.10)#976 | 11.4%(-1.60)#8,462 |
| 30. | 90016 | 9.6% | 17.9%(-8.30)#982 | 11.4%(-1.80)#8,622 |
| 31. | 90031 | 9.2% | 17.9%(-8.70)#1,009 | 11.4%(-2.20)#9,033 |
| 32. | 90012 | 8.8% | 17.9%(-9.10)#1,030 | 11.4%(-2.60)#9,413 |
| 33. | 90008 | 8.4% | 17.9%(-9.50)#1,055 | 11.4%(-3.00)#9,863 |
| 34. | 90047 | 8.0% | 17.9%(-9.90)#1,074 | 11.4%(-3.40)#10,347 |
| 35. | 90021 | 7.0% | 17.9%(-10.9)#1,150 | 11.4%(-4.40)#11,829 |
| 36. | 90028 | 6.8% | 17.9%(-11.1)#1,164 | 11.4%(-4.60)#12,068 |
| 37. | 90029 | 6.5% | 17.9%(-11.4)#1,188 | 11.4%(-4.90)#12,563 |
| 38. | 90018 | 6.3% | 17.9%(-11.6)#1,199 | 11.4%(-5.10)#12,890 |
| 39. | 90020 | 6.2% | 17.9%(-11.7)#1,207 | 11.4%(-5.20)#13,073 |
| 40. | 90062 | 6.2% | 17.9%(-11.7)#1,208 | 11.4%(-5.20)#13,078 |
| 41. | 90061 | 6.2% | 17.9%(-11.7)#1,209 | 11.4%(-5.20)#13,087 |
| 42. | 90038 | 6.1% | 17.9%(-11.8)#1,220 | 11.4%(-5.30)#13,258 |
| 43. | 90017 | 5.8% | 17.9%(-12.1)#1,245 | 11.4%(-5.60)#13,847 |
| 44. | 90005 | 5.6% | 17.9%(-12.3)#1,265 | 11.4%(-5.80)#14,265 |
| 45. | 90040 | 4.6% | 17.9%(-13.3)#1,344 | 11.4%(-6.80)#16,567 |
| 46. | 90063 | 4.2% | 17.9%(-13.7)#1,368 | 11.4%(-7.20)#17,529 |
| 47. | 90044 | 3.9% | 17.9%(-14.0)#1,387 | 11.4%(-7.50)#18,320 |
| 48. | 90037 | 3.7% | 17.9%(-14.2)#1,398 | 11.4%(-7.70)#18,850 |
| 49. | 90022 | 3.6% | 17.9%(-14.3)#1,404 | 11.4%(-7.80)#19,136 |
| 50. | 90006 | 3.6% | 17.9%(-14.3)#1,405 | 11.4%(-7.80)#19,137 |
| 51. | 90007 | 3.4% | 17.9%(-14.5)#1,414 | 11.4%(-8.00)#19,682 |
| 52. | 90011 | 3.2% | 17.9%(-14.7)#1,429 | 11.4%(-8.20)#20,262 |
| 53. | 90002 | 3.2% | 17.9%(-14.7)#1,432 | 11.4%(-8.20)#20,272 |
| 54. | 90059 | 2.9% | 17.9%(-15.0)#1,456 | 11.4%(-8.50)#21,147 |
| 55. | 90001 | 2.8% | 17.9%(-15.1)#1,459 | 11.4%(-8.60)#21,415 |
| 56. | 90003 | 2.6% | 17.9%(-15.3)#1,470 | 11.4%(-8.80)#21,989 |
| 57. | 90033 | 2.6% | 17.9%(-15.3)#1,471 | 11.4%(-8.80)#21,993 |
| 58. | 90057 | 2.5% | 17.9%(-15.4)#1,478 | 11.4%(-8.90)#22,311 |
| 59. | 90023 | 2.3% | 17.9%(-15.6)#1,486 | 11.4%(-9.10)#22,888 |
1
Common Questions
What are the Top 10 Zip Codes with the Highest Percentage of Households with Income Above $200,000 in Los Angeles, CA?
Top 10 Zip Codes with the Highest Percentage of Households with Income Above $200,000 in Los Angeles, CA are:
What zip code has the Highest Percentage of Households with Income Above $200,000 in Los Angeles, CA?
90077 has the Highest Percentage of Households with Income Above $200,000 in Los Angeles, CA with 51.1%.
What is the Percentage of Households with Income Above $200,000 in Los Angeles, CA?
Percentage of Households with Income Above $200,000 in Los Angeles is 14.3%.
What is the Percentage of Households with Income Above $200,000 in California?
Percentage of Households with Income Above $200,000 in California is 17.9%.
What is the Percentage of Households with Income Above $200,000 in the United States?
Percentage of Households with Income Above $200,000 in the United States is 11.4%.