Cities with the Highest Percentage of Households with Income Above $200,000 in Texas
RELATED REPORTS & OPTIONS
Household Income | $200k+
Texas
Compare Cities
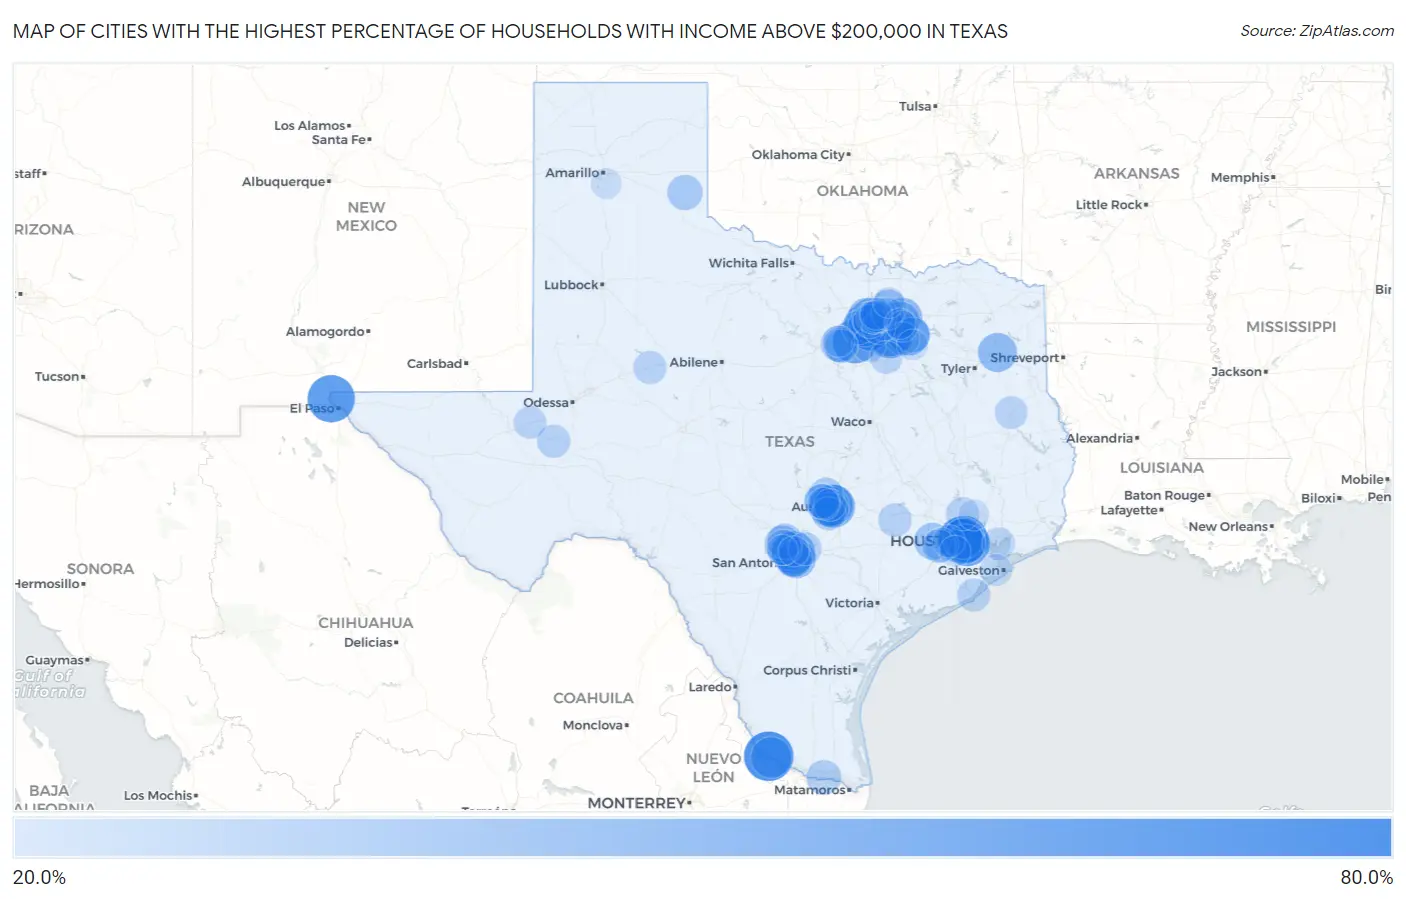
Map of Cities with the Highest Percentage of Households with Income Above $200,000 in Texas
0.0%
80.0%
Cities with the Highest Percentage of Households with Income Above $200,000 in Texas
| City | Households with Income > $200k | vs State | vs National | |
| 1. | Rancho Viejo | 77.4% | 10.6%(+66.8)#1 | 11.4%(+66.0)#38 |
| 2. | Hunters Creek Village | 75.0% | 10.6%(+64.4)#2 | 11.4%(+63.6)#48 |
| 3. | Prado Verde | 71.4% | 10.6%(+60.8)#3 | 11.4%(+60.0)#66 |
| 4. | Bunker Hill Village | 69.5% | 10.6%(+58.9)#4 | 11.4%(+58.1)#79 |
| 5. | Piney Point Village | 68.8% | 10.6%(+58.2)#5 | 11.4%(+57.4)#88 |
| 6. | West University Place | 65.1% | 10.6%(+54.5)#6 | 11.4%(+53.7)#112 |
| 7. | Southlake | 64.3% | 10.6%(+53.7)#7 | 11.4%(+52.9)#122 |
| 8. | Westover Hills | 63.7% | 10.6%(+53.1)#8 | 11.4%(+52.3)#127 |
| 9. | Westlake | 63.4% | 10.6%(+52.8)#9 | 11.4%(+52.0)#133 |
| 10. | Highland Park | 62.0% | 10.6%(+51.4)#10 | 11.4%(+50.6)#148 |
| 11. | Dennis | 60.3% | 10.6%(+49.7)#11 | 11.4%(+48.9)#179 |
| 12. | Hill Country Village | 59.0% | 10.6%(+48.4)#12 | 11.4%(+47.6)#210 |
| 13. | University Park | 58.9% | 10.6%(+48.3)#13 | 11.4%(+47.5)#211 |
| 14. | Rollingwood | 58.8% | 10.6%(+48.2)#14 | 11.4%(+47.4)#213 |
| 15. | Hilshire Village | 57.7% | 10.6%(+47.1)#15 | 11.4%(+46.3)#235 |
| 16. | Spring Valley Village | 55.1% | 10.6%(+44.5)#16 | 11.4%(+43.7)#289 |
| 17. | West Lake Hills | 54.9% | 10.6%(+44.3)#17 | 11.4%(+43.5)#298 |
| 18. | Heath | 54.8% | 10.6%(+44.2)#18 | 11.4%(+43.4)#300 |
| 19. | Mi Ranchito Estate | 54.5% | 10.6%(+43.9)#19 | 11.4%(+43.1)#313 |
| 20. | Bellaire | 53.5% | 10.6%(+42.9)#20 | 11.4%(+42.1)#347 |
| 21. | Barton Creek | 53.1% | 10.6%(+42.5)#21 | 11.4%(+41.7)#358 |
| 22. | Hedwig Village | 51.9% | 10.6%(+41.3)#22 | 11.4%(+40.5)#392 |
| 23. | Belterra | 51.1% | 10.6%(+40.5)#23 | 11.4%(+39.7)#418 |
| 24. | Argyle | 50.7% | 10.6%(+40.1)#24 | 11.4%(+39.3)#430 |
| 25. | Lucas | 50.5% | 10.6%(+39.9)#25 | 11.4%(+39.1)#431 |
| 26. | Lantana | 50.4% | 10.6%(+39.8)#26 | 11.4%(+39.0)#432 |
| 27. | Parker | 50.1% | 10.6%(+39.5)#27 | 11.4%(+38.7)#440 |
| 28. | Union Grove | 49.8% | 10.6%(+39.2)#28 | 11.4%(+38.4)#461 |
| 29. | Terrell Hills | 49.7% | 10.6%(+39.1)#29 | 11.4%(+38.3)#464 |
| 30. | Colleyville | 49.3% | 10.6%(+38.7)#30 | 11.4%(+37.9)#473 |
| 31. | Southside Place | 48.2% | 10.6%(+37.6)#31 | 11.4%(+36.8)#504 |
| 32. | Shavano Park | 46.8% | 10.6%(+36.2)#32 | 11.4%(+35.4)#546 |
| 33. | Olmos Park | 45.3% | 10.6%(+34.7)#33 | 11.4%(+33.9)#600 |
| 34. | Trophy Club | 44.6% | 10.6%(+34.0)#34 | 11.4%(+33.2)#631 |
| 35. | Steiner Ranch | 44.1% | 10.6%(+33.5)#35 | 11.4%(+32.7)#649 |
| 36. | Brazos Country | 44.0% | 10.6%(+33.4)#36 | 11.4%(+32.6)#658 |
| 37. | Seis Lagos | 43.2% | 10.6%(+32.6)#37 | 11.4%(+31.8)#686 |
| 38. | Hebron | 42.9% | 10.6%(+32.3)#38 | 11.4%(+31.5)#699 |
| 39. | Annetta North | 42.2% | 10.6%(+31.6)#39 | 11.4%(+30.8)#727 |
| 40. | Double Oak | 41.8% | 10.6%(+31.2)#40 | 11.4%(+30.4)#744 |
| 41. | Scenic Oaks | 41.5% | 10.6%(+30.9)#41 | 11.4%(+30.1)#759 |
| 42. | Prosper | 41.2% | 10.6%(+30.6)#42 | 11.4%(+29.8)#771 |
| 43. | Alamo Heights | 40.2% | 10.6%(+29.6)#43 | 11.4%(+28.8)#816 |
| 44. | Fair Oaks Ranch | 40.1% | 10.6%(+29.5)#44 | 11.4%(+28.7)#823 |
| 45. | Cross Mountain | 40.1% | 10.6%(+29.5)#45 | 11.4%(+28.7)#824 |
| 46. | Ben Arnold | 40.0% | 10.6%(+29.4)#46 | 11.4%(+28.6)#834 |
| 47. | Quail | 40.0% | 10.6%(+29.4)#47 | 11.4%(+28.6)#835 |
| 48. | Keller | 39.9% | 10.6%(+29.3)#48 | 11.4%(+28.5)#839 |
| 49. | Mclendon Chisholm | 39.6% | 10.6%(+29.0)#49 | 11.4%(+28.2)#861 |
| 50. | Progreso Lakes | 38.8% | 10.6%(+28.2)#50 | 11.4%(+27.4)#911 |
| 51. | Volente | 38.4% | 10.6%(+27.8)#51 | 11.4%(+27.0)#938 |
| 52. | Sunset Valley | 38.3% | 10.6%(+27.7)#52 | 11.4%(+26.9)#940 |
| 53. | The Hills | 38.2% | 10.6%(+27.6)#53 | 11.4%(+26.8)#950 |
| 54. | Annetta | 37.9% | 10.6%(+27.3)#54 | 11.4%(+26.5)#965 |
| 55. | Sienna | 37.8% | 10.6%(+27.2)#55 | 11.4%(+26.4)#973 |
| 56. | Lakeway | 37.8% | 10.6%(+27.2)#56 | 11.4%(+26.4)#974 |
| 57. | Lakewood Village | 37.3% | 10.6%(+26.7)#57 | 11.4%(+25.9)#998 |
| 58. | Fulshear | 36.9% | 10.6%(+26.3)#58 | 11.4%(+25.5)#1,025 |
| 59. | Haslet | 36.2% | 10.6%(+25.6)#59 | 11.4%(+24.8)#1,068 |
| 60. | Dalworthington Gardens | 35.8% | 10.6%(+25.2)#60 | 11.4%(+24.4)#1,098 |
| 61. | Weston Lakes | 35.5% | 10.6%(+24.9)#61 | 11.4%(+24.1)#1,129 |
| 62. | Round Top | 35.4% | 10.6%(+24.8)#62 | 11.4%(+24.0)#1,143 |
| 63. | Bartonville | 35.1% | 10.6%(+24.5)#63 | 11.4%(+23.7)#1,166 |
| 64. | Annetta South | 35.1% | 10.6%(+24.5)#64 | 11.4%(+23.7)#1,168 |
| 65. | Imperial | 35.1% | 10.6%(+24.5)#65 | 11.4%(+23.7)#1,170 |
| 66. | Shady Hollow | 34.9% | 10.6%(+24.3)#66 | 11.4%(+23.5)#1,187 |
| 67. | Flower Mound | 34.8% | 10.6%(+24.2)#67 | 11.4%(+23.4)#1,188 |
| 68. | Sunnyvale | 34.8% | 10.6%(+24.2)#68 | 11.4%(+23.4)#1,190 |
| 69. | Westbrook | 34.8% | 10.6%(+24.2)#69 | 11.4%(+23.4)#1,193 |
| 70. | The Woodlands | 34.6% | 10.6%(+24.0)#70 | 11.4%(+23.2)#1,199 |
| 71. | Quintana | 34.5% | 10.6%(+23.9)#71 | 11.4%(+23.1)#1,217 |
| 72. | Garden Ridge | 34.1% | 10.6%(+23.5)#72 | 11.4%(+22.7)#1,233 |
| 73. | Coppell | 33.9% | 10.6%(+23.3)#73 | 11.4%(+22.5)#1,250 |
| 74. | Redfield | 33.9% | 10.6%(+23.3)#74 | 11.4%(+22.5)#1,264 |
| 75. | Oak Leaf | 33.6% | 10.6%(+23.0)#75 | 11.4%(+22.2)#1,280 |
| 76. | Stockton Bend | 33.6% | 10.6%(+23.0)#76 | 11.4%(+22.2)#1,281 |
| 77. | Highland Village | 33.4% | 10.6%(+22.8)#77 | 11.4%(+22.0)#1,293 |
| 78. | Pyote | 33.3% | 10.6%(+22.7)#78 | 11.4%(+21.9)#1,313 |
| 79. | Rice Tracts | 33.1% | 10.6%(+22.5)#79 | 11.4%(+21.7)#1,333 |
| 80. | Beach City | 33.0% | 10.6%(+22.4)#80 | 11.4%(+21.6)#1,339 |
| 81. | Frisco | 32.1% | 10.6%(+21.5)#81 | 11.4%(+20.7)#1,416 |
| 82. | Cinco Ranch | 31.8% | 10.6%(+21.2)#82 | 11.4%(+20.4)#1,446 |
| 83. | Copper Canyon | 31.8% | 10.6%(+21.2)#83 | 11.4%(+20.4)#1,451 |
| 84. | Hickory Creek | 31.5% | 10.6%(+20.9)#84 | 11.4%(+20.1)#1,475 |
| 85. | Shady Shores | 31.4% | 10.6%(+20.8)#85 | 11.4%(+20.0)#1,485 |
| 86. | Lost Creek | 31.2% | 10.6%(+20.6)#86 | 11.4%(+19.8)#1,503 |
| 87. | Bee Cave | 31.1% | 10.6%(+20.5)#87 | 11.4%(+19.7)#1,509 |
| 88. | Tiki Island | 31.1% | 10.6%(+20.5)#88 | 11.4%(+19.7)#1,513 |
| 89. | South Frydek | 29.4% | 10.6%(+18.8)#89 | 11.4%(+18.0)#1,678 |
| 90. | Hudson Oaks | 29.3% | 10.6%(+18.7)#90 | 11.4%(+17.9)#1,681 |
| 91. | Lake Tanglewood | 28.9% | 10.6%(+18.3)#91 | 11.4%(+17.5)#1,727 |
| 92. | Sachse | 28.8% | 10.6%(+18.2)#92 | 11.4%(+17.4)#1,730 |
| 93. | Porter Heights | 28.8% | 10.6%(+18.2)#93 | 11.4%(+17.4)#1,738 |
| 94. | Celina | 28.5% | 10.6%(+17.9)#94 | 11.4%(+17.1)#1,767 |
| 95. | Talty | 28.5% | 10.6%(+17.9)#95 | 11.4%(+17.1)#1,774 |
| 96. | Sugar Land | 28.4% | 10.6%(+17.8)#96 | 11.4%(+17.0)#1,779 |
| 97. | Murphy | 27.7% | 10.6%(+17.1)#97 | 11.4%(+16.3)#1,851 |
| 98. | Grey Forest | 27.3% | 10.6%(+16.7)#98 | 11.4%(+15.9)#1,901 |
| 99. | Hollywood Park | 26.9% | 10.6%(+16.3)#99 | 11.4%(+15.5)#1,948 |
| 100. | Dime Box | 26.9% | 10.6%(+16.3)#100 | 11.4%(+15.5)#1,953 |
Common Questions
What are the Top 10 Cities with the Highest Percentage of Households with Income Above $200,000 in Texas?
Top 10 Cities with the Highest Percentage of Households with Income Above $200,000 in Texas are:
#1
77.4%
#2
75.0%
#3
71.4%
#4
69.5%
#5
68.8%
#6
65.1%
#7
64.3%
#8
63.7%
#9
63.4%
#10
62.0%
What city has the Highest Percentage of Households with Income Above $200,000 in Texas?
Rancho Viejo has the Highest Percentage of Households with Income Above $200,000 in Texas with 77.4%.
What is the Percentage of Households with Income Above $200,000 in the State of Texas?
Percentage of Households with Income Above $200,000 in Texas is 10.6%.
What is the Percentage of Households with Income Above $200,000 in the United States?
Percentage of Households with Income Above $200,000 in the United States is 11.4%.