Ladera Ranch, CA Map & Demographics
Ladera Ranch Map
Ladera Ranch Overview
$68,940
PER CAPITA INCOME
$203,682
AVG FAMILY INCOME
$188,299
AVG HOUSEHOLD INCOME
44.0%
WAGE / INCOME GAP [ % ]
56.0¢/ $1
WAGE / INCOME GAP [ $ ]
$18,294
FAMILY INCOME DEFICIT
0.41
INEQUALITY / GINI INDEX
24,323
TOTAL POPULATION
11,968
MALE POPULATION
12,355
FEMALE POPULATION
96.87
MALES / 100 FEMALES
103.23
FEMALES / 100 MALES
34.9
MEDIAN AGE
3.6
AVG FAMILY SIZE
3.2
AVG HOUSEHOLD SIZE
12,279
LABOR FORCE [ PEOPLE ]
73.5%
PERCENT IN LABOR FORCE
2.7%
UNEMPLOYMENT RATE
Ladera Ranch Zip Codes
Ladera Ranch Area Codes
Income in Ladera Ranch
Income Overview in Ladera Ranch
Per Capita Income in Ladera Ranch is $68,940, while median incomes of families and households are $203,682 and $188,299 respectively.
| Characteristic | Number | Measure |
| Per Capita Income | 24,323 | $68,940 |
| Median Family Income | 6,323 | $203,682 |
| Mean Family Income | 6,323 | $238,014 |
| Median Household Income | 7,511 | $188,299 |
| Mean Household Income | 7,511 | $219,865 |
| Income Deficit | 6,323 | $18,294 |
| Wage / Income Gap (%) | 24,323 | 44.04% |
| Wage / Income Gap ($) | 24,323 | 55.96¢ per $1 |
| Gini / Inequality Index | 24,323 | 0.41 |
Earnings by Sex in Ladera Ranch
Average Earnings in Ladera Ranch are $92,241, $118,117 for men and $66,098 for women, a difference of 44.0%.
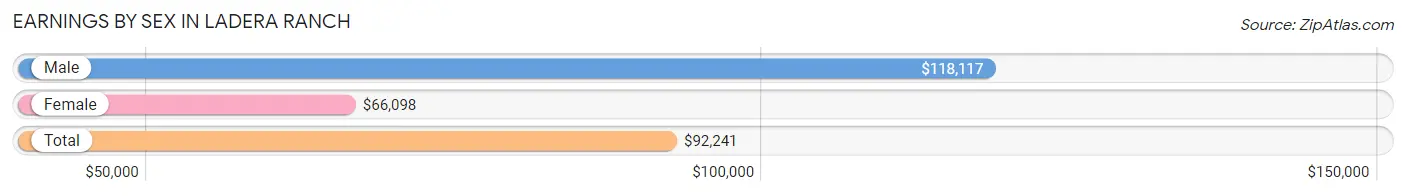
| Sex | Number | Average Earnings |
| Male | 6,906 (54.4%) | $118,117 |
| Female | 5,784 (45.6%) | $66,098 |
| Total | 12,690 (100.0%) | $92,241 |
Earnings by Sex by Income Bracket in Ladera Ranch
The most common earnings brackets in Ladera Ranch are $100,000+ for men (3,926 | 56.9%) and $100,000+ for women (1,879 | 32.5%).
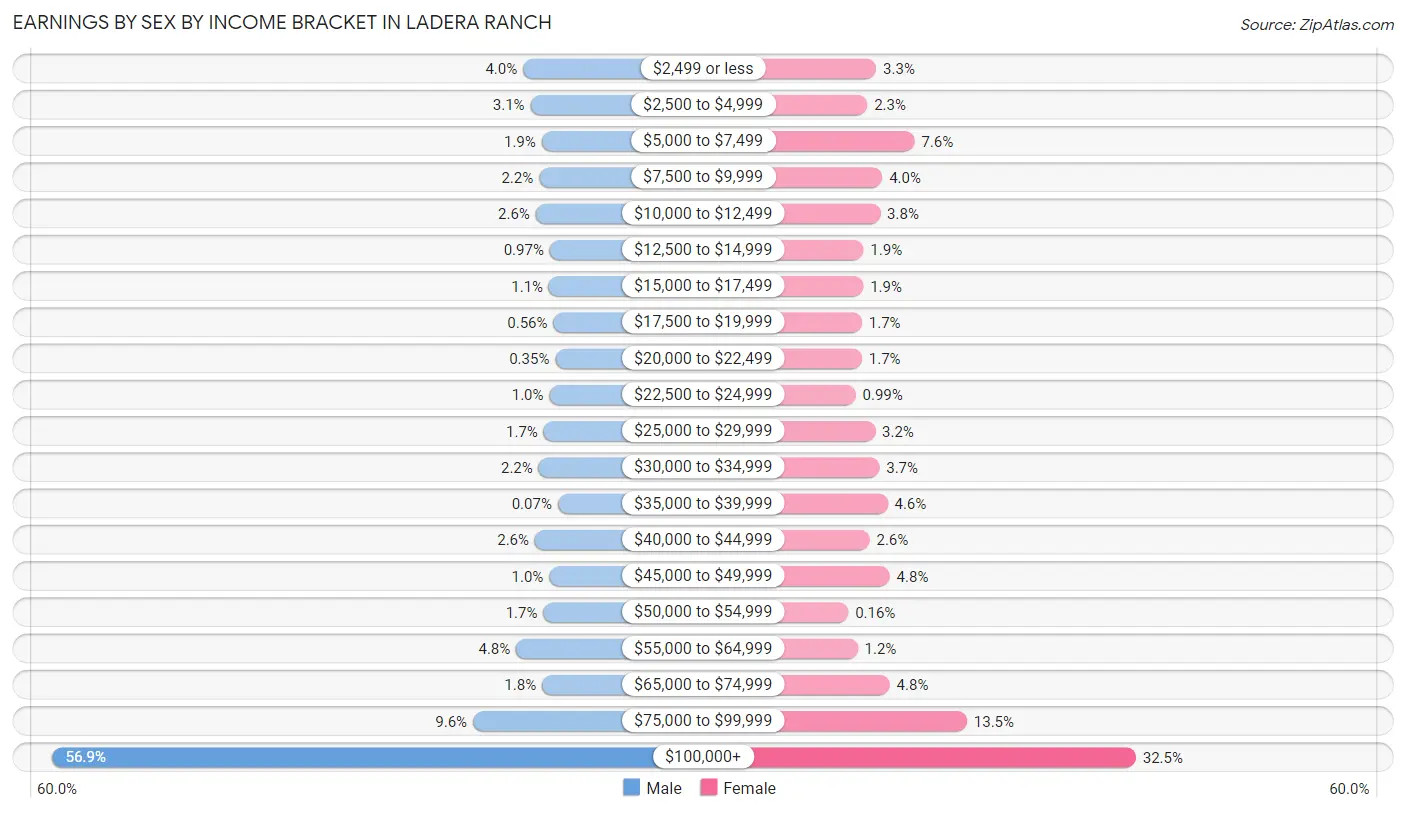
| Income | Male | Female |
| $2,499 or less | 274 (4.0%) | 191 (3.3%) |
| $2,500 to $4,999 | 217 (3.1%) | 133 (2.3%) |
| $5,000 to $7,499 | 130 (1.9%) | 440 (7.6%) |
| $7,500 to $9,999 | 150 (2.2%) | 230 (4.0%) |
| $10,000 to $12,499 | 176 (2.5%) | 217 (3.7%) |
| $12,500 to $14,999 | 67 (1.0%) | 108 (1.9%) |
| $15,000 to $17,499 | 73 (1.1%) | 107 (1.8%) |
| $17,500 to $19,999 | 39 (0.6%) | 98 (1.7%) |
| $20,000 to $22,499 | 24 (0.4%) | 98 (1.7%) |
| $22,500 to $24,999 | 70 (1.0%) | 57 (1.0%) |
| $25,000 to $29,999 | 114 (1.7%) | 184 (3.2%) |
| $30,000 to $34,999 | 153 (2.2%) | 211 (3.6%) |
| $35,000 to $39,999 | 5 (0.1%) | 265 (4.6%) |
| $40,000 to $44,999 | 182 (2.6%) | 148 (2.6%) |
| $45,000 to $49,999 | 71 (1.0%) | 279 (4.8%) |
| $50,000 to $54,999 | 117 (1.7%) | 9 (0.2%) |
| $55,000 to $64,999 | 328 (4.8%) | 70 (1.2%) |
| $65,000 to $74,999 | 127 (1.8%) | 279 (4.8%) |
| $75,000 to $99,999 | 663 (9.6%) | 781 (13.5%) |
| $100,000+ | 3,926 (56.9%) | 1,879 (32.5%) |
| Total | 6,906 (100.0%) | 5,784 (100.0%) |
Earnings by Sex by Educational Attainment in Ladera Ranch
Average earnings in Ladera Ranch are $130,750 for men and $85,841 for women, a difference of 34.4%. Men with an educational attainment of graduate degree enjoy the highest average annual earnings of $166,833, while those with college or associate's degree education earn the least with $58,401. Women with an educational attainment of graduate degree earn the most with the average annual earnings of $110,809, while those with high school diploma education have the smallest earnings of $39,545.
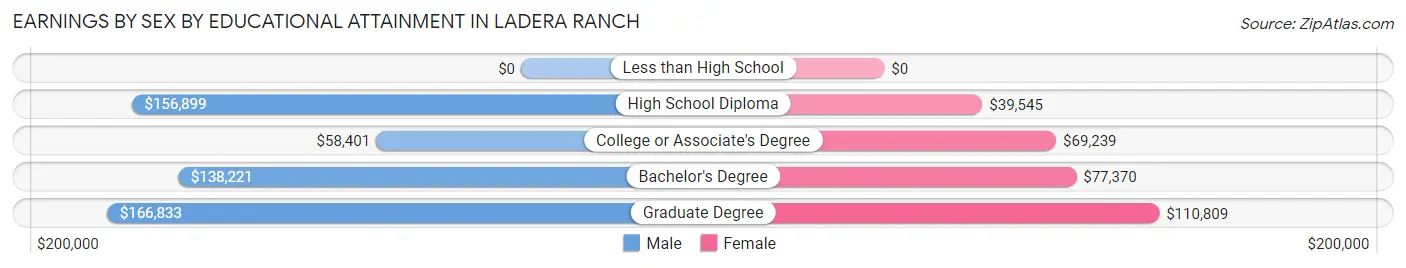
| Educational Attainment | Male Income | Female Income |
| Less than High School | - | - |
| High School Diploma | $156,899 | $39,545 |
| College or Associate's Degree | $58,401 | $69,239 |
| Bachelor's Degree | $138,221 | $77,370 |
| Graduate Degree | $166,833 | $110,809 |
| Total | $130,750 | $85,841 |
Family Income in Ladera Ranch
Family Income Brackets in Ladera Ranch
According to the Ladera Ranch family income data, there are 3,231 families falling into the $200,000+ income range, which is the most common income bracket and makes up 51.1% of all families.
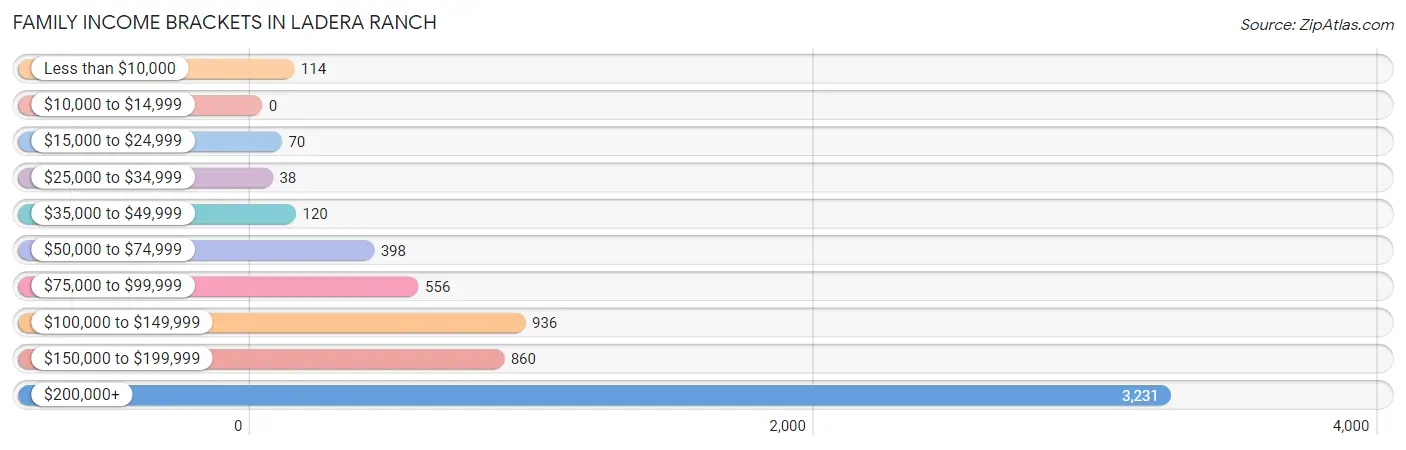
| Income Bracket | # Families | % Families |
| Less than $10,000 | 114 | 1.8% |
| $10,000 to $14,999 | 0 | 0.0% |
| $15,000 to $24,999 | 70 | 1.1% |
| $25,000 to $34,999 | 38 | 0.6% |
| $35,000 to $49,999 | 120 | 1.9% |
| $50,000 to $74,999 | 398 | 6.3% |
| $75,000 to $99,999 | 556 | 8.8% |
| $100,000 to $149,999 | 936 | 14.8% |
| $150,000 to $199,999 | 860 | 13.6% |
| $200,000+ | 3,231 | 51.1% |
Family Income by Famaliy Size in Ladera Ranch
4-person families (1,992 | 31.5%) account for the highest median family income in Ladera Ranch with $223,977 per family, while 3-person families (1,728 | 27.3%) have the highest median income of $72,632 per family member.
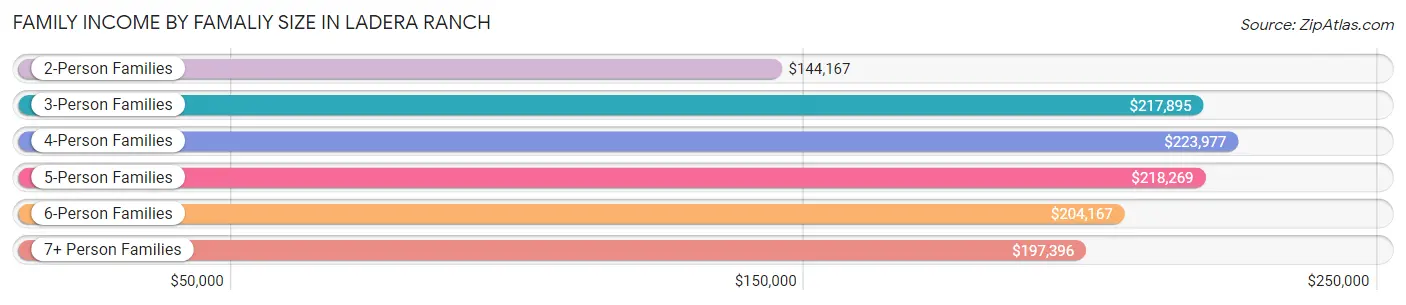
| Income Bracket | # Families | Median Income |
| 2-Person Families | 1,520 (24.0%) | $144,167 |
| 3-Person Families | 1,728 (27.3%) | $217,895 |
| 4-Person Families | 1,992 (31.5%) | $223,977 |
| 5-Person Families | 850 (13.4%) | $218,269 |
| 6-Person Families | 166 (2.6%) | $204,167 |
| 7+ Person Families | 67 (1.1%) | $197,396 |
| Total | 6,323 (100.0%) | $203,682 |
Family Income by Number of Earners in Ladera Ranch
The median family income in Ladera Ranch is $203,682, with families comprising 2 earners (2,743) having the highest median family income of $228,778, while families with no earners (330) have the lowest median family income of $89,886, accounting for 43.4% and 5.2% of families, respectively.
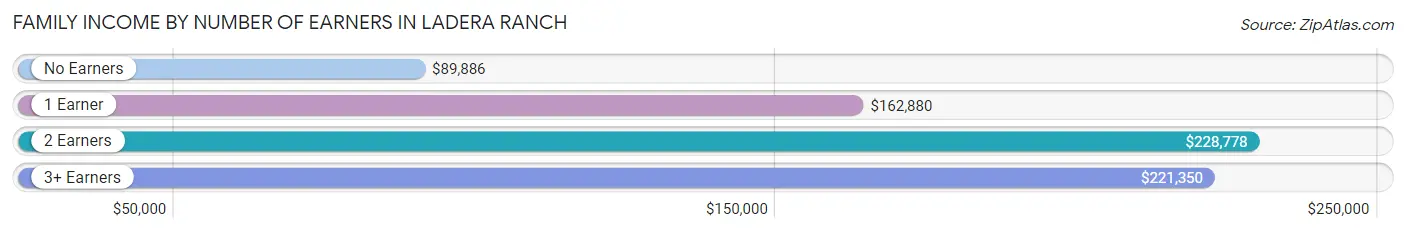
| Number of Earners | # Families | Median Income |
| No Earners | 330 (5.2%) | $89,886 |
| 1 Earner | 2,319 (36.7%) | $162,880 |
| 2 Earners | 2,743 (43.4%) | $228,778 |
| 3+ Earners | 931 (14.7%) | $221,350 |
| Total | 6,323 (100.0%) | $203,682 |
Household Income in Ladera Ranch
Household Income Brackets in Ladera Ranch
With 3,425 households falling in the category, the $200,000+ income range is the most frequent in Ladera Ranch, accounting for 45.6% of all households. In contrast, only 15 households (0.2%) fall into the $10,000 to $14,999 income bracket, making it the least populous group.
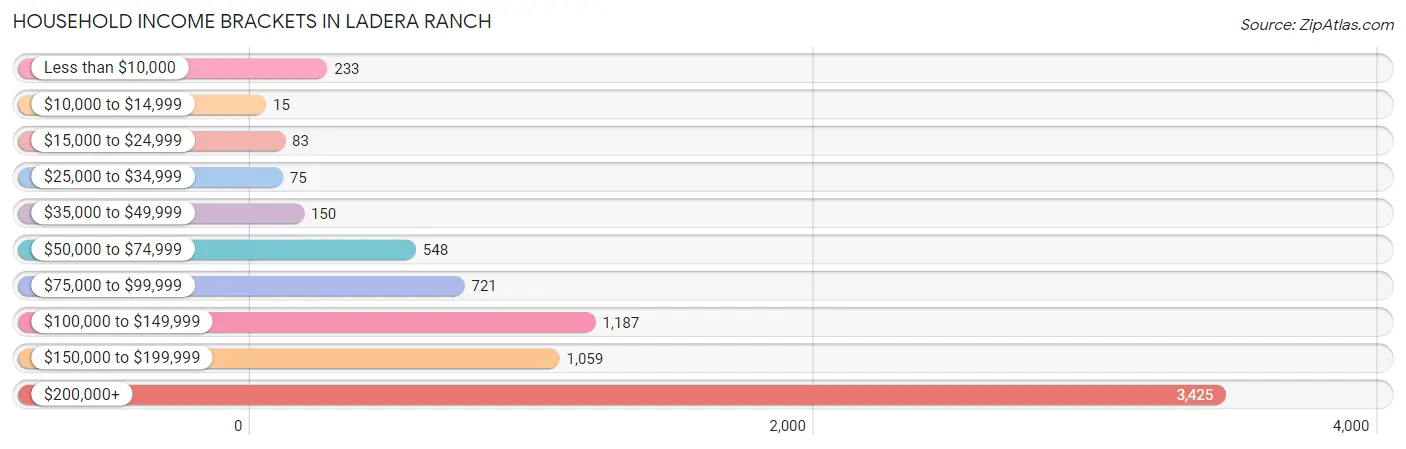
| Income Bracket | # Households | % Households |
| Less than $10,000 | 233 | 3.1% |
| $10,000 to $14,999 | 15 | 0.2% |
| $15,000 to $24,999 | 83 | 1.1% |
| $25,000 to $34,999 | 75 | 1.0% |
| $35,000 to $49,999 | 150 | 2.0% |
| $50,000 to $74,999 | 548 | 7.3% |
| $75,000 to $99,999 | 721 | 9.6% |
| $100,000 to $149,999 | 1,187 | 15.8% |
| $150,000 to $199,999 | 1,059 | 14.1% |
| $200,000+ | 3,425 | 45.6% |
Household Income by Householder Age in Ladera Ranch
The median household income in Ladera Ranch is $188,299, with the highest median household income of $205,560 found in the 25 to 44 years age bracket for the primary householder. A total of 2,523 households (33.6%) fall into this category. Meanwhile, the 15 to 24 years age bracket for the primary householder has the lowest median household income of $0, with 76 households (1.0%) in this group.
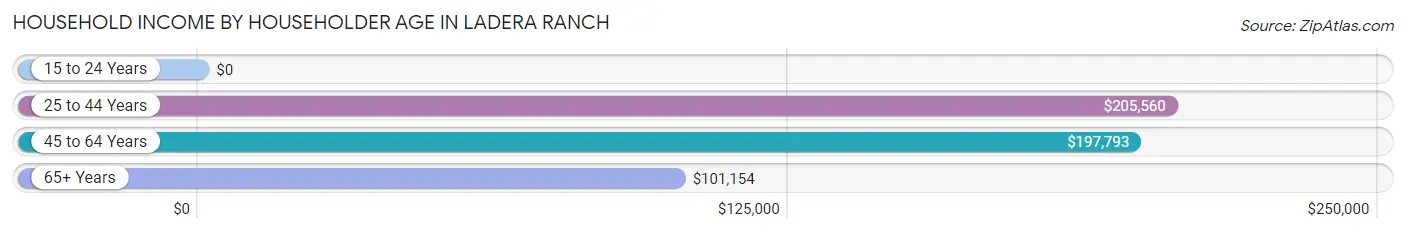
| Income Bracket | # Households | Median Income |
| 15 to 24 Years | 76 (1.0%) | $0 |
| 25 to 44 Years | 2,523 (33.6%) | $205,560 |
| 45 to 64 Years | 4,028 (53.6%) | $197,793 |
| 65+ Years | 884 (11.8%) | $101,154 |
| Total | 7,511 (100.0%) | $188,299 |
Poverty in Ladera Ranch
Income Below Poverty by Sex and Age in Ladera Ranch
With 2.0% poverty level for males and 3.5% for females among the residents of Ladera Ranch, 75 year old and over males and 75 year old and over females are the most vulnerable to poverty, with 37 males (27.2%) and 37 females (13.9%) in their respective age groups living below the poverty level.
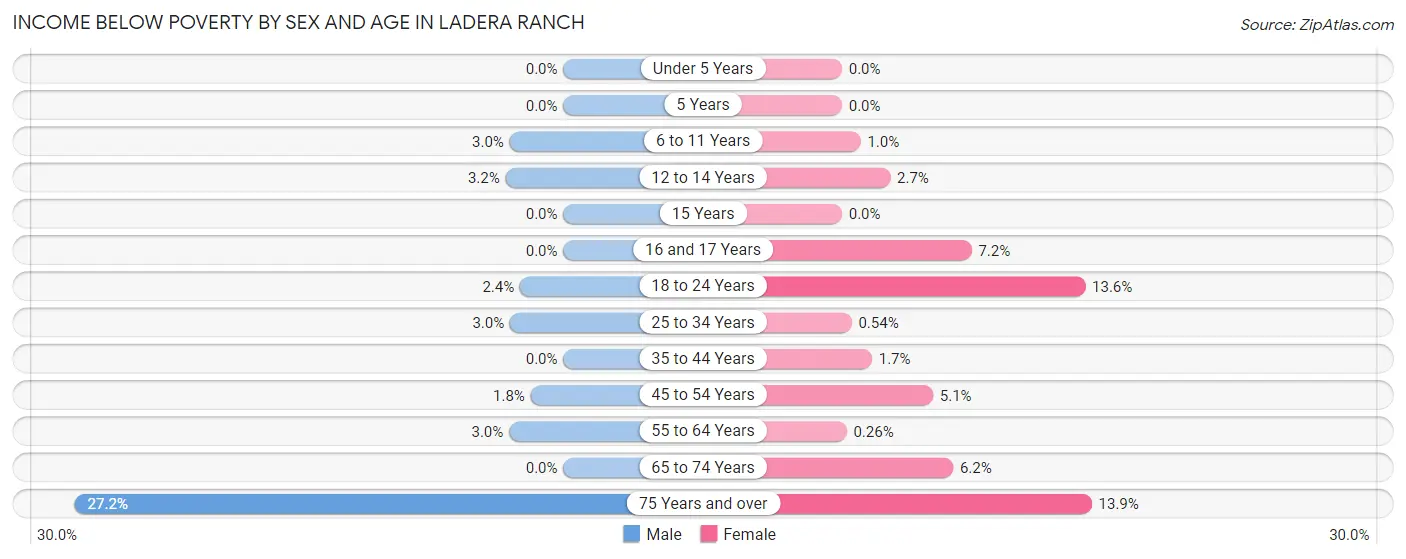
| Age Bracket | Male | Female |
| Under 5 Years | 0 (0.0%) | 0 (0.0%) |
| 5 Years | 0 (0.0%) | 0 (0.0%) |
| 6 to 11 Years | 56 (3.0%) | 17 (1.0%) |
| 12 to 14 Years | 22 (3.2%) | 18 (2.7%) |
| 15 Years | 0 (0.0%) | 0 (0.0%) |
| 16 and 17 Years | 0 (0.0%) | 38 (7.2%) |
| 18 to 24 Years | 16 (2.4%) | 139 (13.6%) |
| 25 to 34 Years | 27 (3.0%) | 5 (0.5%) |
| 35 to 44 Years | 0 (0.0%) | 34 (1.7%) |
| 45 to 54 Years | 40 (1.8%) | 109 (5.1%) |
| 55 to 64 Years | 38 (3.0%) | 3 (0.3%) |
| 65 to 74 Years | 0 (0.0%) | 37 (6.2%) |
| 75 Years and over | 37 (27.2%) | 37 (13.9%) |
| Total | 236 (2.0%) | 437 (3.5%) |
Income Above Poverty by Sex and Age in Ladera Ranch
According to the poverty statistics in Ladera Ranch, males aged under 5 years and females aged under 5 years are the age groups that are most secure financially, with 100.0% of males and 100.0% of females in these age groups living above the poverty line.
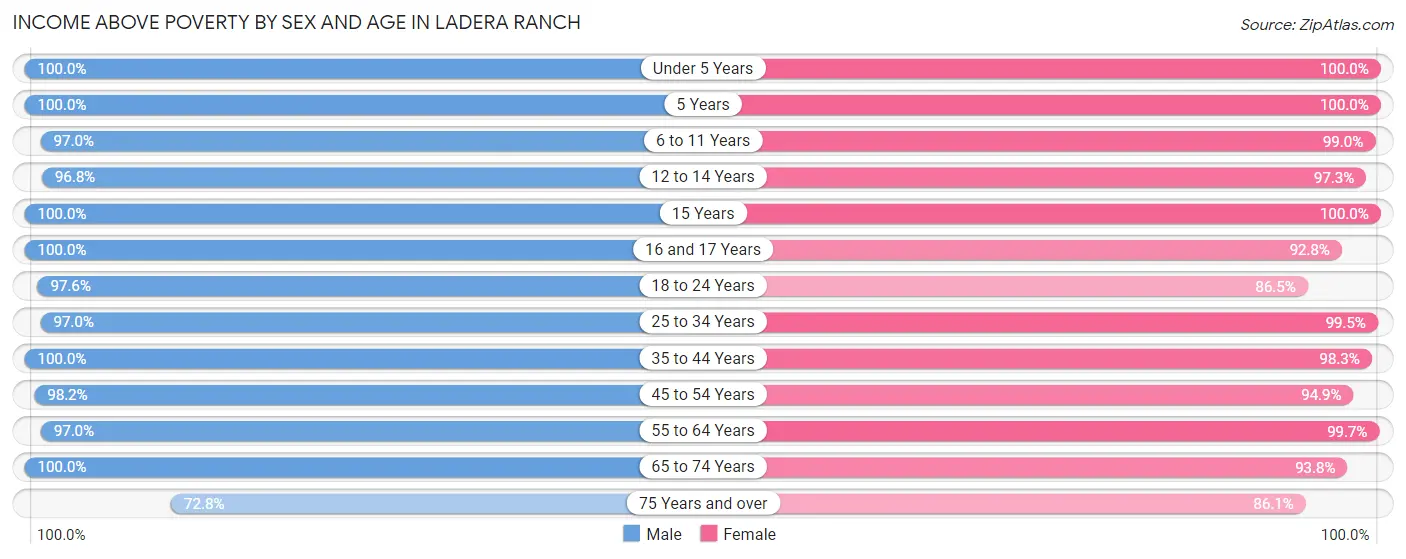
| Age Bracket | Male | Female |
| Under 5 Years | 966 (100.0%) | 991 (100.0%) |
| 5 Years | 171 (100.0%) | 178 (100.0%) |
| 6 to 11 Years | 1,816 (97.0%) | 1,622 (99.0%) |
| 12 to 14 Years | 661 (96.8%) | 650 (97.3%) |
| 15 Years | 266 (100.0%) | 173 (100.0%) |
| 16 and 17 Years | 520 (100.0%) | 488 (92.8%) |
| 18 to 24 Years | 647 (97.6%) | 887 (86.5%) |
| 25 to 34 Years | 882 (97.0%) | 922 (99.5%) |
| 35 to 44 Years | 1,724 (100.0%) | 2,004 (98.3%) |
| 45 to 54 Years | 2,154 (98.2%) | 2,042 (94.9%) |
| 55 to 64 Years | 1,221 (97.0%) | 1,161 (99.7%) |
| 65 to 74 Years | 605 (100.0%) | 561 (93.8%) |
| 75 Years and over | 99 (72.8%) | 229 (86.1%) |
| Total | 11,732 (98.0%) | 11,908 (96.5%) |
Income Below Poverty Among Married-Couple Families in Ladera Ranch
The poverty statistics for married-couple families in Ladera Ranch show that 1.9% or 98 of the total 5,164 families live below the poverty line. Families with no children have the highest poverty rate of 3.3%, comprising of 59 families. On the other hand, families with 5 or more children have the lowest poverty rate of 0.0%, which includes 0 families.
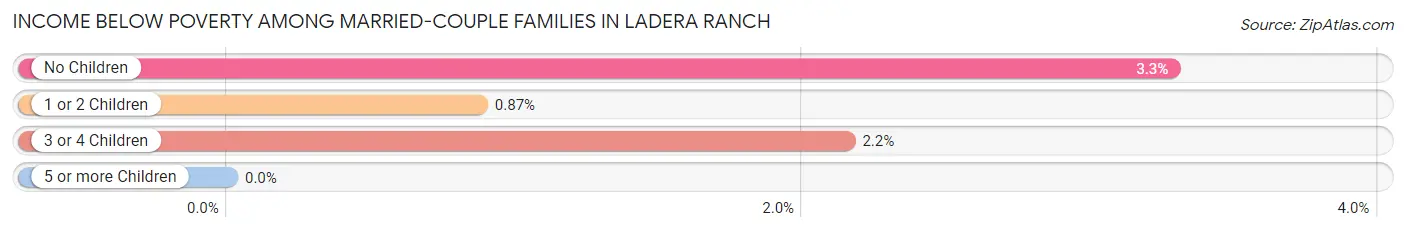
| Children | Above Poverty | Below Poverty |
| No Children | 1,741 (96.7%) | 59 (3.3%) |
| 1 or 2 Children | 2,521 (99.1%) | 22 (0.9%) |
| 3 or 4 Children | 773 (97.9%) | 17 (2.1%) |
| 5 or more Children | 31 (100.0%) | 0 (0.0%) |
| Total | 5,066 (98.1%) | 98 (1.9%) |
Income Below Poverty Among Single-Parent Households in Ladera Ranch
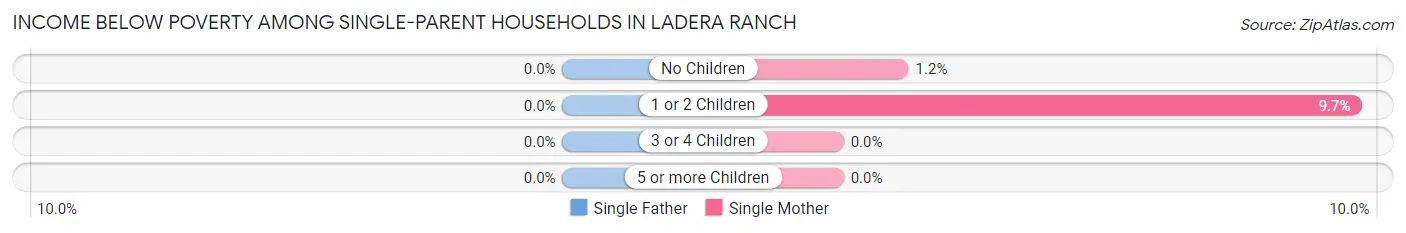
| Children | Single Father | Single Mother |
| No Children | 0 (0.0%) | 3 (1.2%) |
| 1 or 2 Children | 0 (0.0%) | 34 (9.7%) |
| 3 or 4 Children | 0 (0.0%) | 0 (0.0%) |
| 5 or more Children | 0 (0.0%) | 0 (0.0%) |
| Total | 0 (0.0%) | 37 (5.3%) |
Income Below Poverty Among Married-Couple vs Single-Parent Households in Ladera Ranch
The poverty data for Ladera Ranch shows that 98 of the married-couple family households (1.9%) and 37 of the single-parent households (3.2%) are living below the poverty level. Within the married-couple family households, those with no children have the highest poverty rate, with 59 households (3.3%) falling below the poverty line. Among the single-parent households, those with 1 or 2 children have the highest poverty rate, with 34 household (4.5%) living below poverty.
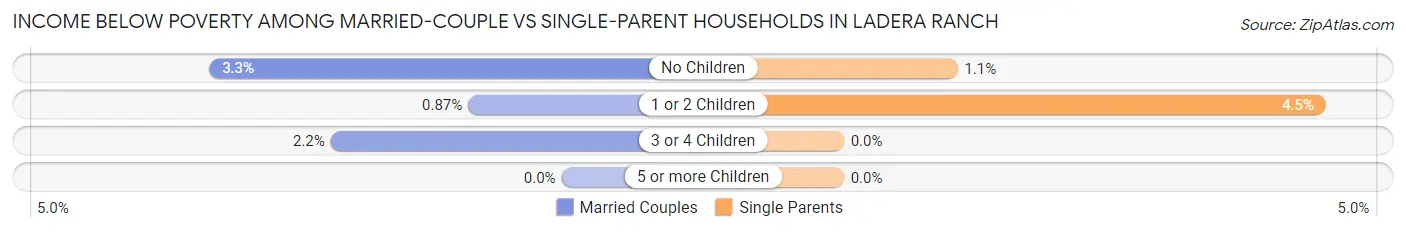
| Children | Married-Couple Families | Single-Parent Households |
| No Children | 59 (3.3%) | 3 (1.1%) |
| 1 or 2 Children | 22 (0.9%) | 34 (4.5%) |
| 3 or 4 Children | 17 (2.1%) | 0 (0.0%) |
| 5 or more Children | 0 (0.0%) | 0 (0.0%) |
| Total | 98 (1.9%) | 37 (3.2%) |
Race in Ladera Ranch
The most populous races in Ladera Ranch are White / Caucasian (16,964 | 69.7%), Asian (3,374 | 13.9%), and Two or more Races (3,031 | 12.5%).
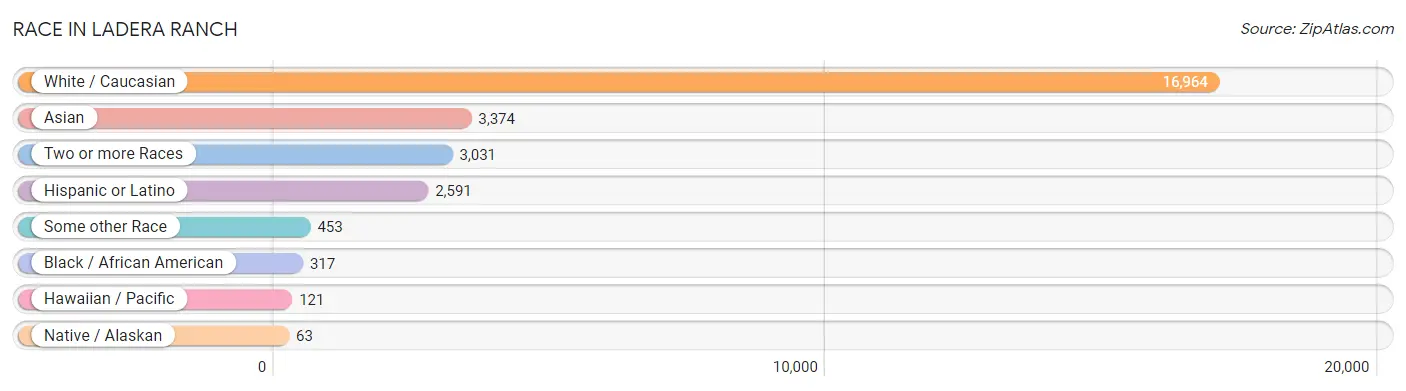
| Race | # Population | % Population |
| Asian | 3,374 | 13.9% |
| Black / African American | 317 | 1.3% |
| Hawaiian / Pacific | 121 | 0.5% |
| Hispanic or Latino | 2,591 | 10.6% |
| Native / Alaskan | 63 | 0.3% |
| White / Caucasian | 16,964 | 69.7% |
| Two or more Races | 3,031 | 12.5% |
| Some other Race | 453 | 1.9% |
| Total | 24,323 | 100.0% |
Ancestry in Ladera Ranch
The most populous ancestries reported in Ladera Ranch are German (3,372 | 13.9%), English (3,103 | 12.8%), Irish (3,050 | 12.5%), Italian (2,042 | 8.4%), and Korean (1,787 | 7.3%), together accounting for 54.9% of all Ladera Ranch residents.
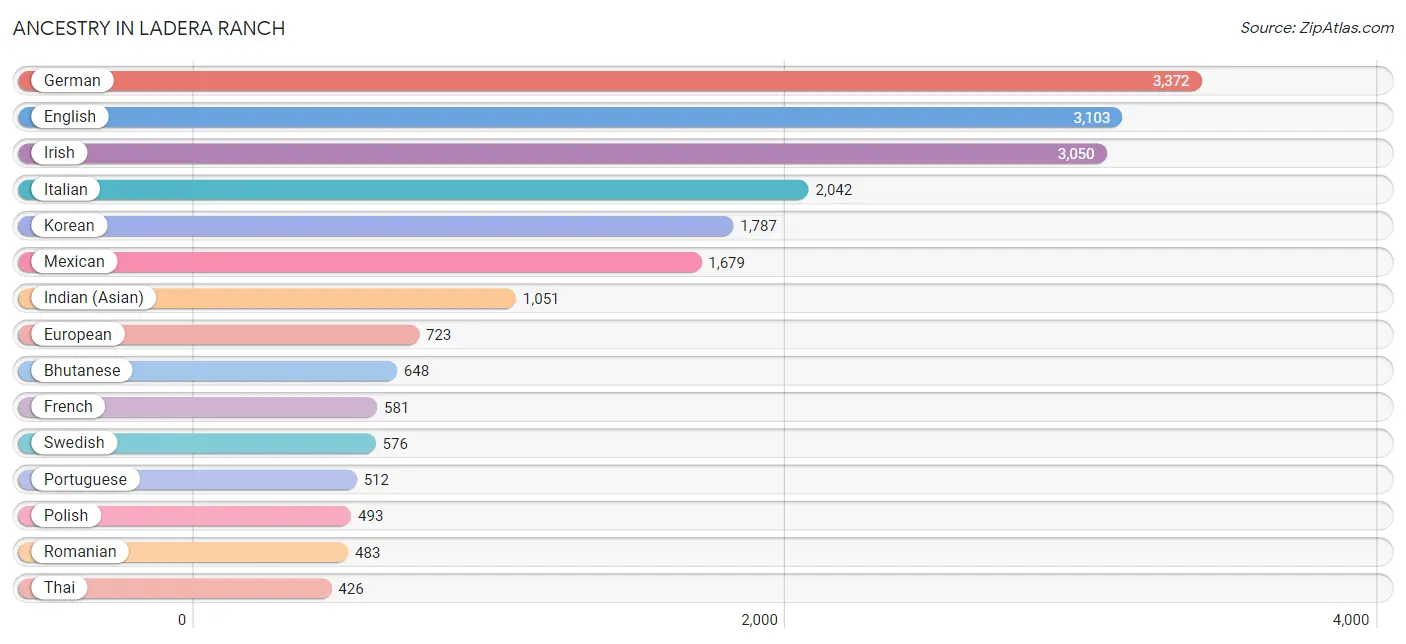
| Ancestry | # Population | % Population |
| American | 420 | 1.7% |
| Arab | 394 | 1.6% |
| Armenian | 174 | 0.7% |
| Assyrian / Chaldean / Syriac | 5 | 0.0% |
| Australian | 34 | 0.1% |
| Austrian | 233 | 1.0% |
| Belgian | 122 | 0.5% |
| Bhutanese | 648 | 2.7% |
| Blackfeet | 32 | 0.1% |
| Brazilian | 53 | 0.2% |
| British | 63 | 0.3% |
| Burmese | 252 | 1.0% |
| Canadian | 46 | 0.2% |
| Central American | 114 | 0.5% |
| Central American Indian | 15 | 0.1% |
| Cherokee | 45 | 0.2% |
| Chickasaw | 18 | 0.1% |
| Chilean | 207 | 0.9% |
| Chinese | 29 | 0.1% |
| Choctaw | 107 | 0.4% |
| Colombian | 48 | 0.2% |
| Costa Rican | 17 | 0.1% |
| Croatian | 18 | 0.1% |
| Cuban | 81 | 0.3% |
| Czech | 92 | 0.4% |
| Czechoslovakian | 34 | 0.1% |
| Danish | 140 | 0.6% |
| Dominican | 65 | 0.3% |
| Dutch | 299 | 1.2% |
| Eastern European | 370 | 1.5% |
| Ecuadorian | 18 | 0.1% |
| Egyptian | 175 | 0.7% |
| English | 3,103 | 12.8% |
| European | 723 | 3.0% |
| Filipino | 59 | 0.2% |
| Finnish | 77 | 0.3% |
| French | 581 | 2.4% |
| French Canadian | 15 | 0.1% |
| German | 3,372 | 13.9% |
| Greek | 23 | 0.1% |
| Guamanian / Chamorro | 64 | 0.3% |
| Guatemalan | 71 | 0.3% |
| Hungarian | 122 | 0.5% |
| Indian (Asian) | 1,051 | 4.3% |
| Iranian | 348 | 1.4% |
| Iraqi | 5 | 0.0% |
| Irish | 3,050 | 12.5% |
| Italian | 2,042 | 8.4% |
| Jamaican | 46 | 0.2% |
| Korean | 1,787 | 7.3% |
| Laotian | 53 | 0.2% |
| Lithuanian | 100 | 0.4% |
| Macedonian | 16 | 0.1% |
| Mexican | 1,679 | 6.9% |
| Mongolian | 41 | 0.2% |
| Moroccan | 111 | 0.5% |
| Native Hawaiian | 125 | 0.5% |
| Northern European | 12 | 0.1% |
| Norwegian | 390 | 1.6% |
| Pakistani | 92 | 0.4% |
| Palestinian | 103 | 0.4% |
| Panamanian | 12 | 0.1% |
| Peruvian | 12 | 0.1% |
| Polish | 493 | 2.0% |
| Portuguese | 512 | 2.1% |
| Puerto Rican | 285 | 1.2% |
| Romanian | 483 | 2.0% |
| Russian | 300 | 1.2% |
| Salvadoran | 14 | 0.1% |
| Scandinavian | 105 | 0.4% |
| Scotch-Irish | 297 | 1.2% |
| Scottish | 390 | 1.6% |
| Serbian | 60 | 0.3% |
| Slovak | 56 | 0.2% |
| Slovene | 28 | 0.1% |
| Somali | 142 | 0.6% |
| South American | 294 | 1.2% |
| Spanish | 14 | 0.1% |
| Sri Lankan | 349 | 1.4% |
| Subsaharan African | 152 | 0.6% |
| Sudanese | 10 | 0.0% |
| Swedish | 576 | 2.4% |
| Swiss | 122 | 0.5% |
| Thai | 426 | 1.8% |
| Ukrainian | 137 | 0.6% |
| Venezuelan | 9 | 0.0% |
| Welsh | 115 | 0.5% | View All 87 Rows |
Immigrants in Ladera Ranch
The most numerous immigrant groups reported in Ladera Ranch came from Asia (2,260 | 9.3%), South Eastern Asia (1,233 | 5.1%), Philippines (928 | 3.8%), Europe (750 | 3.1%), and Eastern Asia (585 | 2.4%), together accounting for 23.7% of all Ladera Ranch residents.
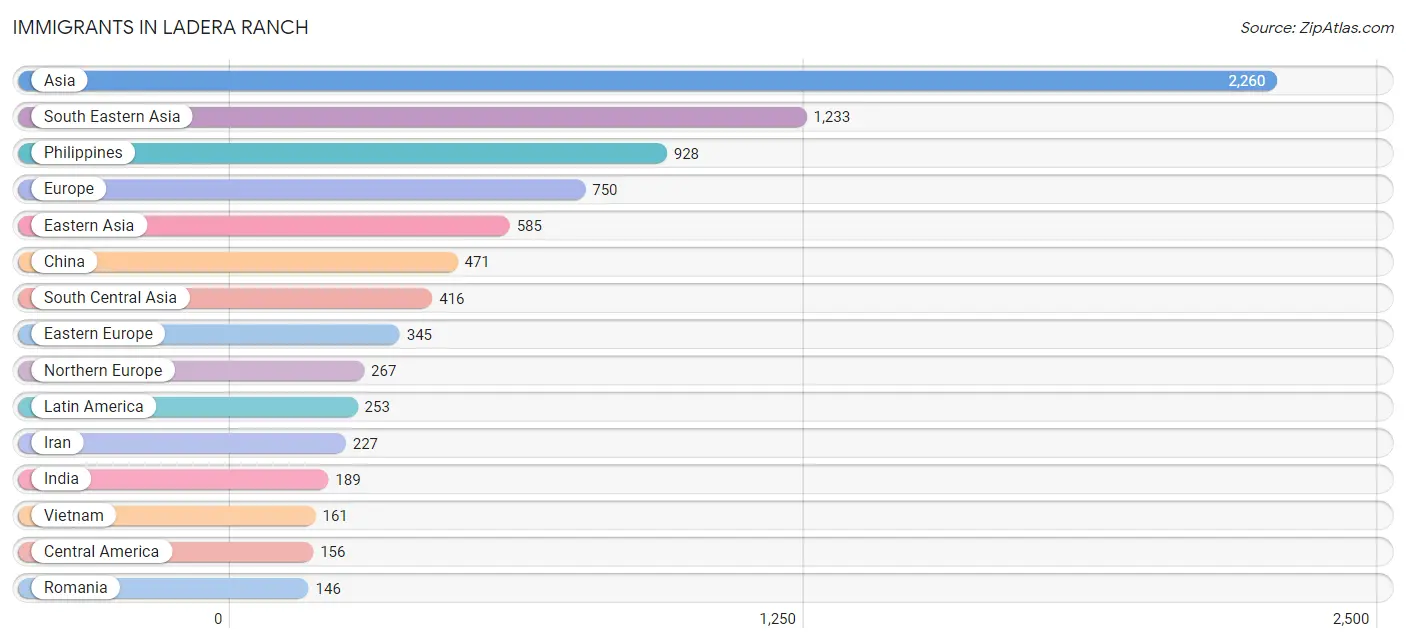
| Immigration Origin | # Population | % Population |
| Africa | 142 | 0.6% |
| Armenia | 12 | 0.1% |
| Asia | 2,260 | 9.3% |
| Australia | 67 | 0.3% |
| Austria | 14 | 0.1% |
| Belgium | 47 | 0.2% |
| Cambodia | 16 | 0.1% |
| Canada | 74 | 0.3% |
| Caribbean | 23 | 0.1% |
| Central America | 156 | 0.6% |
| Chile | 16 | 0.1% |
| China | 471 | 1.9% |
| Colombia | 40 | 0.2% |
| Eastern Africa | 20 | 0.1% |
| Eastern Asia | 585 | 2.4% |
| Eastern Europe | 345 | 1.4% |
| Ecuador | 18 | 0.1% |
| Egypt | 53 | 0.2% |
| England | 116 | 0.5% |
| Eritrea | 20 | 0.1% |
| Europe | 750 | 3.1% |
| France | 13 | 0.1% |
| Germany | 8 | 0.0% |
| Guatemala | 40 | 0.2% |
| Hong Kong | 36 | 0.2% |
| India | 189 | 0.8% |
| Indonesia | 57 | 0.2% |
| Iran | 227 | 0.9% |
| Ireland | 32 | 0.1% |
| Italy | 10 | 0.0% |
| Jamaica | 23 | 0.1% |
| Japan | 16 | 0.1% |
| Jordan | 14 | 0.1% |
| Korea | 98 | 0.4% |
| Latin America | 253 | 1.0% |
| Lithuania | 29 | 0.1% |
| Malaysia | 29 | 0.1% |
| Mexico | 116 | 0.5% |
| Middle Africa | 37 | 0.2% |
| Morocco | 22 | 0.1% |
| Northern Africa | 85 | 0.4% |
| Northern Europe | 267 | 1.1% |
| Oceania | 67 | 0.3% |
| Philippines | 928 | 3.8% |
| Poland | 72 | 0.3% |
| Portugal | 23 | 0.1% |
| Romania | 146 | 0.6% |
| Russia | 59 | 0.2% |
| Scotland | 26 | 0.1% |
| Singapore | 14 | 0.1% |
| South America | 74 | 0.3% |
| South Central Asia | 416 | 1.7% |
| South Eastern Asia | 1,233 | 5.1% |
| Southern Europe | 33 | 0.1% |
| Sudan | 10 | 0.0% |
| Sweden | 17 | 0.1% |
| Switzerland | 23 | 0.1% |
| Taiwan | 59 | 0.2% |
| Thailand | 28 | 0.1% |
| Ukraine | 39 | 0.2% |
| Vietnam | 161 | 0.7% |
| Western Asia | 26 | 0.1% |
| Western Europe | 105 | 0.4% |
| Zaire | 37 | 0.2% | View All 64 Rows |
Sex and Age in Ladera Ranch
Sex and Age in Ladera Ranch
The most populous age groups in Ladera Ranch are 10 to 14 Years (1,392 | 11.6%) for men and 5 to 9 Years (1,284 | 10.4%) for women.
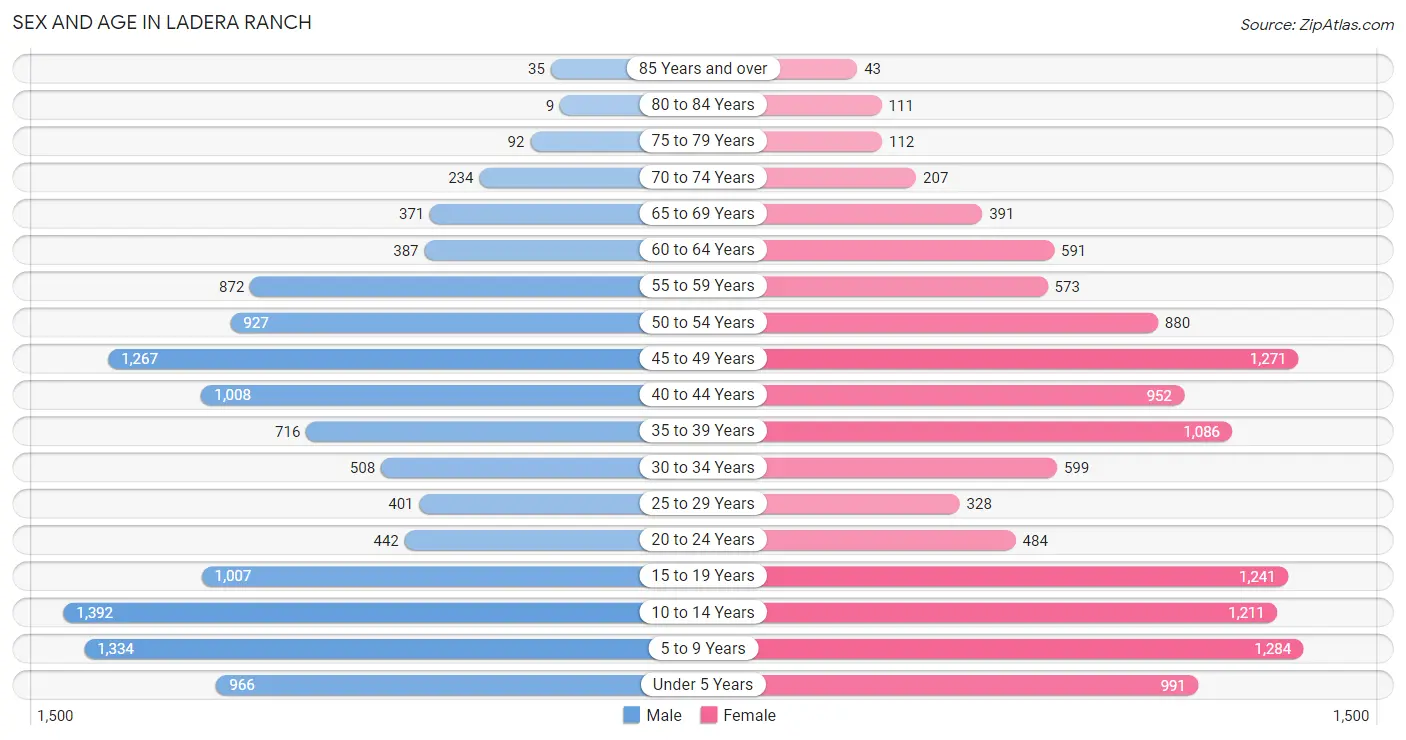
| Age Bracket | Male | Female |
| Under 5 Years | 966 (8.1%) | 991 (8.0%) |
| 5 to 9 Years | 1,334 (11.2%) | 1,284 (10.4%) |
| 10 to 14 Years | 1,392 (11.6%) | 1,211 (9.8%) |
| 15 to 19 Years | 1,007 (8.4%) | 1,241 (10.0%) |
| 20 to 24 Years | 442 (3.7%) | 484 (3.9%) |
| 25 to 29 Years | 401 (3.4%) | 328 (2.6%) |
| 30 to 34 Years | 508 (4.2%) | 599 (4.9%) |
| 35 to 39 Years | 716 (6.0%) | 1,086 (8.8%) |
| 40 to 44 Years | 1,008 (8.4%) | 952 (7.7%) |
| 45 to 49 Years | 1,267 (10.6%) | 1,271 (10.3%) |
| 50 to 54 Years | 927 (7.7%) | 880 (7.1%) |
| 55 to 59 Years | 872 (7.3%) | 573 (4.6%) |
| 60 to 64 Years | 387 (3.2%) | 591 (4.8%) |
| 65 to 69 Years | 371 (3.1%) | 391 (3.2%) |
| 70 to 74 Years | 234 (2.0%) | 207 (1.7%) |
| 75 to 79 Years | 92 (0.8%) | 112 (0.9%) |
| 80 to 84 Years | 9 (0.1%) | 111 (0.9%) |
| 85 Years and over | 35 (0.3%) | 43 (0.4%) |
| Total | 11,968 (100.0%) | 12,355 (100.0%) |
Families and Households in Ladera Ranch
Median Family Size in Ladera Ranch
The median family size in Ladera Ranch is 3.57 persons per family, with married-couple families (5,164 | 81.7%) accounting for the largest median family size of 3.65 persons per family. On the other hand, single male/father families (466 | 7.4%) represent the smallest median family size with 2.88 persons per family.
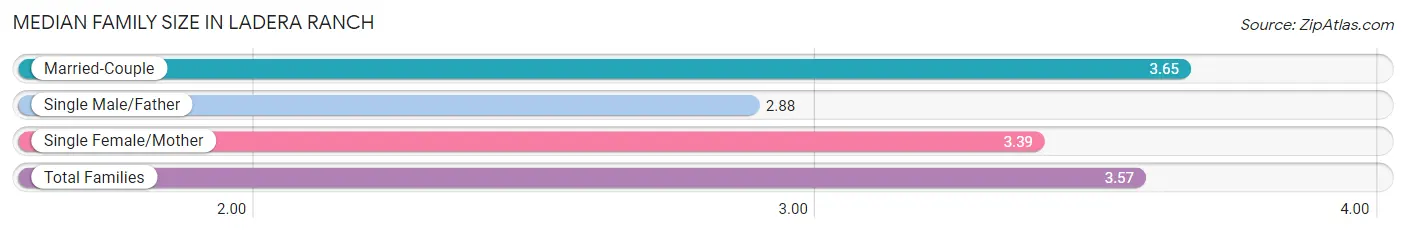
| Family Type | # Families | Family Size |
| Married-Couple | 5,164 (81.7%) | 3.65 |
| Single Male/Father | 466 (7.4%) | 2.88 |
| Single Female/Mother | 693 (11.0%) | 3.39 |
| Total Families | 6,323 (100.0%) | 3.57 |
Median Household Size in Ladera Ranch
The median household size in Ladera Ranch is 3.24 persons per household, with married-couple households (5,164 | 68.8%) accounting for the largest median household size of 3.71 persons per household. non-family households (1,188 | 15.8%) represent the smallest median household size with 1.11 persons per household.
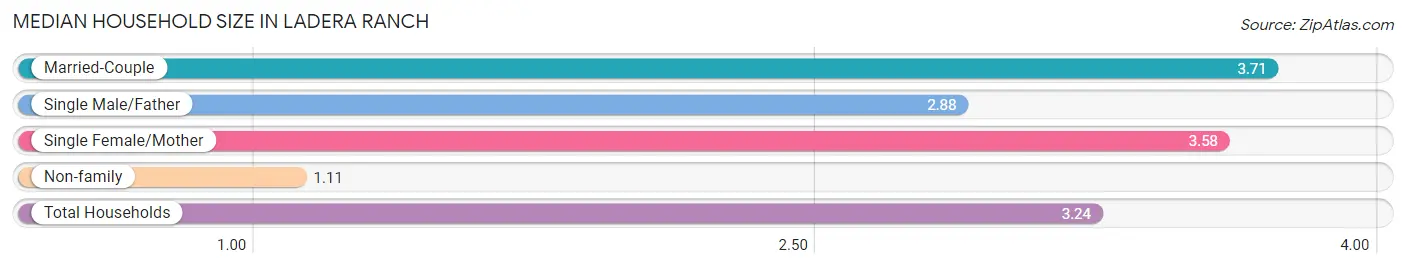
| Household Type | # Households | Household Size |
| Married-Couple | 5,164 (68.8%) | 3.71 |
| Single Male/Father | 466 (6.2%) | 2.88 |
| Single Female/Mother | 693 (9.2%) | 3.58 |
| Non-family | 1,188 (15.8%) | 1.11 |
| Total Households | 7,511 (100.0%) | 3.24 |
Household Size by Marriage Status in Ladera Ranch
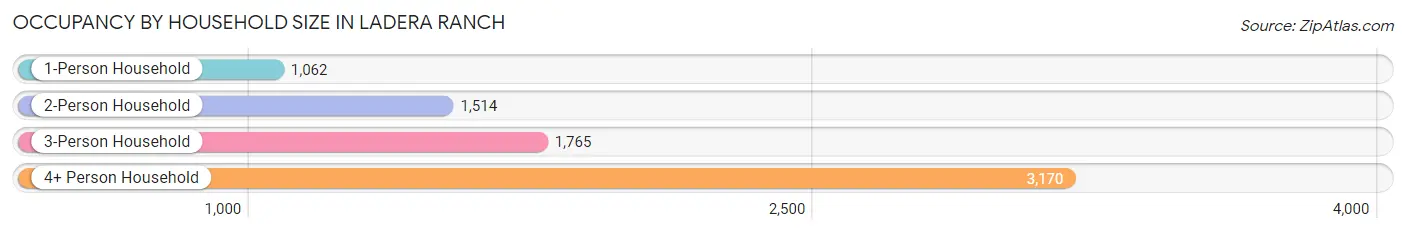
Out of a total of 7,511 households in Ladera Ranch, 6,323 (84.2%) are family households, while 1,188 (15.8%) are nonfamily households. The most numerous type of family households are 4-person households, comprising 1,953, and the most common type of nonfamily households are 1-person households, comprising 1,062.
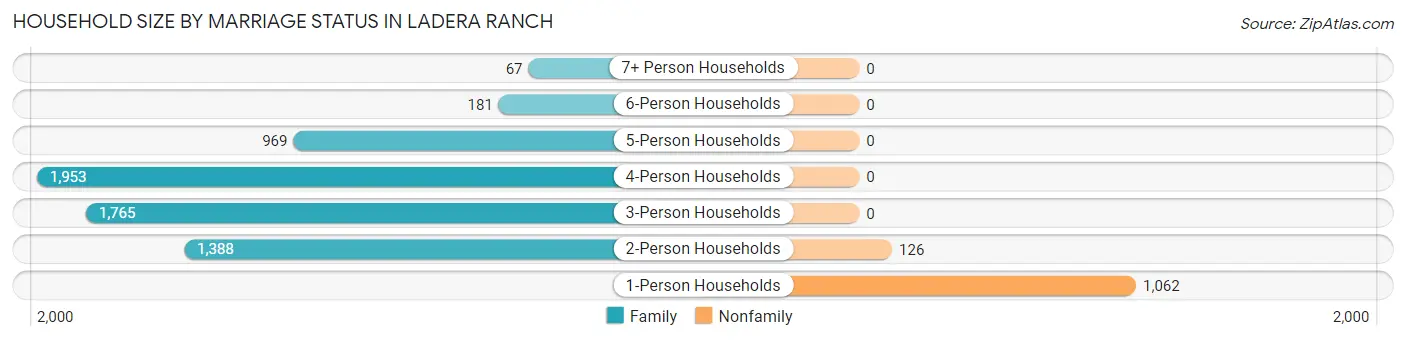
| Household Size | Family Households | Nonfamily Households |
| 1-Person Households | - | 1,062 (14.1%) |
| 2-Person Households | 1,388 (18.5%) | 126 (1.7%) |
| 3-Person Households | 1,765 (23.5%) | 0 (0.0%) |
| 4-Person Households | 1,953 (26.0%) | 0 (0.0%) |
| 5-Person Households | 969 (12.9%) | 0 (0.0%) |
| 6-Person Households | 181 (2.4%) | 0 (0.0%) |
| 7+ Person Households | 67 (0.9%) | 0 (0.0%) |
| Total | 6,323 (84.2%) | 1,188 (15.8%) |
Female Fertility in Ladera Ranch
Fertility by Age in Ladera Ranch
Average fertility rate in Ladera Ranch is 57.0 births per 1,000 women. Women in the age bracket of 20 to 34 years have the highest fertility rate with 117.0 births per 1,000 women. Women in the age bracket of 35 to 50 years acount for 54.2% of all women with births.
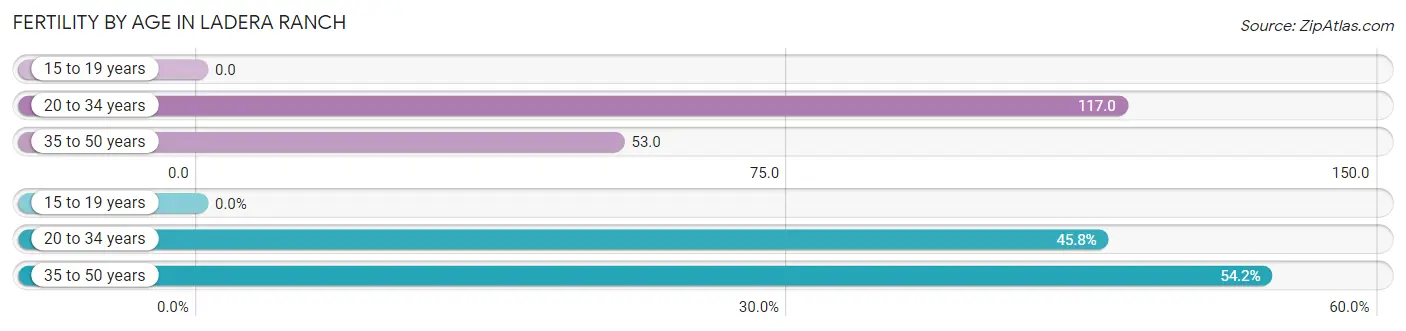
| Age Bracket | Women with Births | Births / 1,000 Women |
| 15 to 19 years | 0 (0.0%) | 0.0 |
| 20 to 34 years | 165 (45.8%) | 117.0 |
| 35 to 50 years | 195 (54.2%) | 53.0 |
| Total | 360 (100.0%) | 57.0 |
Fertility by Age by Marriage Status in Ladera Ranch
94.2% of women with births (360) in Ladera Ranch are married. The highest percentage of unmarried women with births falls into 20 to 34 years age bracket with 12.7% of them unmarried at the time of birth, while the lowest percentage of unmarried women with births belong to 35 to 50 years age bracket with 0.0% of them unmarried.
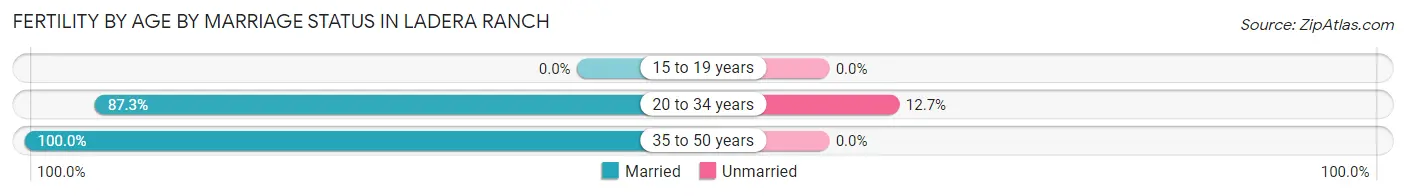
| Age Bracket | Married | Unmarried |
| 15 to 19 years | 0 (0.0%) | 0 (0.0%) |
| 20 to 34 years | 144 (87.3%) | 21 (12.7%) |
| 35 to 50 years | 195 (100.0%) | 0 (0.0%) |
| Total | 339 (94.2%) | 21 (5.8%) |
Fertility by Education in Ladera Ranch
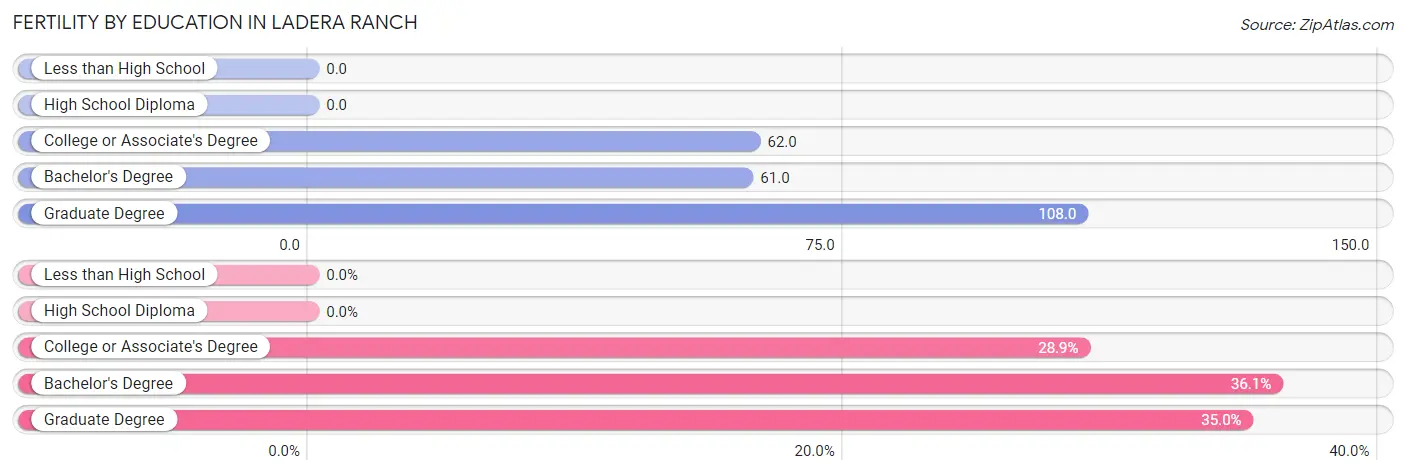
| Educational Attainment | Women with Births | Births / 1,000 Women |
| Less than High School | 0 (0.0%) | 0.0 |
| High School Diploma | 0 (0.0%) | 0.0 |
| College or Associate's Degree | 104 (28.9%) | 62.0 |
| Bachelor's Degree | 130 (36.1%) | 61.0 |
| Graduate Degree | 126 (35.0%) | 108.0 |
| Total | 360 (100.0%) | 57.0 |
Fertility by Education by Marriage Status in Ladera Ranch
5.8% of women with births in Ladera Ranch are unmarried. Women with the educational attainment of bachelor's degree are most likely to be married with 100.0% of them married at childbirth, while women with the educational attainment of graduate degree are least likely to be married with 12.7% of them unmarried at childbirth.
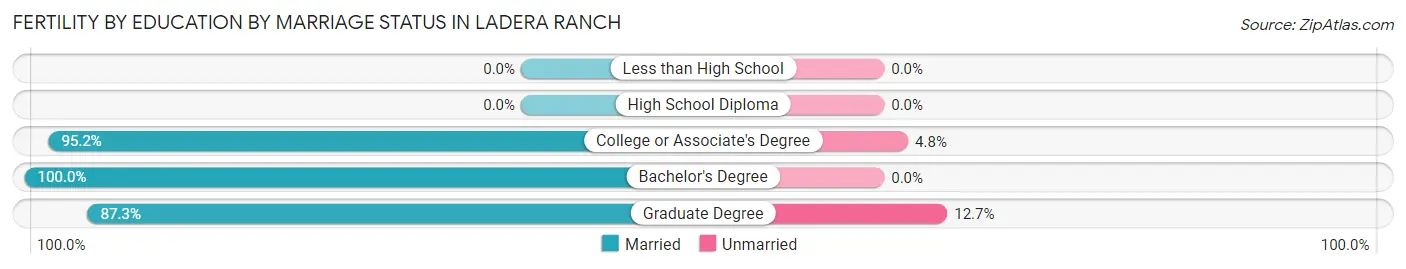
| Educational Attainment | Married | Unmarried |
| Less than High School | 0 (0.0%) | 0 (0.0%) |
| High School Diploma | 0 (0.0%) | 0 (0.0%) |
| College or Associate's Degree | 99 (95.2%) | 5 (4.8%) |
| Bachelor's Degree | 130 (100.0%) | 0 (0.0%) |
| Graduate Degree | 110 (87.3%) | 16 (12.7%) |
| Total | 339 (94.2%) | 21 (5.8%) |
Employment Characteristics in Ladera Ranch
Employment by Class of Employer in Ladera Ranch
Among the 11,612 employed individuals in Ladera Ranch, private company employees (8,199 | 70.6%), self-employed (incorporated) (948 | 8.2%), and local government employees (832 | 7.2%) make up the most common classes of employment.
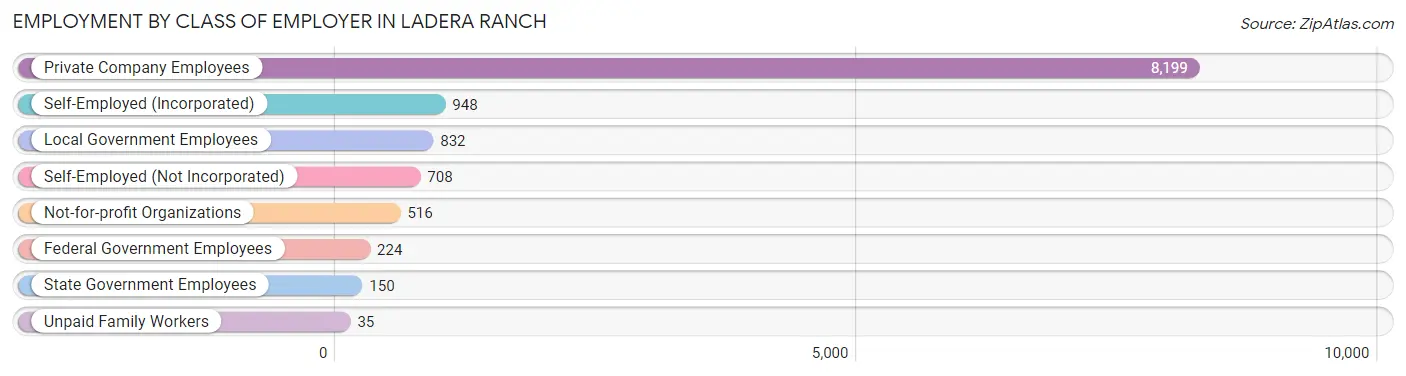
| Employer Class | # Employees | % Employees |
| Private Company Employees | 8,199 | 70.6% |
| Self-Employed (Incorporated) | 948 | 8.2% |
| Self-Employed (Not Incorporated) | 708 | 6.1% |
| Not-for-profit Organizations | 516 | 4.4% |
| Local Government Employees | 832 | 7.2% |
| State Government Employees | 150 | 1.3% |
| Federal Government Employees | 224 | 1.9% |
| Unpaid Family Workers | 35 | 0.3% |
| Total | 11,612 | 100.0% |
Employment Status by Age in Ladera Ranch
According to the labor force statistics for Ladera Ranch, out of the total population over 16 years of age (16,706), 73.5% or 12,279 individuals are in the labor force, with 2.7% or 332 of them unemployed. The age group with the highest labor force participation rate is 55 to 59 years, with 91.3% or 1,319 individuals in the labor force. Within the labor force, the 20 to 24 years age range has the highest percentage of unemployed individuals, with 15.6% or 118 of them being unemployed.
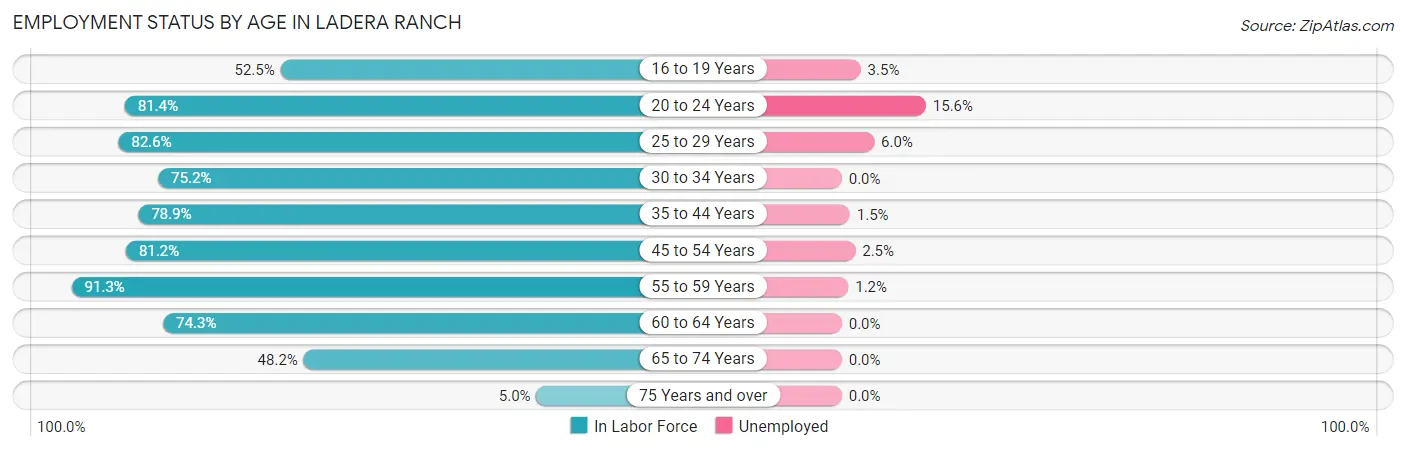
| Age Bracket | In Labor Force | Unemployed |
| 16 to 19 Years | 950 (52.5%) | 33 (3.5%) |
| 20 to 24 Years | 754 (81.4%) | 118 (15.6%) |
| 25 to 29 Years | 602 (82.6%) | 36 (6.0%) |
| 30 to 34 Years | 832 (75.2%) | 0 (0.0%) |
| 35 to 44 Years | 2,968 (78.9%) | 45 (1.5%) |
| 45 to 54 Years | 3,528 (81.2%) | 88 (2.5%) |
| 55 to 59 Years | 1,319 (91.3%) | 16 (1.2%) |
| 60 to 64 Years | 727 (74.3%) | 0 (0.0%) |
| 65 to 74 Years | 580 (48.2%) | 0 (0.0%) |
| 75 Years and over | 20 (5.0%) | 0 (0.0%) |
| Total | 12,279 (73.5%) | 332 (2.7%) |
Employment Status by Educational Attainment in Ladera Ranch
According to labor force statistics for Ladera Ranch, 80.7% of individuals (9,979) out of the total population between 25 and 64 years of age (12,366) are in the labor force, with 1.8% or 180 of them being unemployed. The group with the highest labor force participation rate are those with the educational attainment of high school diploma, with 83.2% or 617 individuals in the labor force. Within the labor force, individuals with high school diploma education have the highest percentage of unemployment, with 3.6% or 22 of them being unemployed.
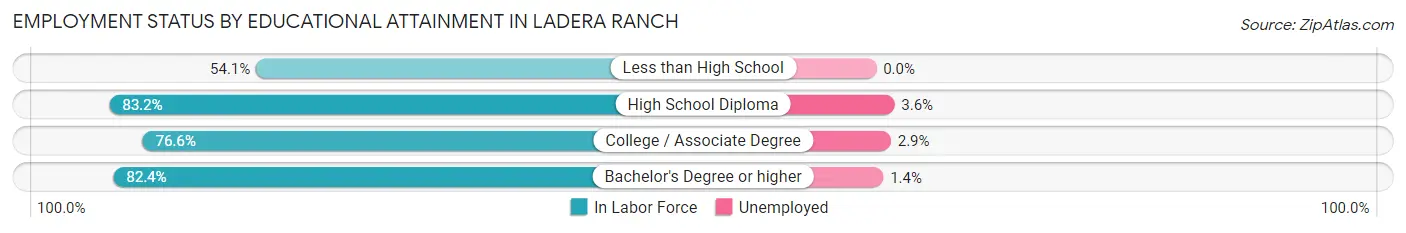
| Educational Attainment | In Labor Force | Unemployed |
| Less than High School | 85 (54.1%) | 0 (0.0%) |
| High School Diploma | 617 (83.2%) | 27 (3.6%) |
| College / Associate Degree | 2,305 (76.6%) | 87 (2.9%) |
| Bachelor's Degree or higher | 6,969 (82.4%) | 118 (1.4%) |
| Total | 9,979 (80.7%) | 223 (1.8%) |
Employment Occupations by Sex in Ladera Ranch
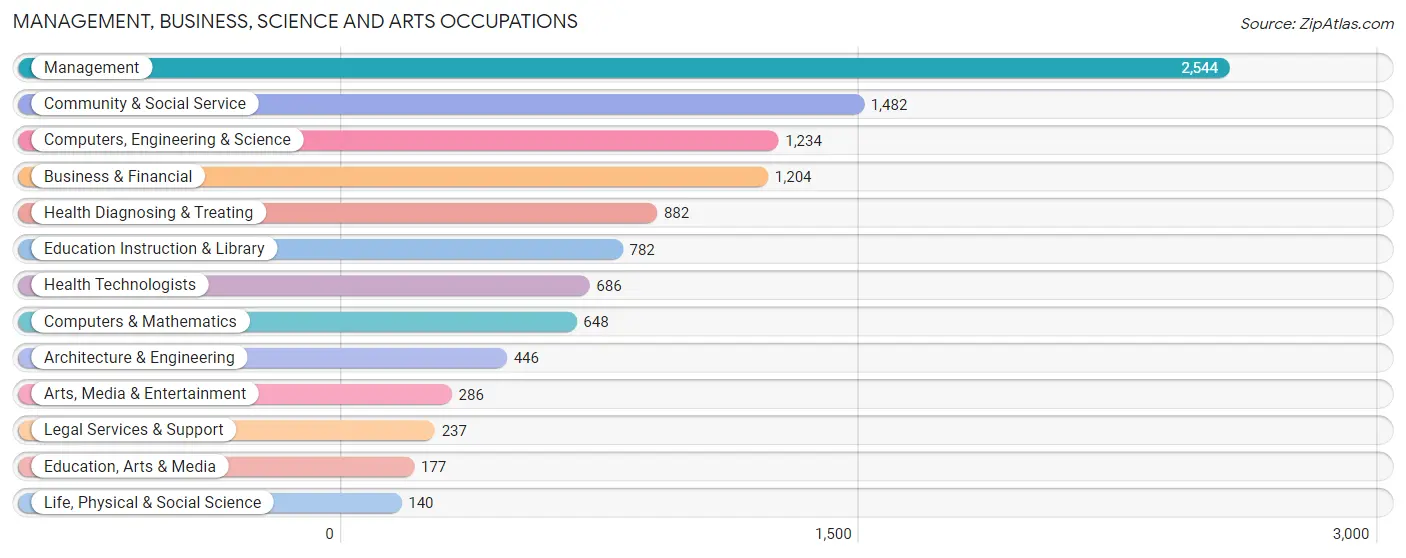
Management, Business, Science and Arts Occupations
The most common Management, Business, Science and Arts occupations in Ladera Ranch are Management (2,544 | 21.4%), Community & Social Service (1,482 | 12.5%), Computers, Engineering & Science (1,234 | 10.4%), Business & Financial (1,204 | 10.2%), and Health Diagnosing & Treating (882 | 7.4%).
Management, Business, Science and Arts Occupations by Sex
Within the Management, Business, Science and Arts occupations in Ladera Ranch, the most male-oriented occupations are Architecture & Engineering (91.0%), Computers, Engineering & Science (79.0%), and Computers & Mathematics (74.4%), while the most female-oriented occupations are Health Technologists (85.4%), Health Diagnosing & Treating (81.9%), and Education Instruction & Library (75.8%).
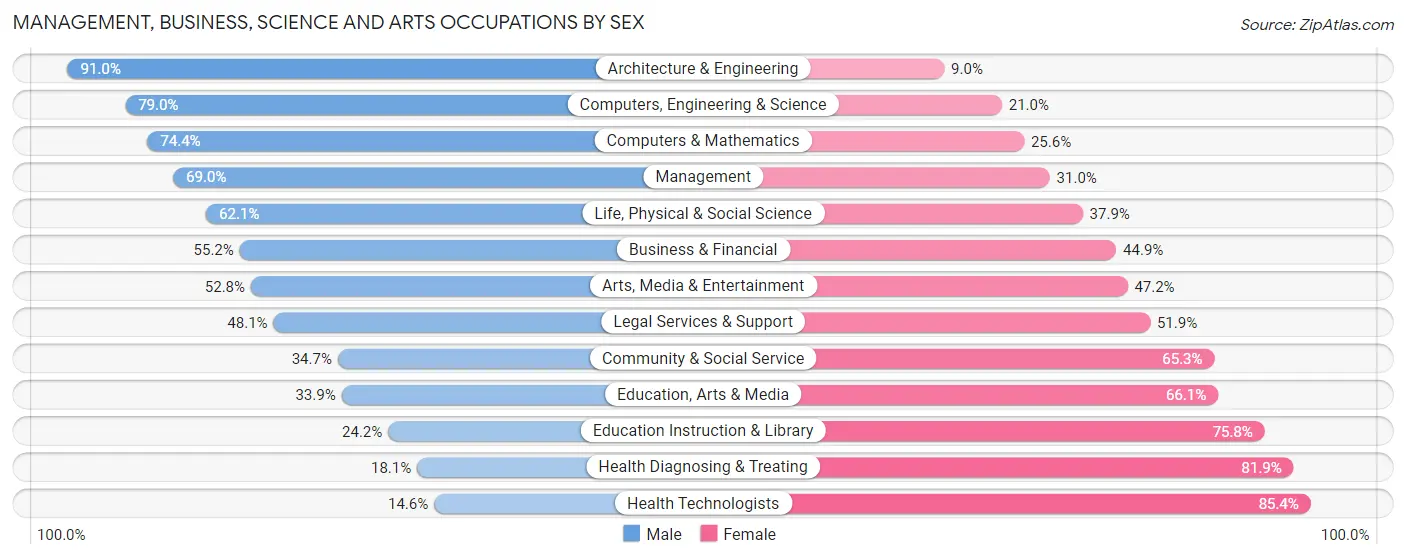
| Occupation | Male | Female |
| Management | 1,756 (69.0%) | 788 (31.0%) |
| Business & Financial | 664 (55.1%) | 540 (44.9%) |
| Computers, Engineering & Science | 975 (79.0%) | 259 (21.0%) |
| Computers & Mathematics | 482 (74.4%) | 166 (25.6%) |
| Architecture & Engineering | 406 (91.0%) | 40 (9.0%) |
| Life, Physical & Social Science | 87 (62.1%) | 53 (37.9%) |
| Community & Social Service | 514 (34.7%) | 968 (65.3%) |
| Education, Arts & Media | 60 (33.9%) | 117 (66.1%) |
| Legal Services & Support | 114 (48.1%) | 123 (51.9%) |
| Education Instruction & Library | 189 (24.2%) | 593 (75.8%) |
| Arts, Media & Entertainment | 151 (52.8%) | 135 (47.2%) |
| Health Diagnosing & Treating | 160 (18.1%) | 722 (81.9%) |
| Health Technologists | 100 (14.6%) | 586 (85.4%) |
| Total (Category) | 4,069 (55.4%) | 3,277 (44.6%) |
| Total (Overall) | 6,421 (54.1%) | 5,446 (45.9%) |
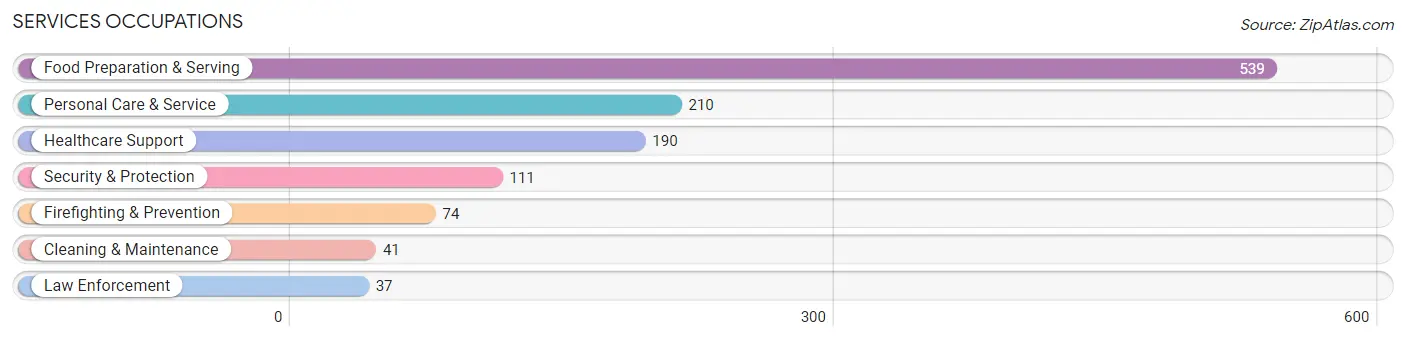
Services Occupations
The most common Services occupations in Ladera Ranch are Food Preparation & Serving (539 | 4.5%), Personal Care & Service (210 | 1.8%), Healthcare Support (190 | 1.6%), Security & Protection (111 | 0.9%), and Firefighting & Prevention (74 | 0.6%).
Services Occupations by Sex
Within the Services occupations in Ladera Ranch, the most male-oriented occupations are Security & Protection (100.0%), Firefighting & Prevention (100.0%), and Law Enforcement (100.0%), while the most female-oriented occupations are Healthcare Support (86.8%), Personal Care & Service (63.8%), and Food Preparation & Serving (63.3%).
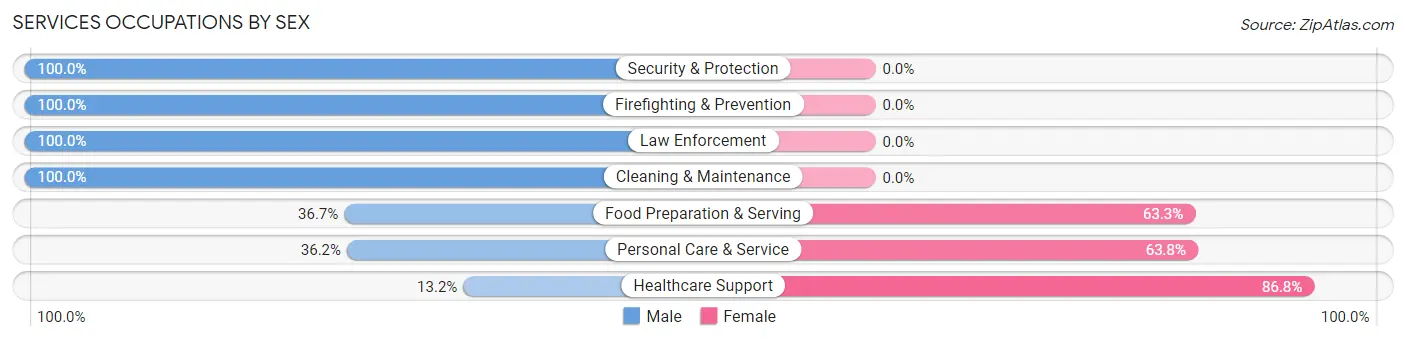
| Occupation | Male | Female |
| Healthcare Support | 25 (13.2%) | 165 (86.8%) |
| Security & Protection | 111 (100.0%) | 0 (0.0%) |
| Firefighting & Prevention | 74 (100.0%) | 0 (0.0%) |
| Law Enforcement | 37 (100.0%) | 0 (0.0%) |
| Food Preparation & Serving | 198 (36.7%) | 341 (63.3%) |
| Cleaning & Maintenance | 41 (100.0%) | 0 (0.0%) |
| Personal Care & Service | 76 (36.2%) | 134 (63.8%) |
| Total (Category) | 451 (41.3%) | 640 (58.7%) |
| Total (Overall) | 6,421 (54.1%) | 5,446 (45.9%) |
Sales and Office Occupations
The most common Sales and Office occupations in Ladera Ranch are Sales & Related (1,625 | 13.7%), and Office & Administration (1,156 | 9.7%).
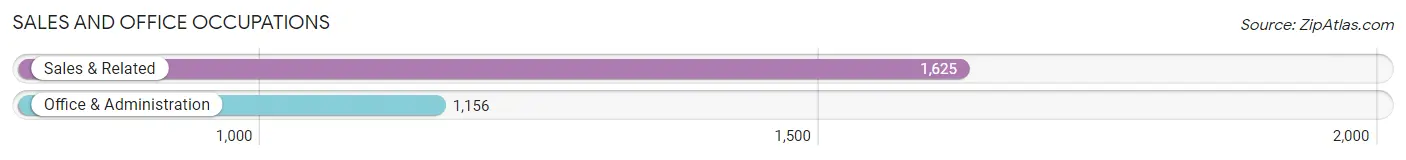
Sales and Office Occupations by Sex
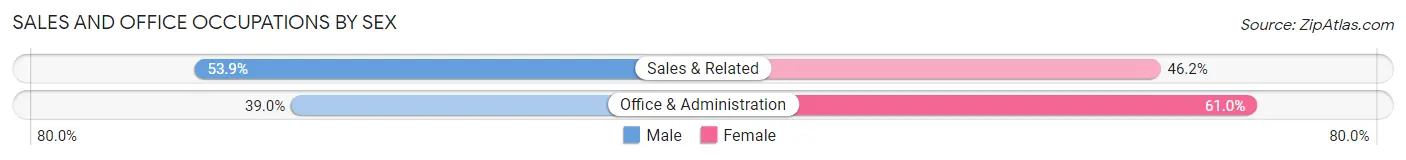
| Occupation | Male | Female |
| Sales & Related | 875 (53.8%) | 750 (46.2%) |
| Office & Administration | 451 (39.0%) | 705 (61.0%) |
| Total (Category) | 1,326 (47.7%) | 1,455 (52.3%) |
| Total (Overall) | 6,421 (54.1%) | 5,446 (45.9%) |
Natural Resources, Construction and Maintenance Occupations
The most common Natural Resources, Construction and Maintenance occupations in Ladera Ranch are Installation, Maintenance & Repair (88 | 0.7%), and Construction & Extraction (47 | 0.4%).
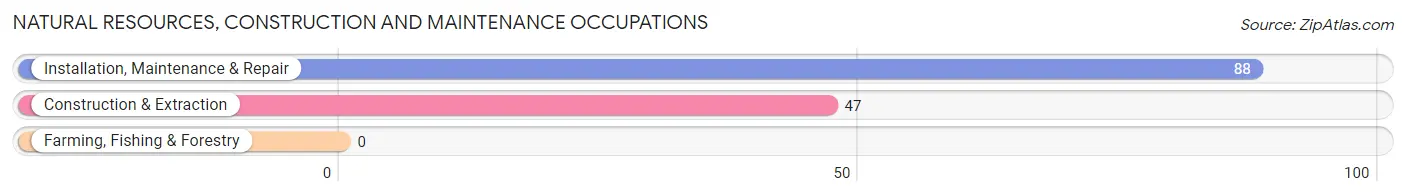
Natural Resources, Construction and Maintenance Occupations by Sex
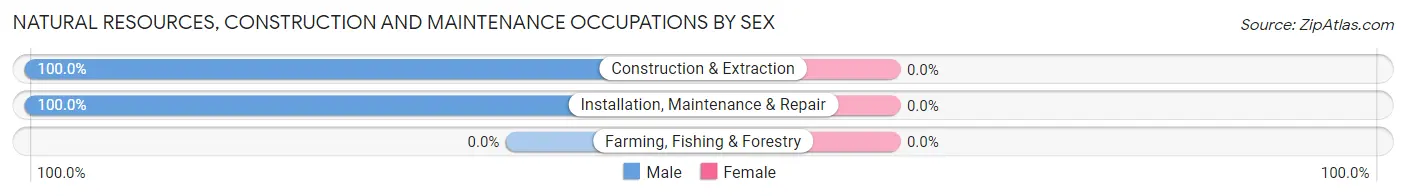
| Occupation | Male | Female |
| Farming, Fishing & Forestry | 0 (0.0%) | 0 (0.0%) |
| Construction & Extraction | 47 (100.0%) | 0 (0.0%) |
| Installation, Maintenance & Repair | 88 (100.0%) | 0 (0.0%) |
| Total (Category) | 135 (100.0%) | 0 (0.0%) |
| Total (Overall) | 6,421 (54.1%) | 5,446 (45.9%) |
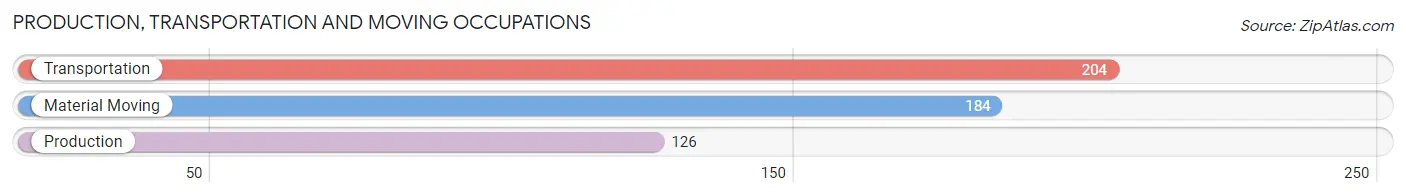
Production, Transportation and Moving Occupations
The most common Production, Transportation and Moving occupations in Ladera Ranch are Transportation (204 | 1.7%), Material Moving (184 | 1.5%), and Production (126 | 1.1%).
Production, Transportation and Moving Occupations by Sex
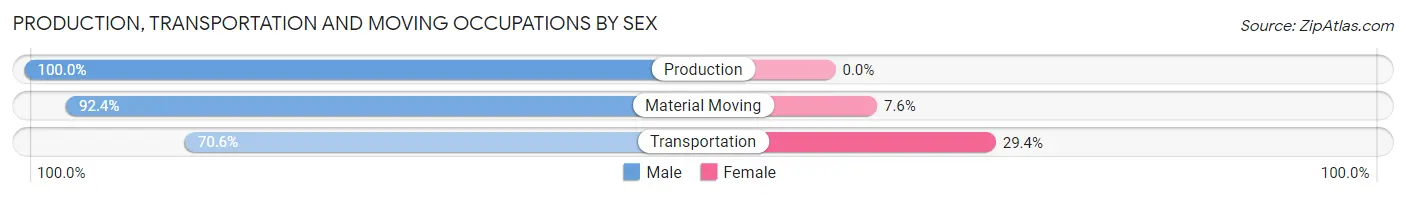
| Occupation | Male | Female |
| Production | 126 (100.0%) | 0 (0.0%) |
| Transportation | 144 (70.6%) | 60 (29.4%) |
| Material Moving | 170 (92.4%) | 14 (7.6%) |
| Total (Category) | 440 (85.6%) | 74 (14.4%) |
| Total (Overall) | 6,421 (54.1%) | 5,446 (45.9%) |
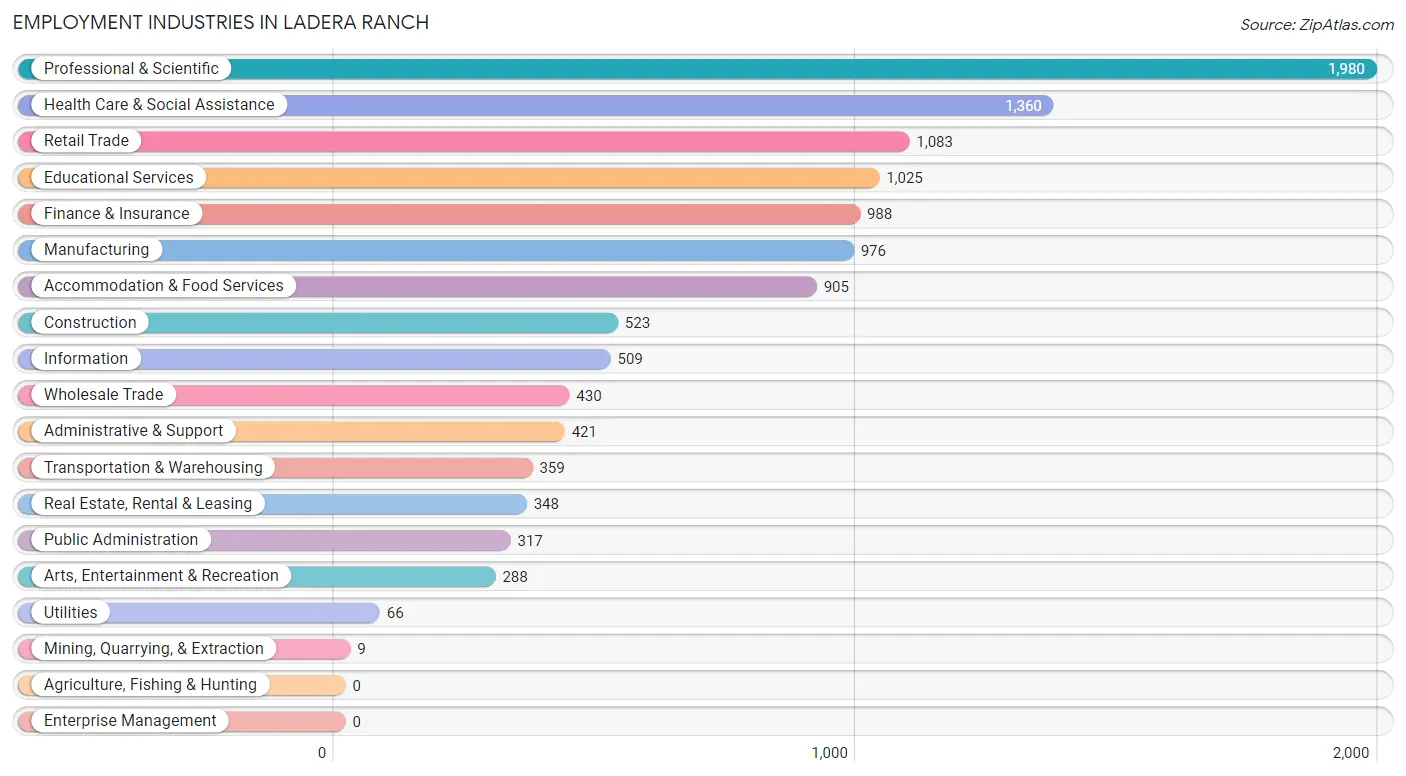
Employment Industries by Sex in Ladera Ranch
Employment Industries in Ladera Ranch
The major employment industries in Ladera Ranch include Professional & Scientific (1,980 | 16.7%), Health Care & Social Assistance (1,360 | 11.5%), Retail Trade (1,083 | 9.1%), Educational Services (1,025 | 8.6%), and Finance & Insurance (988 | 8.3%).
Employment Industries by Sex in Ladera Ranch
The Ladera Ranch industries that see more men than women are Mining, Quarrying, & Extraction (100.0%), Utilities (100.0%), and Administrative & Support (84.6%), whereas the industries that tend to have a higher number of women are Health Care & Social Assistance (82.4%), Educational Services (77.8%), and Transportation & Warehousing (63.8%).
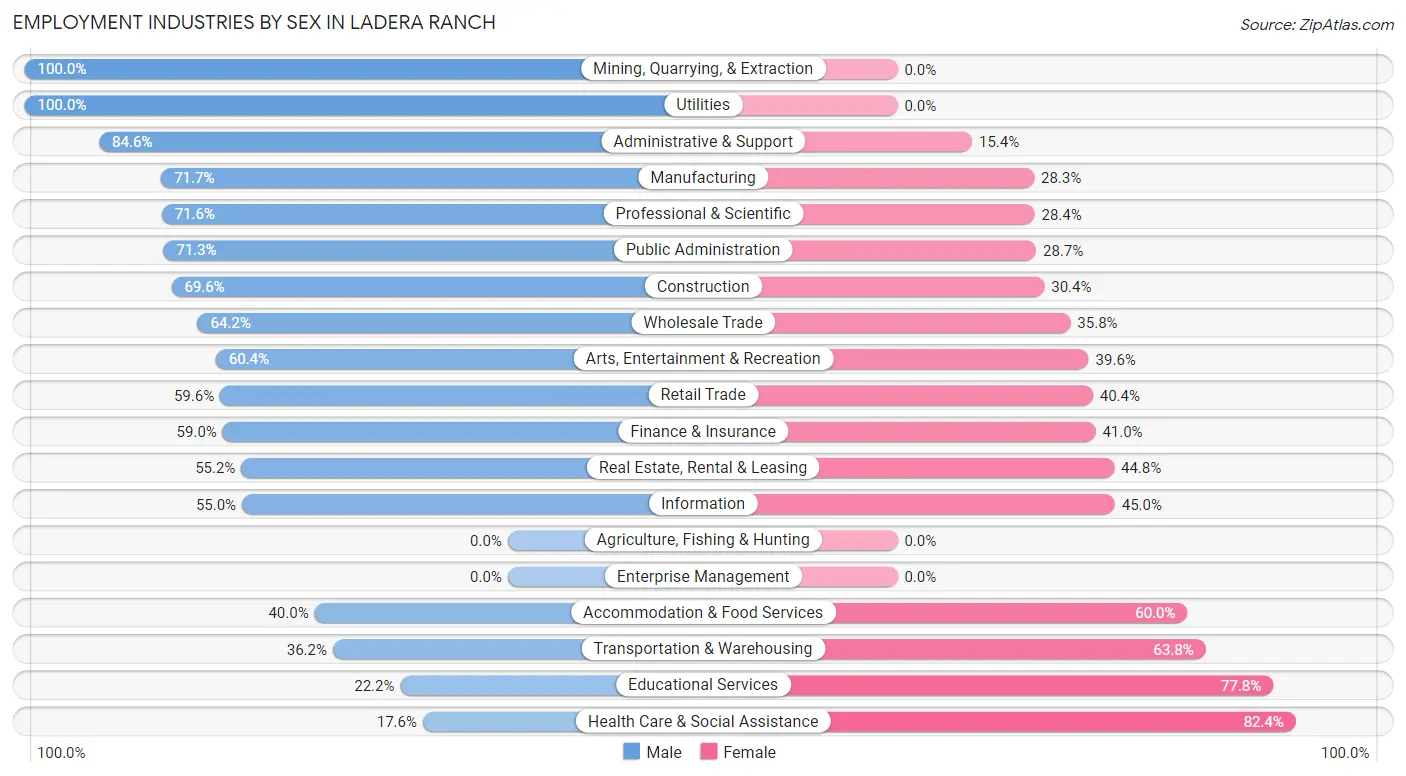
| Industry | Male | Female |
| Agriculture, Fishing & Hunting | 0 (0.0%) | 0 (0.0%) |
| Mining, Quarrying, & Extraction | 9 (100.0%) | 0 (0.0%) |
| Construction | 364 (69.6%) | 159 (30.4%) |
| Manufacturing | 700 (71.7%) | 276 (28.3%) |
| Wholesale Trade | 276 (64.2%) | 154 (35.8%) |
| Retail Trade | 645 (59.6%) | 438 (40.4%) |
| Transportation & Warehousing | 130 (36.2%) | 229 (63.8%) |
| Utilities | 66 (100.0%) | 0 (0.0%) |
| Information | 280 (55.0%) | 229 (45.0%) |
| Finance & Insurance | 583 (59.0%) | 405 (41.0%) |
| Real Estate, Rental & Leasing | 192 (55.2%) | 156 (44.8%) |
| Professional & Scientific | 1,418 (71.6%) | 562 (28.4%) |
| Enterprise Management | 0 (0.0%) | 0 (0.0%) |
| Administrative & Support | 356 (84.6%) | 65 (15.4%) |
| Educational Services | 228 (22.2%) | 797 (77.8%) |
| Health Care & Social Assistance | 239 (17.6%) | 1,121 (82.4%) |
| Arts, Entertainment & Recreation | 174 (60.4%) | 114 (39.6%) |
| Accommodation & Food Services | 362 (40.0%) | 543 (60.0%) |
| Public Administration | 226 (71.3%) | 91 (28.7%) |
| Total | 6,421 (54.1%) | 5,446 (45.9%) |
Education in Ladera Ranch
School Enrollment in Ladera Ranch
The most common levels of schooling among the 8,939 students in Ladera Ranch are elementary school (2,196 | 24.6%), middle school (1,916 | 21.4%), and high school (1,798 | 20.1%).
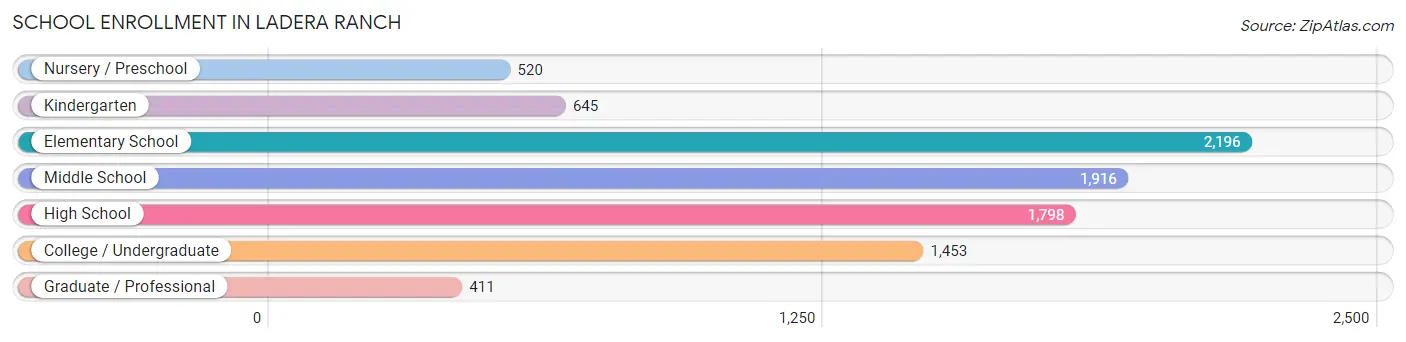
| School Level | # Students | % Students |
| Nursery / Preschool | 520 | 5.8% |
| Kindergarten | 645 | 7.2% |
| Elementary School | 2,196 | 24.6% |
| Middle School | 1,916 | 21.4% |
| High School | 1,798 | 20.1% |
| College / Undergraduate | 1,453 | 16.3% |
| Graduate / Professional | 411 | 4.6% |
| Total | 8,939 | 100.0% |
School Enrollment by Age by Funding Source in Ladera Ranch
Out of a total of 8,939 students who are enrolled in schools in Ladera Ranch, 2,127 (23.8%) attend a private institution, while the remaining 6,812 (76.2%) are enrolled in public schools. The age group of 3 to 4 year olds has the highest likelihood of being enrolled in private schools, with 380 (82.3% in the age bracket) enrolled. Conversely, the age group of 18 to 19 year olds has the lowest likelihood of being enrolled in a private school, with 584 (92.3% in the age bracket) attending a public institution.
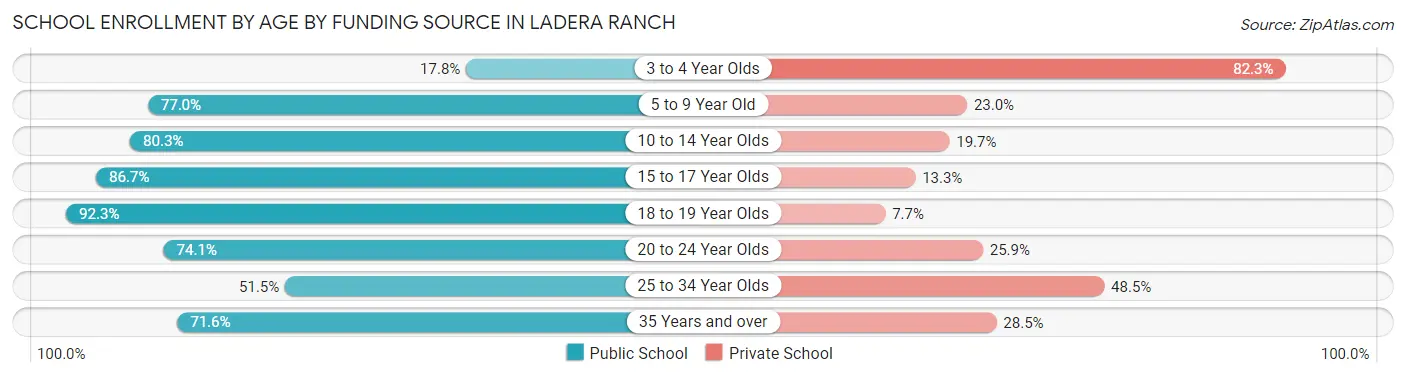
| Age Bracket | Public School | Private School |
| 3 to 4 Year Olds | 82 (17.7%) | 380 (82.3%) |
| 5 to 9 Year Old | 1,916 (77.0%) | 571 (23.0%) |
| 10 to 14 Year Olds | 2,066 (80.3%) | 506 (19.7%) |
| 15 to 17 Year Olds | 1,262 (86.7%) | 194 (13.3%) |
| 18 to 19 Year Olds | 584 (92.3%) | 49 (7.7%) |
| 20 to 24 Year Olds | 466 (74.1%) | 163 (25.9%) |
| 25 to 34 Year Olds | 174 (51.5%) | 164 (48.5%) |
| 35 Years and over | 259 (71.6%) | 103 (28.4%) |
| Total | 6,812 (76.2%) | 2,127 (23.8%) |
Educational Attainment by Field of Study in Ladera Ranch
Business (2,167 | 22.5%), engineering (908 | 9.4%), social sciences (901 | 9.3%), communications (842 | 8.7%), and science & technology (748 | 7.7%) are the most common fields of study among 9,653 individuals in Ladera Ranch who have obtained a bachelor's degree or higher.
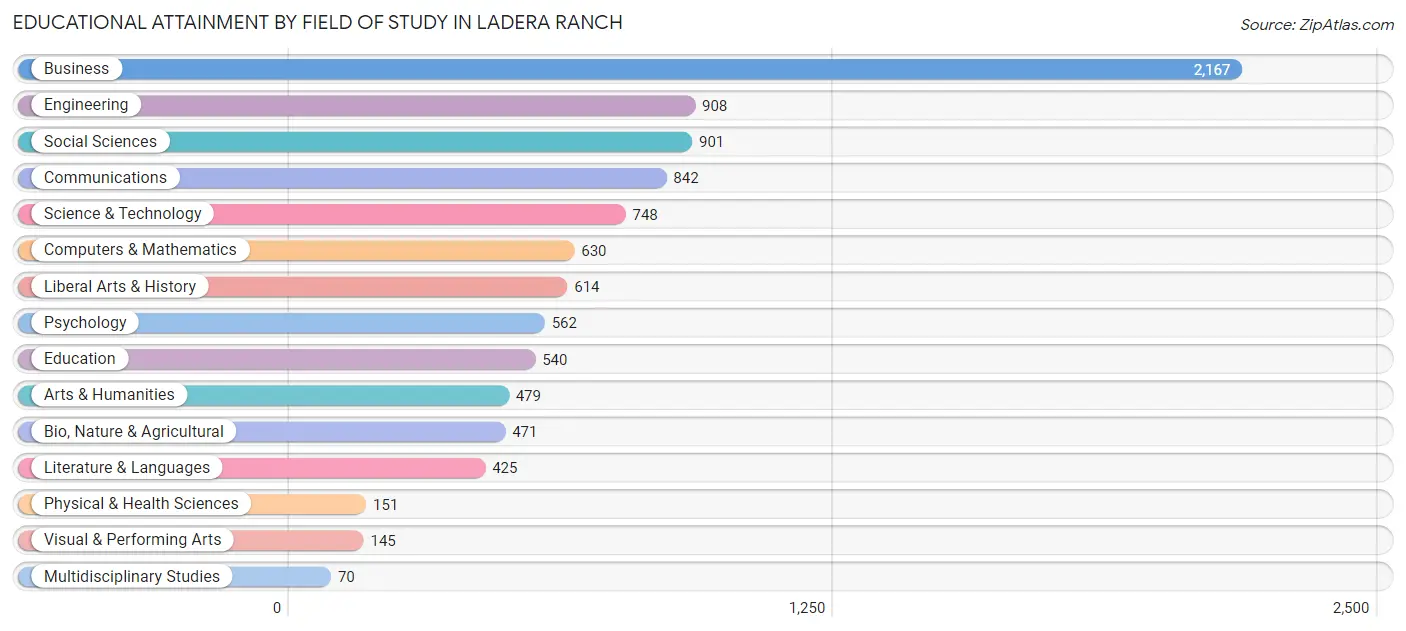
| Field of Study | # Graduates | % Graduates |
| Computers & Mathematics | 630 | 6.5% |
| Bio, Nature & Agricultural | 471 | 4.9% |
| Physical & Health Sciences | 151 | 1.6% |
| Psychology | 562 | 5.8% |
| Social Sciences | 901 | 9.3% |
| Engineering | 908 | 9.4% |
| Multidisciplinary Studies | 70 | 0.7% |
| Science & Technology | 748 | 7.7% |
| Business | 2,167 | 22.5% |
| Education | 540 | 5.6% |
| Literature & Languages | 425 | 4.4% |
| Liberal Arts & History | 614 | 6.4% |
| Visual & Performing Arts | 145 | 1.5% |
| Communications | 842 | 8.7% |
| Arts & Humanities | 479 | 5.0% |
| Total | 9,653 | 100.0% |
Transportation & Commute in Ladera Ranch
Vehicle Availability by Sex in Ladera Ranch
The most prevalent vehicle ownership categories in Ladera Ranch are males with 2 vehicles (3,523, accounting for 54.2%) and females with 2 vehicles (2,115, making up 69.0%).
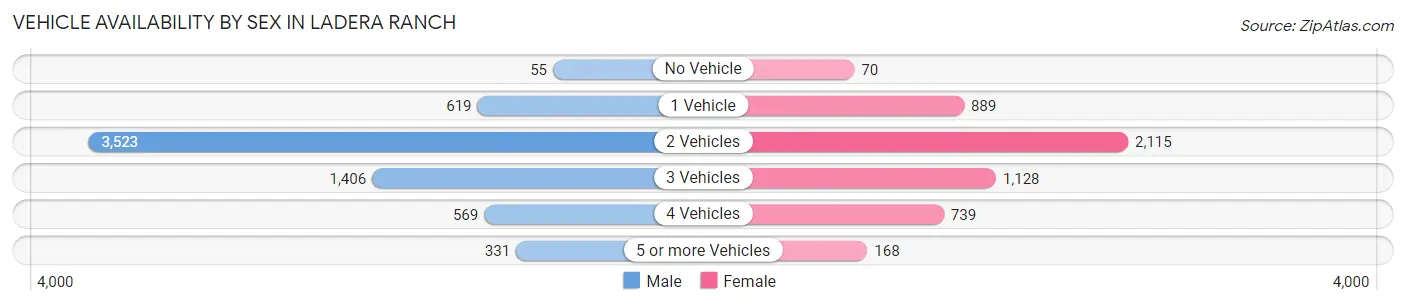
| Vehicles Available | Male | Female |
| No Vehicle | 55 (0.9%) | 70 (1.4%) |
| 1 Vehicle | 619 (9.5%) | 889 (17.4%) |
| 2 Vehicles | 3,523 (54.2%) | 2,115 (41.4%) |
| 3 Vehicles | 1,406 (21.6%) | 1,128 (22.1%) |
| 4 Vehicles | 569 (8.7%) | 739 (14.5%) |
| 5 or more Vehicles | 331 (5.1%) | 168 (3.3%) |
| Total | 6,503 (100.0%) | 5,109 (100.0%) |
Commute Time in Ladera Ranch
The most frequently occuring commute durations in Ladera Ranch are 20 to 24 minutes (1,786 commuters, 20.1%), 30 to 34 minutes (1,721 commuters, 19.3%), and 10 to 14 minutes (988 commuters, 11.1%).
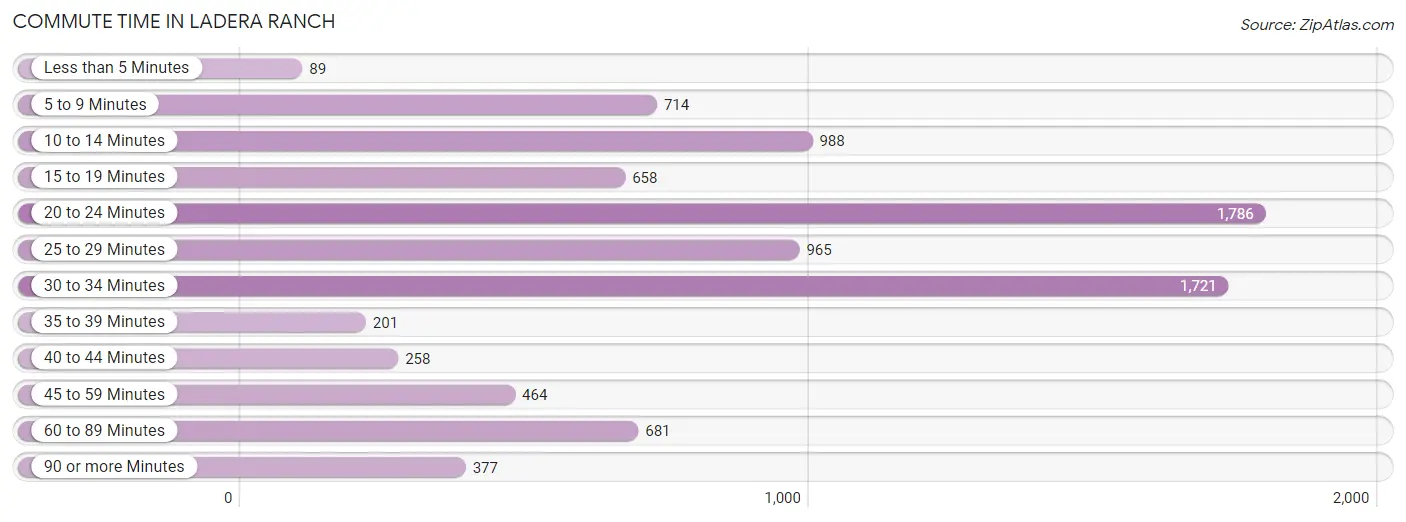
| Commute Time | # Commuters | % Commuters |
| Less than 5 Minutes | 89 | 1.0% |
| 5 to 9 Minutes | 714 | 8.0% |
| 10 to 14 Minutes | 988 | 11.1% |
| 15 to 19 Minutes | 658 | 7.4% |
| 20 to 24 Minutes | 1,786 | 20.1% |
| 25 to 29 Minutes | 965 | 10.8% |
| 30 to 34 Minutes | 1,721 | 19.3% |
| 35 to 39 Minutes | 201 | 2.3% |
| 40 to 44 Minutes | 258 | 2.9% |
| 45 to 59 Minutes | 464 | 5.2% |
| 60 to 89 Minutes | 681 | 7.6% |
| 90 or more Minutes | 377 | 4.2% |
Commute Time by Sex in Ladera Ranch
The most common commute times in Ladera Ranch are 30 to 34 minutes (985 commuters, 20.0%) for males and 20 to 24 minutes (937 commuters, 23.6%) for females.
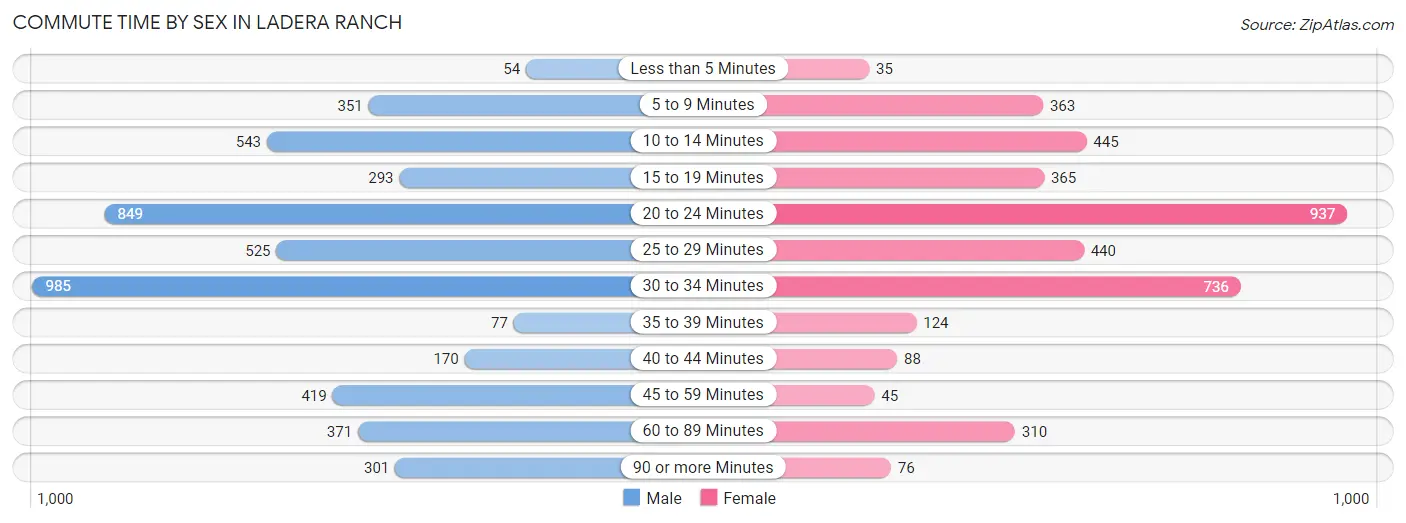
| Commute Time | Male | Female |
| Less than 5 Minutes | 54 (1.1%) | 35 (0.9%) |
| 5 to 9 Minutes | 351 (7.1%) | 363 (9.2%) |
| 10 to 14 Minutes | 543 (11.0%) | 445 (11.2%) |
| 15 to 19 Minutes | 293 (5.9%) | 365 (9.2%) |
| 20 to 24 Minutes | 849 (17.2%) | 937 (23.6%) |
| 25 to 29 Minutes | 525 (10.6%) | 440 (11.1%) |
| 30 to 34 Minutes | 985 (20.0%) | 736 (18.6%) |
| 35 to 39 Minutes | 77 (1.6%) | 124 (3.1%) |
| 40 to 44 Minutes | 170 (3.4%) | 88 (2.2%) |
| 45 to 59 Minutes | 419 (8.5%) | 45 (1.1%) |
| 60 to 89 Minutes | 371 (7.5%) | 310 (7.8%) |
| 90 or more Minutes | 301 (6.1%) | 76 (1.9%) |
Time of Departure to Work by Sex in Ladera Ranch
The most frequent times of departure to work in Ladera Ranch are 9:00 AM to 9:59 AM (893, 18.1%) for males and 8:30 AM to 8:59 AM (574, 14.5%) for females.
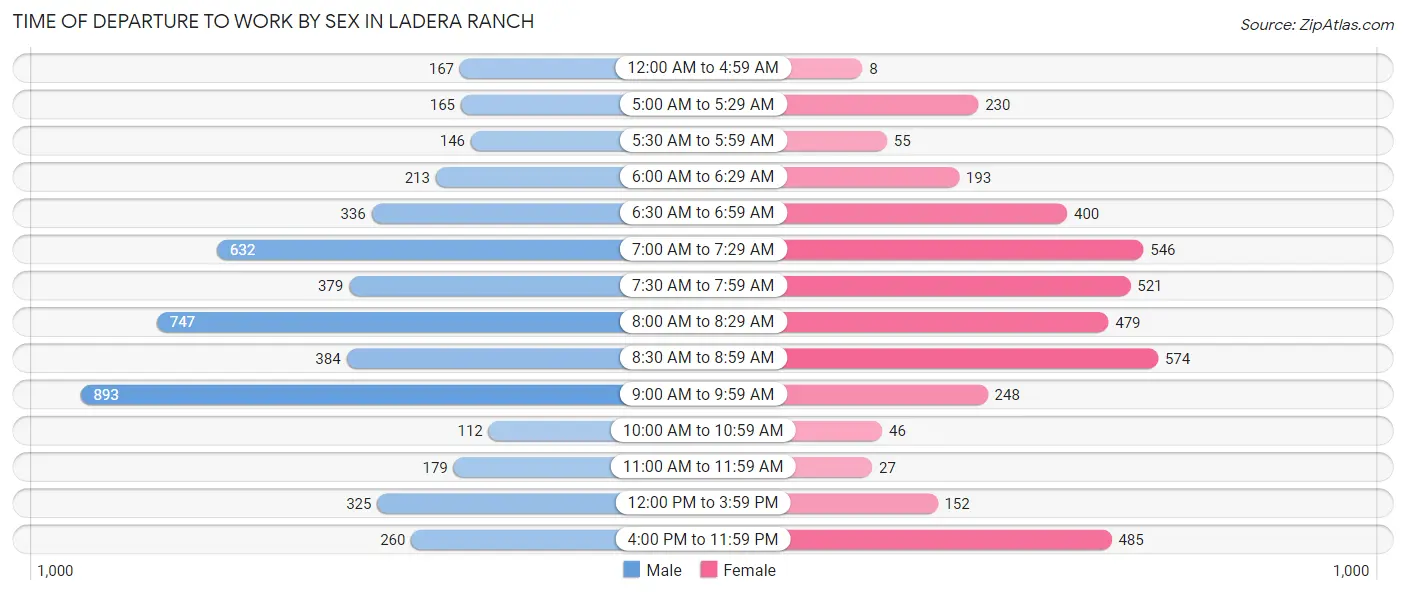
| Time of Departure | Male | Female |
| 12:00 AM to 4:59 AM | 167 (3.4%) | 8 (0.2%) |
| 5:00 AM to 5:29 AM | 165 (3.3%) | 230 (5.8%) |
| 5:30 AM to 5:59 AM | 146 (3.0%) | 55 (1.4%) |
| 6:00 AM to 6:29 AM | 213 (4.3%) | 193 (4.9%) |
| 6:30 AM to 6:59 AM | 336 (6.8%) | 400 (10.1%) |
| 7:00 AM to 7:29 AM | 632 (12.8%) | 546 (13.8%) |
| 7:30 AM to 7:59 AM | 379 (7.7%) | 521 (13.1%) |
| 8:00 AM to 8:29 AM | 747 (15.1%) | 479 (12.1%) |
| 8:30 AM to 8:59 AM | 384 (7.8%) | 574 (14.5%) |
| 9:00 AM to 9:59 AM | 893 (18.1%) | 248 (6.3%) |
| 10:00 AM to 10:59 AM | 112 (2.3%) | 46 (1.2%) |
| 11:00 AM to 11:59 AM | 179 (3.6%) | 27 (0.7%) |
| 12:00 PM to 3:59 PM | 325 (6.6%) | 152 (3.8%) |
| 4:00 PM to 11:59 PM | 260 (5.3%) | 485 (12.2%) |
| Total | 4,938 (100.0%) | 3,964 (100.0%) |
Housing Occupancy in Ladera Ranch
Occupancy by Ownership in Ladera Ranch
Of the total 7,511 dwellings in Ladera Ranch, owner-occupied units account for 5,498 (73.2%), while renter-occupied units make up 2,013 (26.8%).
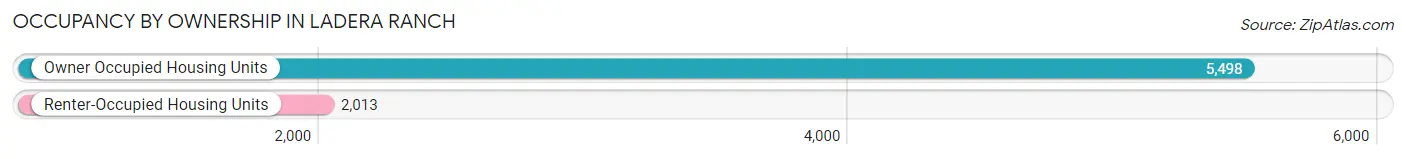
| Occupancy | # Housing Units | % Housing Units |
| Owner Occupied Housing Units | 5,498 | 73.2% |
| Renter-Occupied Housing Units | 2,013 | 26.8% |
| Total Occupied Housing Units | 7,511 | 100.0% |
Occupancy by Household Size in Ladera Ranch
| Household Size | # Housing Units | % Housing Units |
| 1-Person Household | 1,062 | 14.1% |
| 2-Person Household | 1,514 | 20.2% |
| 3-Person Household | 1,765 | 23.5% |
| 4+ Person Household | 3,170 | 42.2% |
| Total Housing Units | 7,511 | 100.0% |
Occupancy by Ownership by Household Size in Ladera Ranch
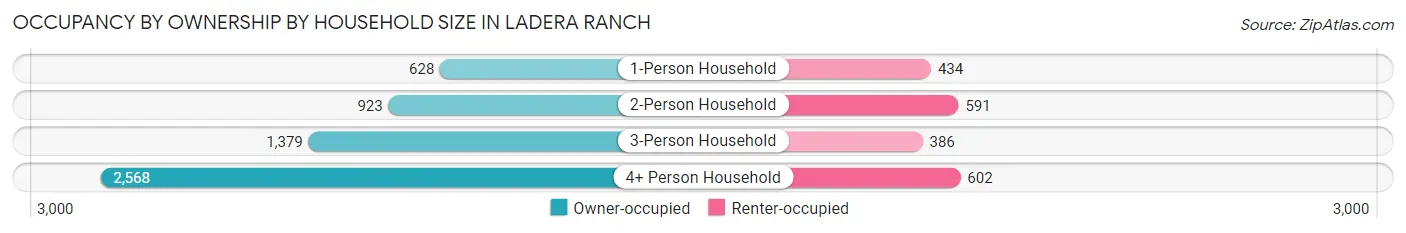
| Household Size | Owner-occupied | Renter-occupied |
| 1-Person Household | 628 (59.1%) | 434 (40.9%) |
| 2-Person Household | 923 (61.0%) | 591 (39.0%) |
| 3-Person Household | 1,379 (78.1%) | 386 (21.9%) |
| 4+ Person Household | 2,568 (81.0%) | 602 (19.0%) |
| Total Housing Units | 5,498 (73.2%) | 2,013 (26.8%) |
Occupancy by Educational Attainment in Ladera Ranch
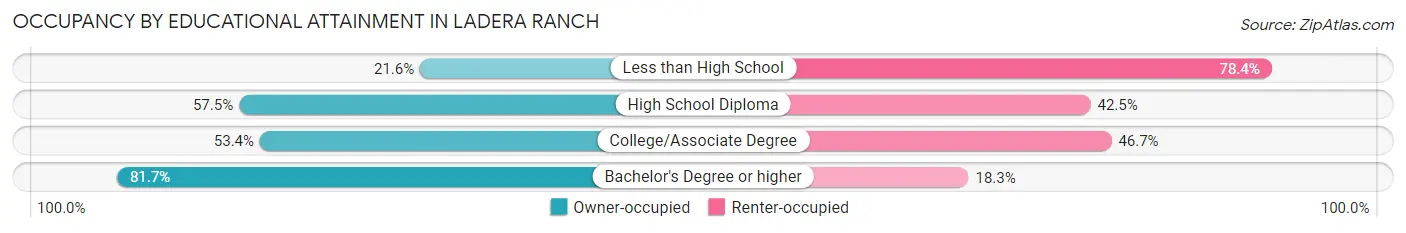
| Household Size | Owner-occupied | Renter-occupied |
| Less than High School | 27 (21.6%) | 98 (78.4%) |
| High School Diploma | 238 (57.5%) | 176 (42.5%) |
| College/Associate Degree | 869 (53.3%) | 760 (46.7%) |
| Bachelor's Degree or higher | 4,364 (81.7%) | 979 (18.3%) |
Occupancy by Age of Householder in Ladera Ranch
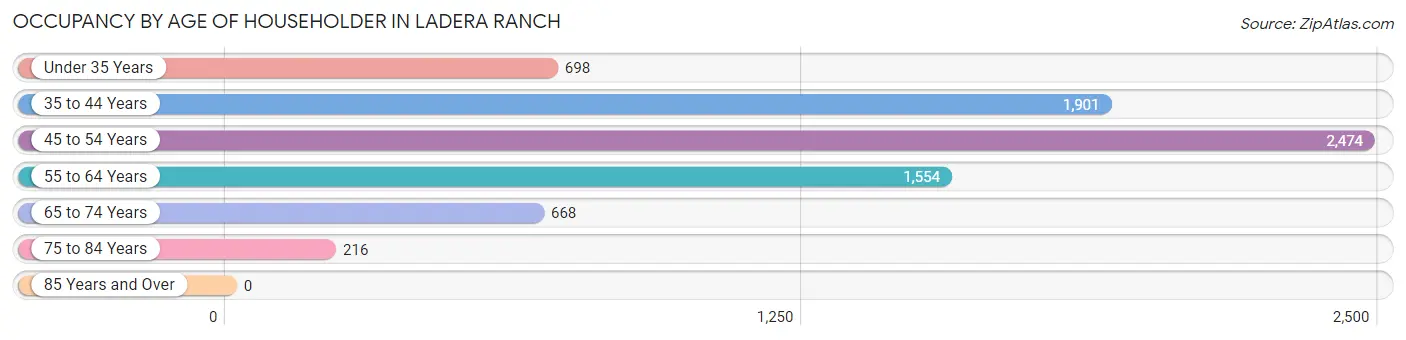
| Age Bracket | # Households | % Households |
| Under 35 Years | 698 | 9.3% |
| 35 to 44 Years | 1,901 | 25.3% |
| 45 to 54 Years | 2,474 | 32.9% |
| 55 to 64 Years | 1,554 | 20.7% |
| 65 to 74 Years | 668 | 8.9% |
| 75 to 84 Years | 216 | 2.9% |
| 85 Years and Over | 0 | 0.0% |
| Total | 7,511 | 100.0% |
Housing Finances in Ladera Ranch
Median Income by Occupancy in Ladera Ranch
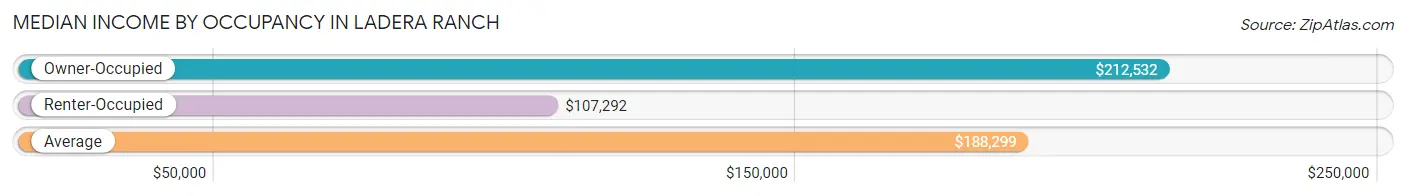
| Occupancy Type | # Households | Median Income |
| Owner-Occupied | 5,498 (73.2%) | $212,532 |
| Renter-Occupied | 2,013 (26.8%) | $107,292 |
| Average | 7,511 (100.0%) | $188,299 |
Occupancy by Householder Income Bracket in Ladera Ranch
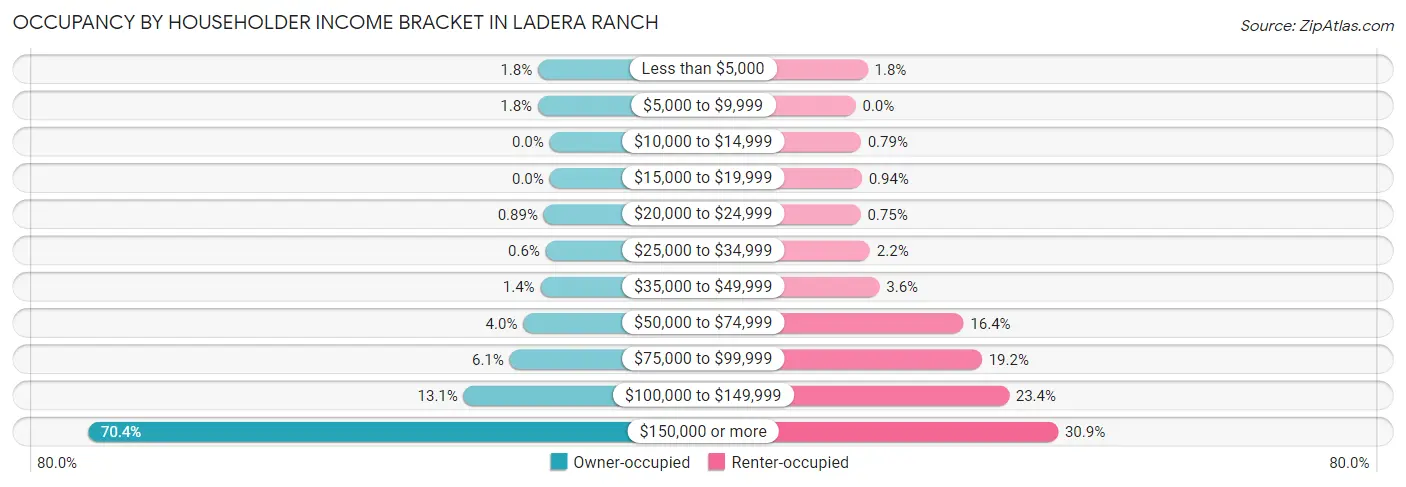
| Income Bracket | Owner-occupied | Renter-occupied |
| Less than $5,000 | 97 (1.8%) | 37 (1.8%) |
| $5,000 to $9,999 | 98 (1.8%) | 0 (0.0%) |
| $10,000 to $14,999 | 0 (0.0%) | 16 (0.8%) |
| $15,000 to $19,999 | 0 (0.0%) | 19 (0.9%) |
| $20,000 to $24,999 | 49 (0.9%) | 15 (0.7%) |
| $25,000 to $34,999 | 33 (0.6%) | 44 (2.2%) |
| $35,000 to $49,999 | 77 (1.4%) | 73 (3.6%) |
| $50,000 to $74,999 | 221 (4.0%) | 331 (16.4%) |
| $75,000 to $99,999 | 335 (6.1%) | 387 (19.2%) |
| $100,000 to $149,999 | 720 (13.1%) | 470 (23.4%) |
| $150,000 or more | 3,868 (70.4%) | 621 (30.8%) |
| Total | 5,498 (100.0%) | 2,013 (100.0%) |
Monthly Housing Cost Tiers in Ladera Ranch
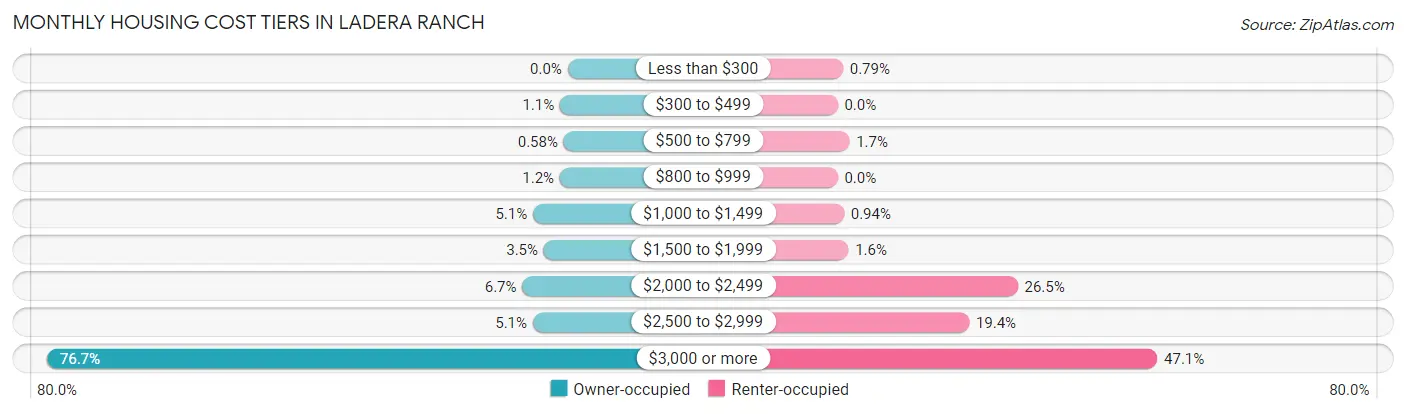
| Monthly Cost | Owner-occupied | Renter-occupied |
| Less than $300 | 0 (0.0%) | 16 (0.8%) |
| $300 to $499 | 62 (1.1%) | 0 (0.0%) |
| $500 to $799 | 32 (0.6%) | 35 (1.7%) |
| $800 to $999 | 63 (1.1%) | 0 (0.0%) |
| $1,000 to $1,499 | 281 (5.1%) | 19 (0.9%) |
| $1,500 to $1,999 | 193 (3.5%) | 32 (1.6%) |
| $2,000 to $2,499 | 367 (6.7%) | 534 (26.5%) |
| $2,500 to $2,999 | 282 (5.1%) | 390 (19.4%) |
| $3,000 or more | 4,218 (76.7%) | 948 (47.1%) |
| Total | 5,498 (100.0%) | 2,013 (100.0%) |
Physical Housing Characteristics in Ladera Ranch
Housing Structures in Ladera Ranch
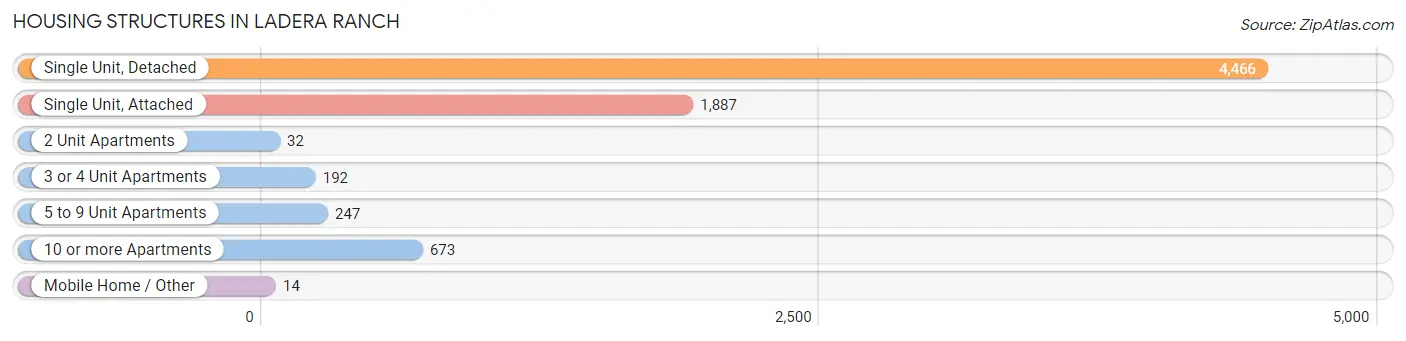
| Structure Type | # Housing Units | % Housing Units |
| Single Unit, Detached | 4,466 | 59.5% |
| Single Unit, Attached | 1,887 | 25.1% |
| 2 Unit Apartments | 32 | 0.4% |
| 3 or 4 Unit Apartments | 192 | 2.6% |
| 5 to 9 Unit Apartments | 247 | 3.3% |
| 10 or more Apartments | 673 | 9.0% |
| Mobile Home / Other | 14 | 0.2% |
| Total | 7,511 | 100.0% |
Housing Structures by Occupancy in Ladera Ranch
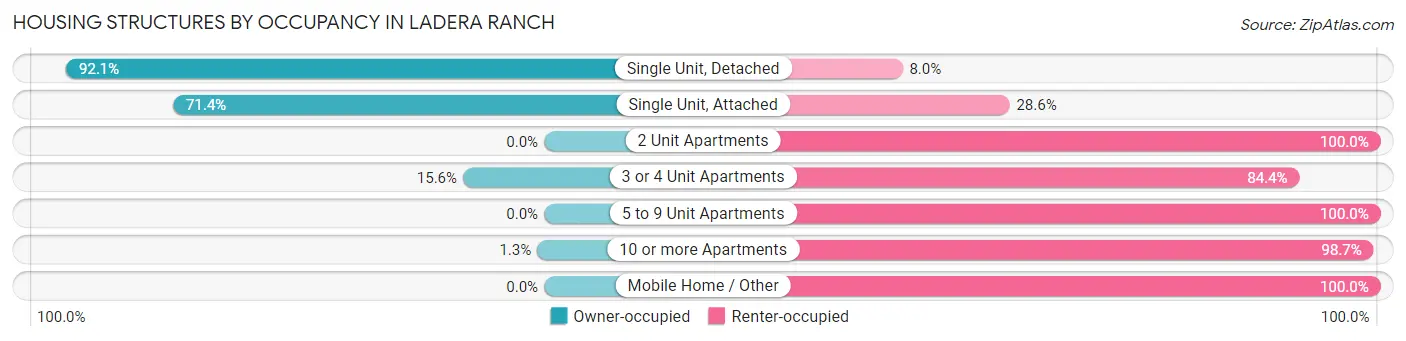
| Structure Type | Owner-occupied | Renter-occupied |
| Single Unit, Detached | 4,111 (92.0%) | 355 (8.0%) |
| Single Unit, Attached | 1,348 (71.4%) | 539 (28.6%) |
| 2 Unit Apartments | 0 (0.0%) | 32 (100.0%) |
| 3 or 4 Unit Apartments | 30 (15.6%) | 162 (84.4%) |
| 5 to 9 Unit Apartments | 0 (0.0%) | 247 (100.0%) |
| 10 or more Apartments | 9 (1.3%) | 664 (98.7%) |
| Mobile Home / Other | 0 (0.0%) | 14 (100.0%) |
| Total | 5,498 (73.2%) | 2,013 (26.8%) |
Housing Structures by Number of Rooms in Ladera Ranch
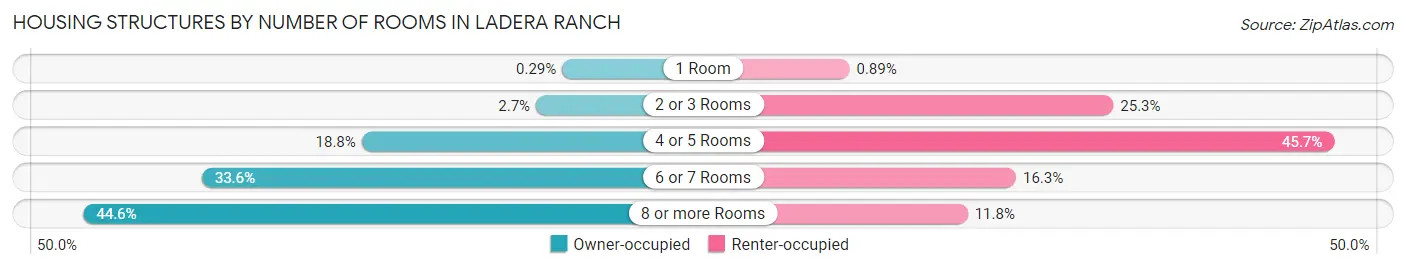
| Number of Rooms | Owner-occupied | Renter-occupied |
| 1 Room | 16 (0.3%) | 18 (0.9%) |
| 2 or 3 Rooms | 149 (2.7%) | 509 (25.3%) |
| 4 or 5 Rooms | 1,035 (18.8%) | 920 (45.7%) |
| 6 or 7 Rooms | 1,848 (33.6%) | 328 (16.3%) |
| 8 or more Rooms | 2,450 (44.6%) | 238 (11.8%) |
| Total | 5,498 (100.0%) | 2,013 (100.0%) |
Housing Structure by Heating Type in Ladera Ranch
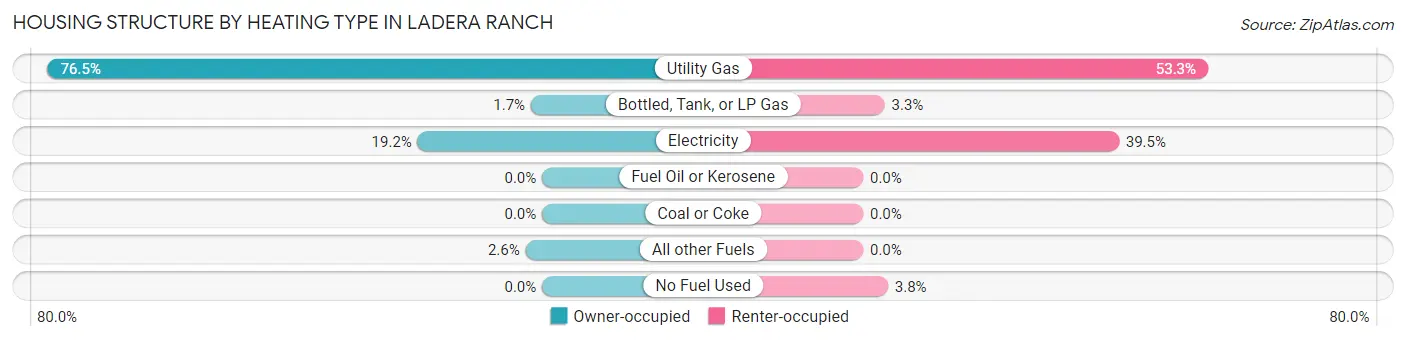
| Heating Type | Owner-occupied | Renter-occupied |
| Utility Gas | 4,204 (76.5%) | 1,073 (53.3%) |
| Bottled, Tank, or LP Gas | 95 (1.7%) | 67 (3.3%) |
| Electricity | 1,058 (19.2%) | 796 (39.5%) |
| Fuel Oil or Kerosene | 0 (0.0%) | 0 (0.0%) |
| Coal or Coke | 0 (0.0%) | 0 (0.0%) |
| All other Fuels | 141 (2.6%) | 0 (0.0%) |
| No Fuel Used | 0 (0.0%) | 77 (3.8%) |
| Total | 5,498 (100.0%) | 2,013 (100.0%) |
Household Vehicle Usage in Ladera Ranch
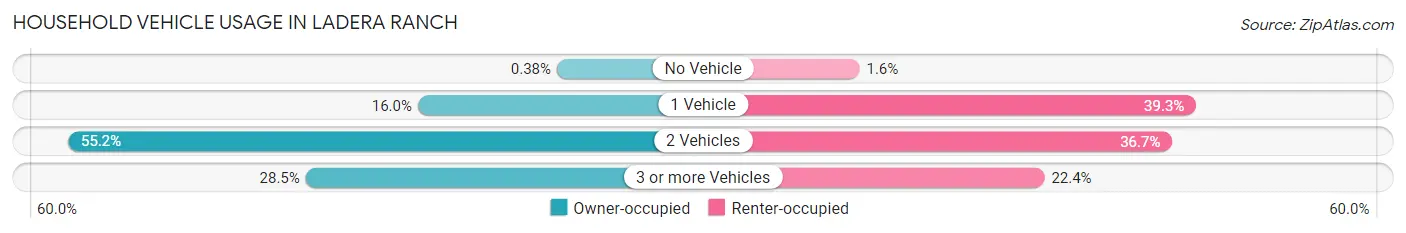
| Vehicles per Household | Owner-occupied | Renter-occupied |
| No Vehicle | 21 (0.4%) | 33 (1.6%) |
| 1 Vehicle | 877 (16.0%) | 792 (39.3%) |
| 2 Vehicles | 3,032 (55.1%) | 738 (36.7%) |
| 3 or more Vehicles | 1,568 (28.5%) | 450 (22.4%) |
| Total | 5,498 (100.0%) | 2,013 (100.0%) |
Real Estate & Mortgages in Ladera Ranch
Real Estate and Mortgage Overview in Ladera Ranch
| Characteristic | Without Mortgage | With Mortgage |
| Housing Units | 696 | 4,802 |
| Median Property Value | $740,700 | $996,500 |
| Median Household Income | $152,692 | $3,519 |
| Monthly Housing Costs | $1,399 | $4,152 |
| Real Estate Taxes | $9,183 | $0 |
Property Value by Mortgage Status in Ladera Ranch
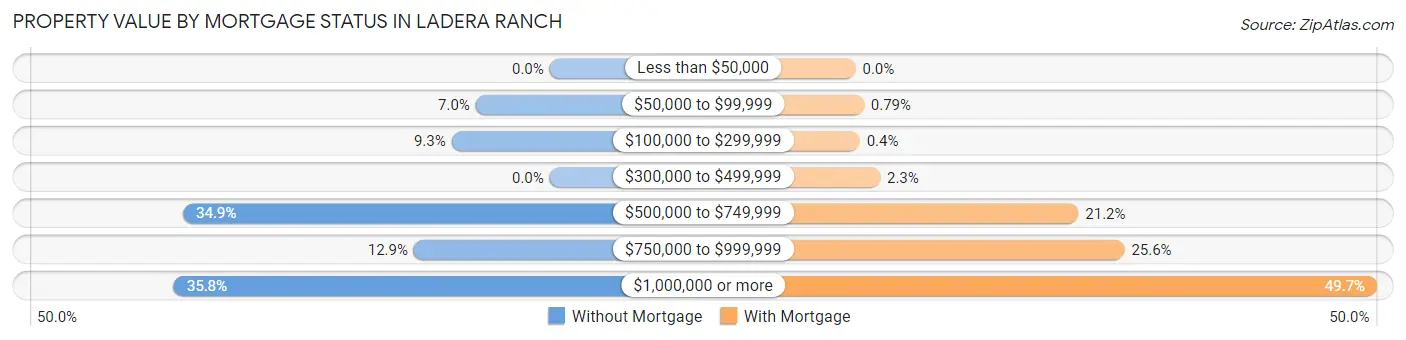
| Property Value | Without Mortgage | With Mortgage |
| Less than $50,000 | 0 (0.0%) | 0 (0.0%) |
| $50,000 to $99,999 | 49 (7.0%) | 38 (0.8%) |
| $100,000 to $299,999 | 65 (9.3%) | 19 (0.4%) |
| $300,000 to $499,999 | 0 (0.0%) | 112 (2.3%) |
| $500,000 to $749,999 | 243 (34.9%) | 1,019 (21.2%) |
| $750,000 to $999,999 | 90 (12.9%) | 1,230 (25.6%) |
| $1,000,000 or more | 249 (35.8%) | 2,384 (49.6%) |
| Total | 696 (100.0%) | 4,802 (100.0%) |
Household Income by Mortgage Status in Ladera Ranch
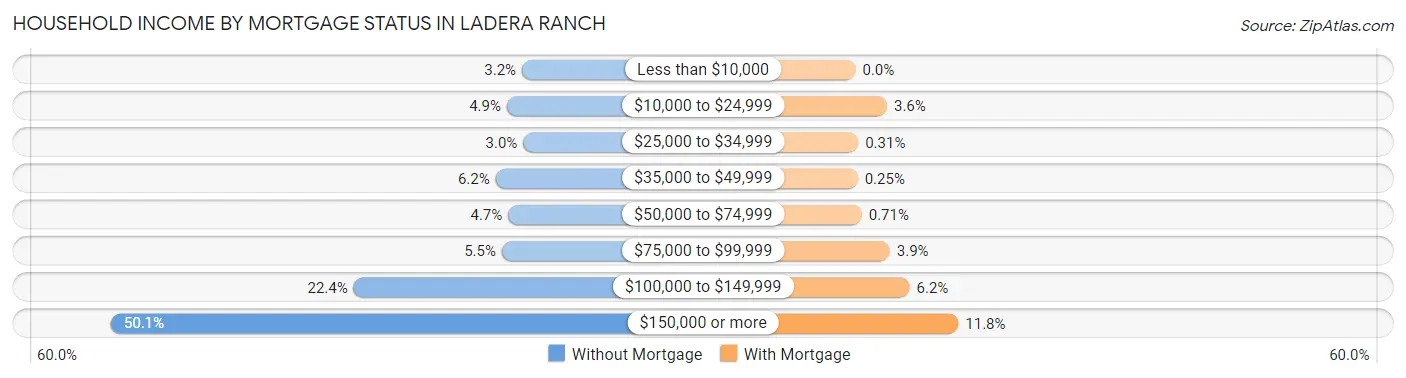
| Household Income | Without Mortgage | With Mortgage |
| Less than $10,000 | 22 (3.2%) | 0 (0.0%) |
| $10,000 to $24,999 | 34 (4.9%) | 173 (3.6%) |
| $25,000 to $34,999 | 21 (3.0%) | 15 (0.3%) |
| $35,000 to $49,999 | 43 (6.2%) | 12 (0.3%) |
| $50,000 to $74,999 | 33 (4.7%) | 34 (0.7%) |
| $75,000 to $99,999 | 38 (5.5%) | 188 (3.9%) |
| $100,000 to $149,999 | 156 (22.4%) | 297 (6.2%) |
| $150,000 or more | 349 (50.1%) | 564 (11.7%) |
| Total | 696 (100.0%) | 4,802 (100.0%) |
Property Value to Household Income Ratio in Ladera Ranch
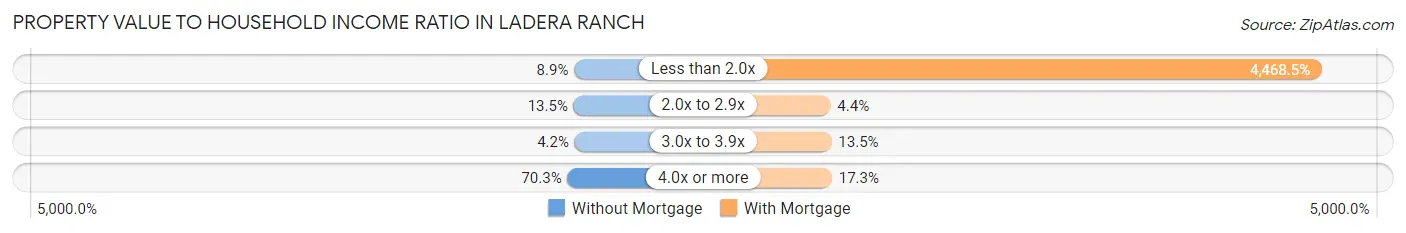
| Value-to-Income Ratio | Without Mortgage | With Mortgage |
| Less than 2.0x | 62 (8.9%) | 214,578 (4,468.5%) |
| 2.0x to 2.9x | 94 (13.5%) | 213 (4.4%) |
| 3.0x to 3.9x | 29 (4.2%) | 650 (13.5%) |
| 4.0x or more | 489 (70.3%) | 832 (17.3%) |
| Total | 696 (100.0%) | 4,802 (100.0%) |
Real Estate Taxes by Mortgage Status in Ladera Ranch
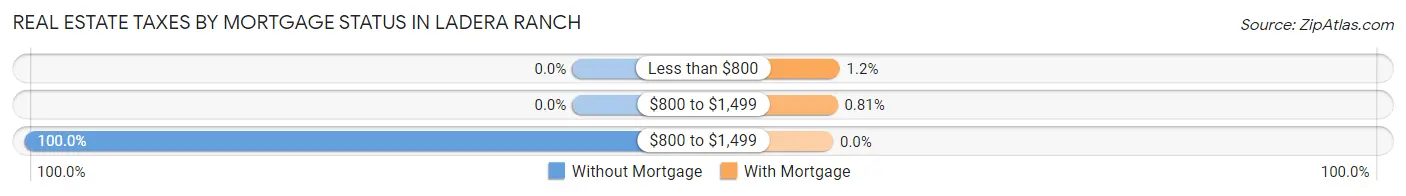
| Property Taxes | Without Mortgage | With Mortgage |
| Less than $800 | 0 (0.0%) | 58 (1.2%) |
| $800 to $1,499 | 0 (0.0%) | 39 (0.8%) |
| $800 to $1,499 | 696 (100.0%) | 0 (0.0%) |
| Total | 696 (100.0%) | 4,802 (100.0%) |
Health & Disability in Ladera Ranch
Health Insurance Coverage by Age in Ladera Ranch
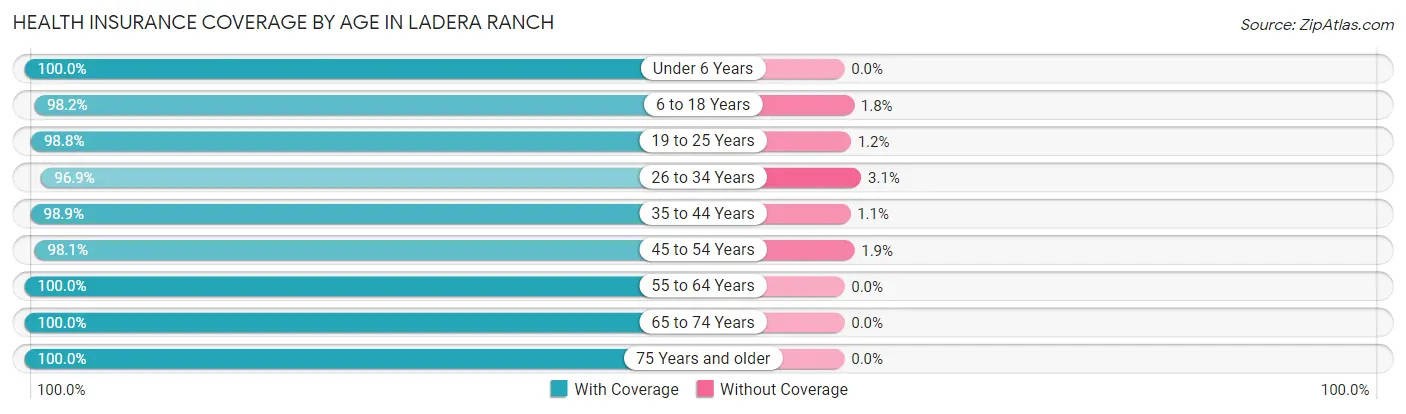
| Age Bracket | With Coverage | Without Coverage |
| Under 6 Years | 2,306 (100.0%) | 0 (0.0%) |
| 6 to 18 Years | 6,564 (98.2%) | 119 (1.8%) |
| 19 to 25 Years | 1,488 (98.8%) | 18 (1.2%) |
| 26 to 34 Years | 1,640 (96.9%) | 53 (3.1%) |
| 35 to 44 Years | 3,639 (98.9%) | 41 (1.1%) |
| 45 to 54 Years | 4,264 (98.1%) | 81 (1.9%) |
| 55 to 64 Years | 2,423 (100.0%) | 0 (0.0%) |
| 65 to 74 Years | 1,203 (100.0%) | 0 (0.0%) |
| 75 Years and older | 402 (100.0%) | 0 (0.0%) |
| Total | 23,929 (98.7%) | 312 (1.3%) |
Health Insurance Coverage by Citizenship Status in Ladera Ranch
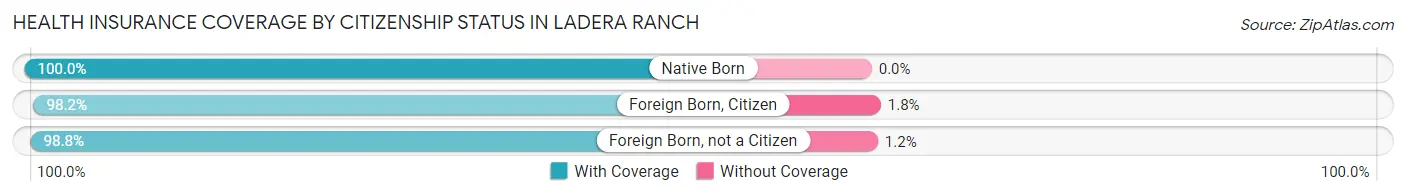
| Citizenship Status | With Coverage | Without Coverage |
| Native Born | 2,306 (100.0%) | 0 (0.0%) |
| Foreign Born, Citizen | 6,564 (98.2%) | 119 (1.8%) |
| Foreign Born, not a Citizen | 1,488 (98.8%) | 18 (1.2%) |
Health Insurance Coverage by Household Income in Ladera Ranch
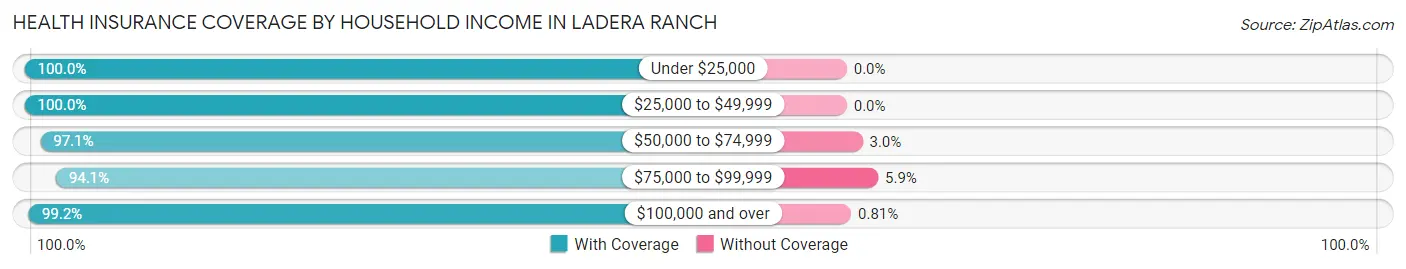
| Household Income | With Coverage | Without Coverage |
| Under $25,000 | 624 (100.0%) | 0 (0.0%) |
| $25,000 to $49,999 | 572 (100.0%) | 0 (0.0%) |
| $50,000 to $74,999 | 1,514 (97.1%) | 46 (2.9%) |
| $75,000 to $99,999 | 1,703 (94.1%) | 106 (5.9%) |
| $100,000 and over | 19,516 (99.2%) | 160 (0.8%) |
Public vs Private Health Insurance Coverage by Age in Ladera Ranch
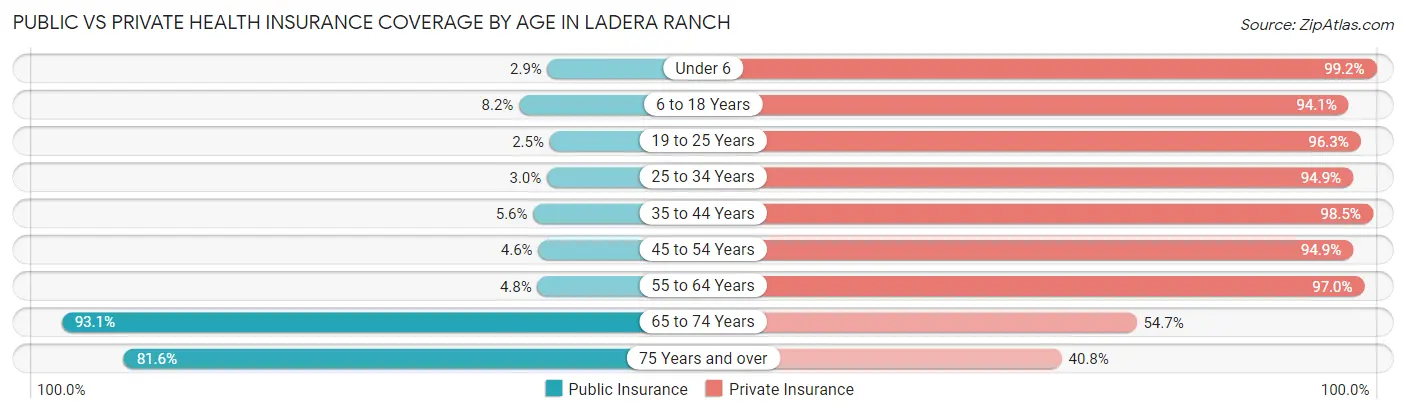
| Age Bracket | Public Insurance | Private Insurance |
| Under 6 | 67 (2.9%) | 2,288 (99.2%) |
| 6 to 18 Years | 548 (8.2%) | 6,287 (94.1%) |
| 19 to 25 Years | 38 (2.5%) | 1,450 (96.3%) |
| 25 to 34 Years | 51 (3.0%) | 1,606 (94.9%) |
| 35 to 44 Years | 205 (5.6%) | 3,626 (98.5%) |
| 45 to 54 Years | 201 (4.6%) | 4,123 (94.9%) |
| 55 to 64 Years | 116 (4.8%) | 2,350 (97.0%) |
| 65 to 74 Years | 1,120 (93.1%) | 658 (54.7%) |
| 75 Years and over | 328 (81.6%) | 164 (40.8%) |
| Total | 2,674 (11.0%) | 22,552 (93.0%) |
Disability Status by Sex by Age in Ladera Ranch
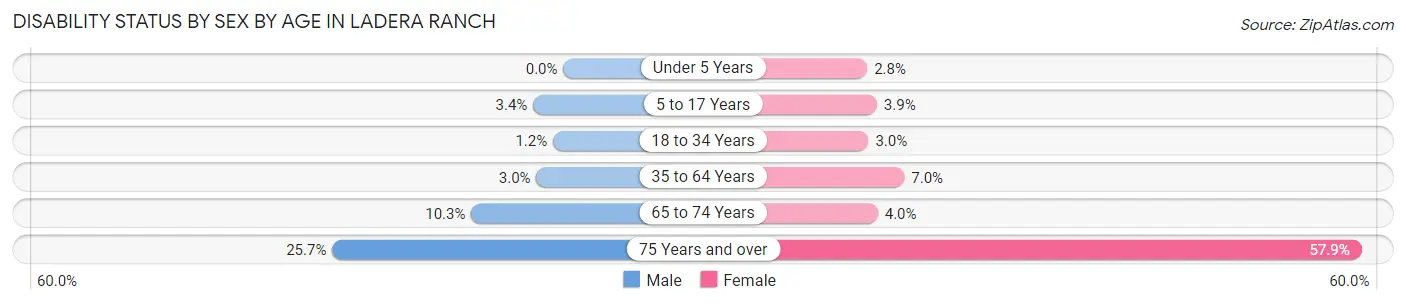
| Age Bracket | Male | Female |
| Under 5 Years | 0 (0.0%) | 28 (2.8%) |
| 5 to 17 Years | 118 (3.4%) | 125 (3.9%) |
| 18 to 34 Years | 18 (1.1%) | 58 (3.0%) |
| 35 to 64 Years | 153 (3.0%) | 373 (7.0%) |
| 65 to 74 Years | 62 (10.2%) | 24 (4.0%) |
| 75 Years and over | 35 (25.7%) | 154 (57.9%) |
Disability Class by Sex by Age in Ladera Ranch
Disability Class: Hearing Difficulty
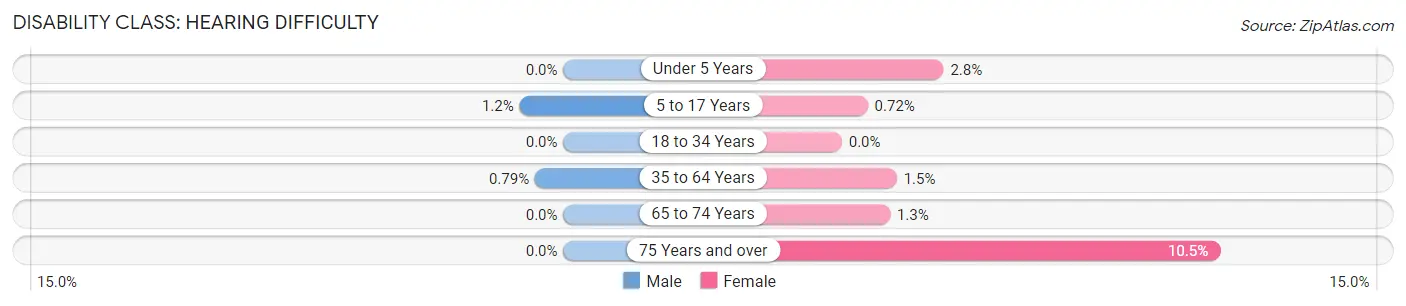
| Age Bracket | Male | Female |
| Under 5 Years | 0 (0.0%) | 28 (2.8%) |
| 5 to 17 Years | 43 (1.2%) | 23 (0.7%) |
| 18 to 34 Years | 0 (0.0%) | 0 (0.0%) |
| 35 to 64 Years | 40 (0.8%) | 82 (1.5%) |
| 65 to 74 Years | 0 (0.0%) | 8 (1.3%) |
| 75 Years and over | 0 (0.0%) | 28 (10.5%) |
Disability Class: Vision Difficulty
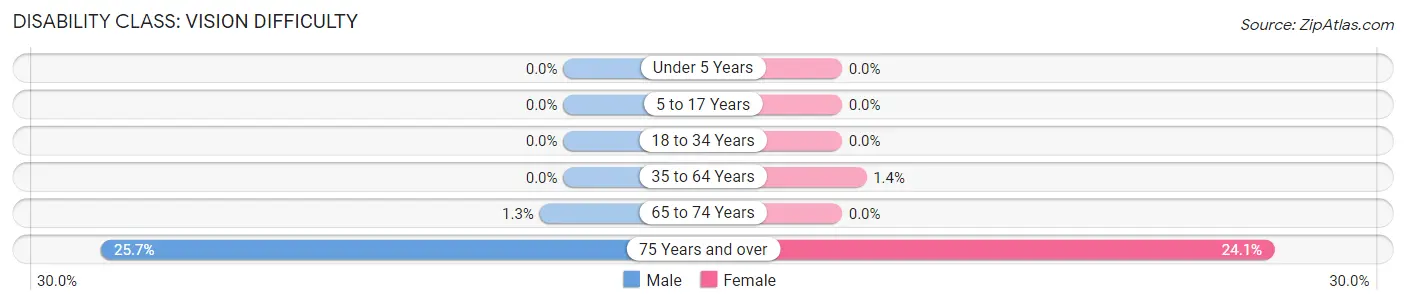
| Age Bracket | Male | Female |
| Under 5 Years | 0 (0.0%) | 0 (0.0%) |
| 5 to 17 Years | 0 (0.0%) | 0 (0.0%) |
| 18 to 34 Years | 0 (0.0%) | 0 (0.0%) |
| 35 to 64 Years | 0 (0.0%) | 73 (1.4%) |
| 65 to 74 Years | 8 (1.3%) | 0 (0.0%) |
| 75 Years and over | 35 (25.7%) | 64 (24.1%) |
Disability Class: Cognitive Difficulty
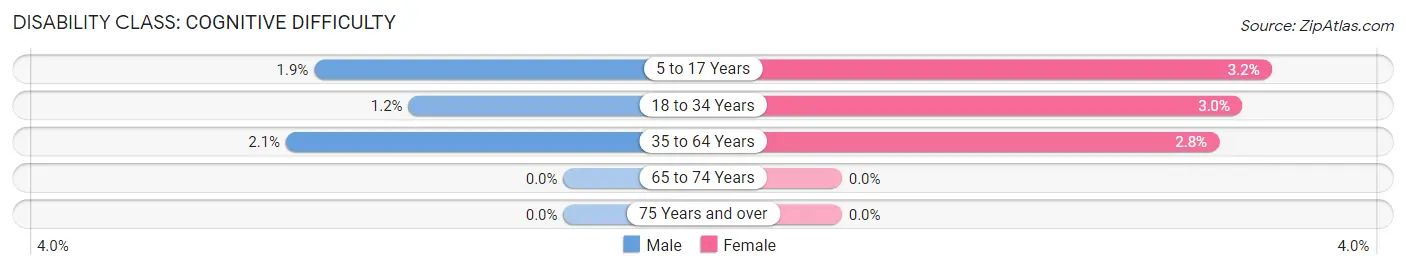
| Age Bracket | Male | Female |
| 5 to 17 Years | 65 (1.8%) | 102 (3.2%) |
| 18 to 34 Years | 18 (1.1%) | 58 (3.0%) |
| 35 to 64 Years | 105 (2.1%) | 150 (2.8%) |
| 65 to 74 Years | 0 (0.0%) | 0 (0.0%) |
| 75 Years and over | 0 (0.0%) | 0 (0.0%) |
Disability Class: Ambulatory Difficulty
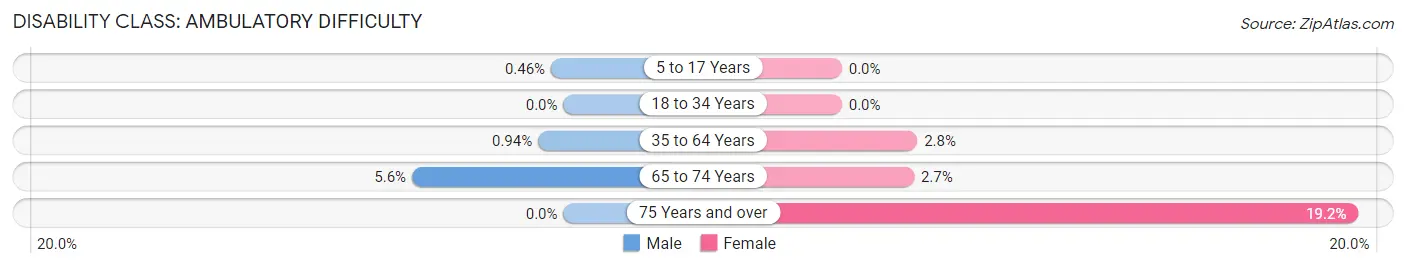
| Age Bracket | Male | Female |
| 5 to 17 Years | 16 (0.5%) | 0 (0.0%) |
| 18 to 34 Years | 0 (0.0%) | 0 (0.0%) |
| 35 to 64 Years | 48 (0.9%) | 150 (2.8%) |
| 65 to 74 Years | 34 (5.6%) | 16 (2.7%) |
| 75 Years and over | 0 (0.0%) | 51 (19.2%) |
Disability Class: Self-Care Difficulty
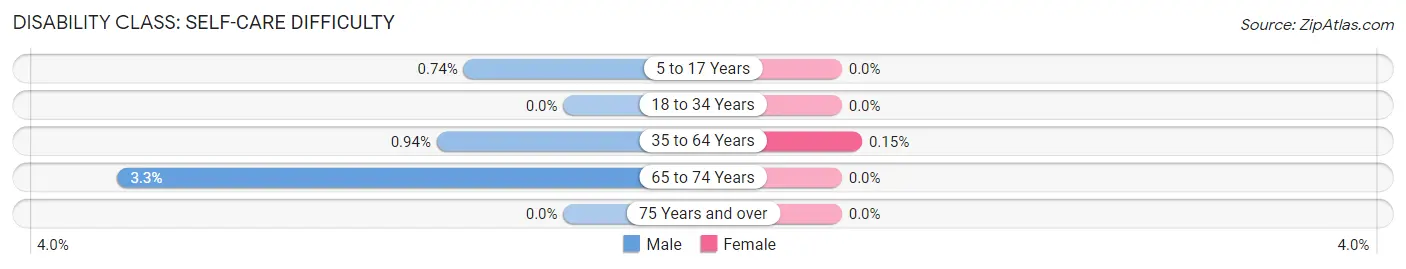
| Age Bracket | Male | Female |
| 5 to 17 Years | 26 (0.7%) | 0 (0.0%) |
| 18 to 34 Years | 0 (0.0%) | 0 (0.0%) |
| 35 to 64 Years | 48 (0.9%) | 8 (0.2%) |
| 65 to 74 Years | 20 (3.3%) | 0 (0.0%) |
| 75 Years and over | 0 (0.0%) | 0 (0.0%) |
Technology Access in Ladera Ranch
Computing Device Access in Ladera Ranch
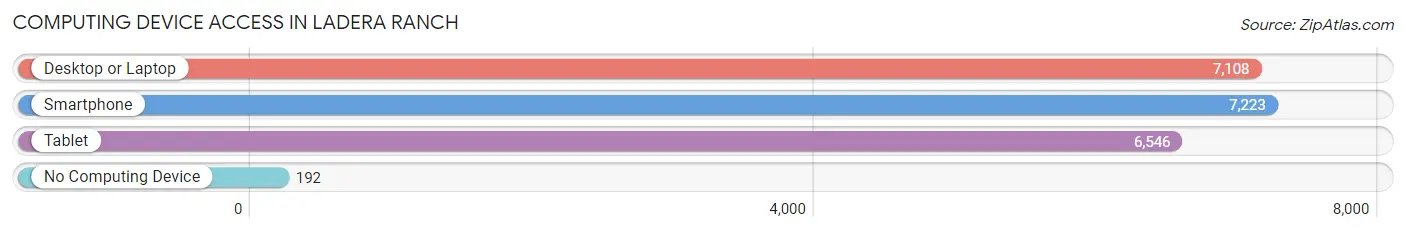
| Device Type | # Households | % Households |
| Desktop or Laptop | 7,108 | 94.6% |
| Smartphone | 7,223 | 96.2% |
| Tablet | 6,546 | 87.2% |
| No Computing Device | 192 | 2.6% |
| Total | 7,511 | 100.0% |
Internet Access in Ladera Ranch
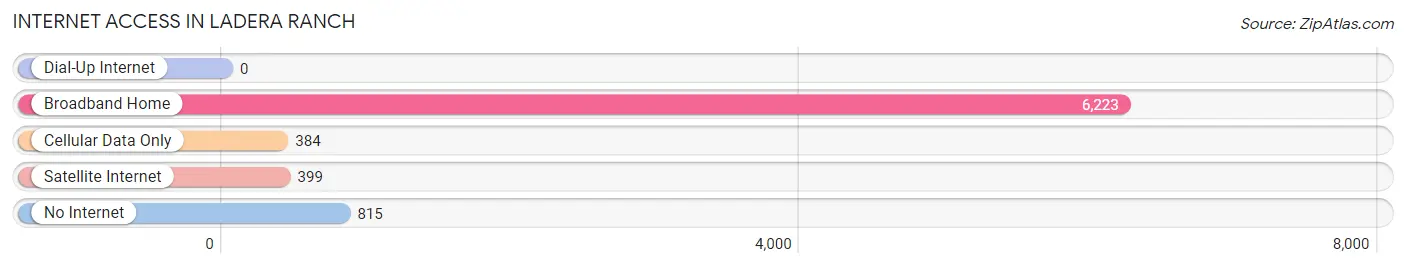
| Internet Type | # Households | % Households |
| Dial-Up Internet | 0 | 0.0% |
| Broadband Home | 6,223 | 82.9% |
| Cellular Data Only | 384 | 5.1% |
| Satellite Internet | 399 | 5.3% |
| No Internet | 815 | 10.8% |
| Total | 7,511 | 100.0% |
Ladera Ranch Summary
Ladera Ranch is a master-planned community located in south Orange County, California. It is situated between the cities of San Juan Capistrano and Mission Viejo, and is part of the Saddleback Valley. The community was developed by the Mission Viejo Company, and was first opened in 1999.
History
The area that is now Ladera Ranch was originally part of the Rancho Mission Viejo, a large Spanish land grant given to the Mission San Juan Capistrano in 1845. The land was used for cattle grazing and farming until the late 19th century, when it was purchased by the O’Neill family. The O’Neills used the land for cattle ranching and citrus farming until the late 1990s, when the Mission Viejo Company purchased the land and began developing it into a master-planned community.
The first phase of development began in 1999, and included the construction of the first homes, a community center, and a shopping center. The community was officially opened in 2000, and has since grown to include over 8,000 homes, as well as numerous parks, trails, and other amenities.
Geography
Ladera Ranch is located in south Orange County, California, between the cities of San Juan Capistrano and Mission Viejo. It is situated in the foothills of the Santa Ana Mountains, and is part of the Saddleback Valley. The community is bordered by the cities of San Juan Capistrano to the north, Mission Viejo to the east, and Rancho Santa Margarita to the south.
The community is divided into nine distinct villages, each with its own unique style and amenities. The villages are Avendale, Bridgepark, Covenant Hills, Oak Knoll, Terramor, Wycliffe, Flintridge, Terramor, and Wycliffe.
Economy
Ladera Ranch is primarily a residential community, and does not have a large commercial or industrial base. However, the community does have a number of small businesses, including restaurants, retail stores, and professional services. The community also has a number of corporate offices, including those of the Mission Viejo Company, which is the developer of the community.
Demographics
As of the 2010 census, the population of Ladera Ranch was 22,980. The racial makeup of the community was 75.3% White, 11.2% Asian, 8.2% Hispanic or Latino, and 5.3% other. The median household income was $118,890, and the median age was 36.
Ladera Ranch is a relatively affluent community, and is known for its high quality of life. The community is home to a number of parks, trails, and other amenities, and is considered to be one of the safest communities in Orange County.
Common Questions
What is Per Capita Income in Ladera Ranch?
Per Capita income in Ladera Ranch is $68,940.
What is the Median Family Income in Ladera Ranch?
Median Family Income in Ladera Ranch is $203,682.
What is the Median Household income in Ladera Ranch?
Median Household Income in Ladera Ranch is $188,299.
What is Income or Wage Gap in Ladera Ranch?
Income or Wage Gap in Ladera Ranch is 44.0%.
Women in Ladera Ranch earn 56.0 cents for every dollar earned by a man.
What is Family Income Deficit in Ladera Ranch?
Family Income Deficit in Ladera Ranch is $18,294.
Families that are below poverty line in Ladera Ranch earn $18,294 less on average than the poverty threshold level.
What is Inequality or Gini Index in Ladera Ranch?
Inequality or Gini Index in Ladera Ranch is 0.41.
What is the Total Population of Ladera Ranch?
Total Population of Ladera Ranch is 24,323.
What is the Total Male Population of Ladera Ranch?
Total Male Population of Ladera Ranch is 11,968.
What is the Total Female Population of Ladera Ranch?
Total Female Population of Ladera Ranch is 12,355.
What is the Ratio of Males per 100 Females in Ladera Ranch?
There are 96.87 Males per 100 Females in Ladera Ranch.
What is the Ratio of Females per 100 Males in Ladera Ranch?
There are 103.23 Females per 100 Males in Ladera Ranch.
What is the Median Population Age in Ladera Ranch?
Median Population Age in Ladera Ranch is 34.9 Years.
What is the Average Family Size in Ladera Ranch
Average Family Size in Ladera Ranch is 3.6 People.
What is the Average Household Size in Ladera Ranch
Average Household Size in Ladera Ranch is 3.2 People.
How Large is the Labor Force in Ladera Ranch?
There are 12,279 People in the Labor Forcein in Ladera Ranch.
What is the Percentage of People in the Labor Force in Ladera Ranch?
73.5% of People are in the Labor Force in Ladera Ranch.
What is the Unemployment Rate in Ladera Ranch?
Unemployment Rate in Ladera Ranch is 2.7%.