Cities with the Highest Percentage of Households with Income Above $200,000 in Iowa
RELATED REPORTS & OPTIONS
Household Income | $200k+
Iowa
Compare Cities
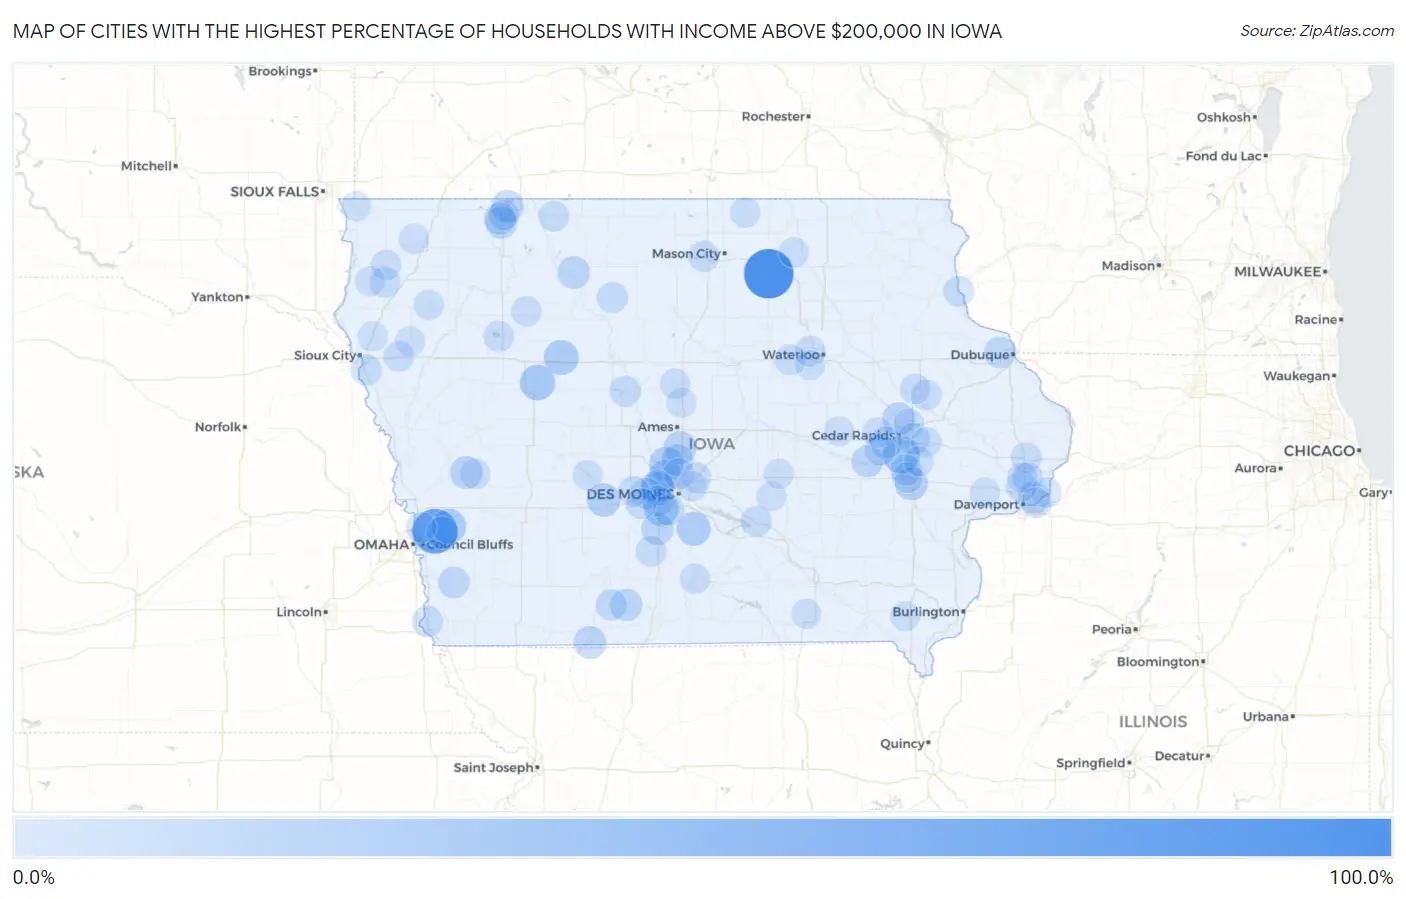
Map of Cities with the Highest Percentage of Households with Income Above $200,000 in Iowa
0.0%
100.0%
Cities with the Highest Percentage of Households with Income Above $200,000 in Iowa
| City | Households with Income > $200k | vs State | vs National | |
| 1. | Roseville | 100.0% | 7.1%(+92.9)#1 | 11.4%(+88.6)#20 |
| 2. | Plainview | 100.0% | 7.1%(+92.9)#2 | 11.4%(+88.6)#21 |
| 3. | Weston | 77.1% | 7.1%(+70.0)#3 | 11.4%(+65.7)#39 |
| 4. | Oak Hills | 57.8% | 7.1%(+50.7)#4 | 11.4%(+46.4)#233 |
| 5. | Shueyville | 39.9% | 7.1%(+32.8)#5 | 11.4%(+28.5)#844 |
| 6. | Yetter | 33.3% | 7.1%(+26.2)#6 | 11.4%(+21.9)#1,319 |
| 7. | Twin Lakes | 30.3% | 7.1%(+23.2)#7 | 11.4%(+18.9)#1,586 |
| 8. | Bentley | 30.0% | 7.1%(+22.9)#8 | 11.4%(+18.6)#1,623 |
| 9. | Cumming | 28.8% | 7.1%(+21.7)#9 | 11.4%(+17.4)#1,740 |
| 10. | Ackworth | 26.5% | 7.1%(+19.4)#10 | 11.4%(+15.1)#2,003 |
| 11. | Polk City | 25.5% | 7.1%(+18.4)#11 | 11.4%(+14.1)#2,116 |
| 12. | Diamondhead Lake | 23.6% | 7.1%(+16.5)#12 | 11.4%(+12.2)#2,386 |
| 13. | Clive | 22.9% | 7.1%(+15.8)#13 | 11.4%(+11.5)#2,490 |
| 14. | University Heights | 22.5% | 7.1%(+15.4)#14 | 11.4%(+11.1)#2,570 |
| 15. | Johnston | 21.4% | 7.1%(+14.3)#15 | 11.4%(+10.00)#2,764 |
| 16. | Huxley | 21.4% | 7.1%(+14.3)#16 | 11.4%(+10.00)#2,769 |
| 17. | Kent Estates | 20.8% | 7.1%(+13.7)#17 | 11.4%(+9.40)#2,887 |
| 18. | Robins | 20.7% | 7.1%(+13.6)#18 | 11.4%(+9.30)#2,902 |
| 19. | Panama | 20.6% | 7.1%(+13.5)#19 | 11.4%(+9.20)#2,928 |
| 20. | Redding | 20.0% | 7.1%(+12.9)#20 | 11.4%(+8.60)#3,060 |
| 21. | Rodman | 20.0% | 7.1%(+12.9)#21 | 11.4%(+8.60)#3,066 |
| 22. | Bevington | 20.0% | 7.1%(+12.9)#22 | 11.4%(+8.60)#3,067 |
| 23. | Urbandale | 19.6% | 7.1%(+12.5)#23 | 11.4%(+8.20)#3,131 |
| 24. | Sun Valley Lake | 19.1% | 7.1%(+12.0)#24 | 11.4%(+7.70)#3,257 |
| 25. | Orleans | 19.0% | 7.1%(+11.9)#25 | 11.4%(+7.60)#3,282 |
| 26. | Mcclelland | 18.4% | 7.1%(+11.3)#26 | 11.4%(+7.00)#3,425 |
| 27. | Fairfax | 18.0% | 7.1%(+10.9)#27 | 11.4%(+6.60)#3,495 |
| 28. | West Okoboji | 17.9% | 7.1%(+10.8)#28 | 11.4%(+6.50)#3,535 |
| 29. | Alleman | 17.6% | 7.1%(+10.5)#29 | 11.4%(+6.20)#3,603 |
| 30. | Wahpeton | 17.4% | 7.1%(+10.3)#30 | 11.4%(+6.00)#3,645 |
| 31. | High Amana | 17.4% | 7.1%(+10.3)#31 | 11.4%(+6.00)#3,647 |
| 32. | Bettendorf | 16.6% | 7.1%(+9.50)#32 | 11.4%(+5.20)#3,813 |
| 33. | Asbury | 16.0% | 7.1%(+8.90)#33 | 11.4%(+4.60)#3,972 |
| 34. | Malvern | 15.6% | 7.1%(+8.50)#34 | 11.4%(+4.20)#4,107 |
| 35. | Waukee | 15.3% | 7.1%(+8.20)#35 | 11.4%(+3.90)#4,186 |
| 36. | Bertram | 15.3% | 7.1%(+8.20)#36 | 11.4%(+3.90)#4,223 |
| 37. | Tingley | 14.5% | 7.1%(+7.40)#37 | 11.4%(+3.10)#4,477 |
| 38. | North Liberty | 14.2% | 7.1%(+7.10)#38 | 11.4%(+2.80)#4,578 |
| 39. | Dayton | 13.9% | 7.1%(+6.80)#39 | 11.4%(+2.50)#4,713 |
| 40. | Livermore | 13.8% | 7.1%(+6.70)#40 | 11.4%(+2.40)#4,748 |
| 41. | West Des Moines | 13.2% | 7.1%(+6.10)#41 | 11.4%(+1.80)#4,964 |
| 42. | Walford | 13.2% | 7.1%(+6.10)#42 | 11.4%(+1.80)#4,986 |
| 43. | Eldridge | 13.1% | 7.1%(+6.00)#43 | 11.4%(+1.70)#5,018 |
| 44. | Norwalk | 13.0% | 7.1%(+5.90)#44 | 11.4%(+1.60)#5,052 |
| 45. | Sergeant Bluff | 13.0% | 7.1%(+5.90)#45 | 11.4%(+1.60)#5,061 |
| 46. | Percival | 13.0% | 7.1%(+5.90)#46 | 11.4%(+1.60)#5,089 |
| 47. | Clear Lake | 12.6% | 7.1%(+5.50)#47 | 11.4%(+1.20)#5,241 |
| 48. | Truro | 12.5% | 7.1%(+5.40)#48 | 11.4%(+1.10)#5,295 |
| 49. | Swedesburg | 12.5% | 7.1%(+5.40)#49 | 11.4%(+1.10)#5,307 |
| 50. | Maurice | 12.4% | 7.1%(+5.30)#50 | 11.4%(+1.000)#5,366 |
| 51. | Pella | 12.3% | 7.1%(+5.20)#51 | 11.4%(+0.900)#5,377 |
| 52. | Adel | 12.3% | 7.1%(+5.20)#52 | 11.4%(+0.900)#5,383 |
| 53. | Van Meter | 12.2% | 7.1%(+5.10)#53 | 11.4%(+0.800)#5,439 |
| 54. | Dewitt | 12.1% | 7.1%(+5.00)#54 | 11.4%(+0.700)#5,482 |
| 55. | Clayton | 12.1% | 7.1%(+5.00)#55 | 11.4%(+0.700)#5,510 |
| 56. | Lakeside | 11.9% | 7.1%(+4.80)#56 | 11.4%(+0.500)#5,590 |
| 57. | Dike | 11.8% | 7.1%(+4.70)#57 | 11.4%(+0.400)#5,635 |
| 58. | Ankeny | 11.7% | 7.1%(+4.60)#58 | 11.4%(+0.300)#5,654 |
| 59. | Moville | 11.5% | 7.1%(+4.40)#59 | 11.4%(+0.100)#5,765 |
| 60. | Gruver | 11.5% | 7.1%(+4.40)#60 | 11.4%(+0.100)#5,787 |
| 61. | Cedar Falls | 11.4% | 7.1%(+4.30)#61 | 11.4%(=0.000)#5,790 |
| 62. | Prairieburg | 11.4% | 7.1%(+4.30)#62 | 11.4%(=0.000)#5,823 |
| 63. | Coralville | 11.2% | 7.1%(+4.10)#63 | 11.4%(-0.200)#5,869 |
| 64. | Okoboji | 11.0% | 7.1%(+3.90)#64 | 11.4%(-0.400)#5,989 |
| 65. | Sioux Center | 10.9% | 7.1%(+3.80)#65 | 11.4%(-0.500)#6,015 |
| 66. | Park View | 10.6% | 7.1%(+3.50)#66 | 11.4%(-0.800)#6,190 |
| 67. | Marion | 10.4% | 7.1%(+3.30)#67 | 11.4%(-1.000)#6,266 |
| 68. | Albert City | 10.4% | 7.1%(+3.30)#68 | 11.4%(-1.000)#6,299 |
| 69. | Crescent | 10.3% | 7.1%(+3.20)#69 | 11.4%(-1.10)#6,357 |
| 70. | Colwell | 10.3% | 7.1%(+3.20)#70 | 11.4%(-1.10)#6,377 |
| 71. | Matlock | 10.2% | 7.1%(+3.10)#71 | 11.4%(-1.20)#6,428 |
| 72. | Atkins | 10.1% | 7.1%(+3.00)#72 | 11.4%(-1.30)#6,469 |
| 73. | Jewell Junction | 10.1% | 7.1%(+3.00)#73 | 11.4%(-1.30)#6,474 |
| 74. | Coggon | 10.1% | 7.1%(+3.00)#74 | 11.4%(-1.30)#6,478 |
| 75. | Long Grove | 10.0% | 7.1%(+2.90)#75 | 11.4%(-1.40)#6,522 |
| 76. | Westphalia | 10.0% | 7.1%(+2.90)#76 | 11.4%(-1.40)#6,538 |
| 77. | Mount Vernon | 9.8% | 7.1%(+2.70)#77 | 11.4%(-1.60)#6,644 |
| 78. | Carpenter | 9.8% | 7.1%(+2.70)#78 | 11.4%(-1.60)#6,693 |
| 79. | Bondurant | 9.7% | 7.1%(+2.60)#79 | 11.4%(-1.70)#6,712 |
| 80. | Le Claire | 9.7% | 7.1%(+2.60)#80 | 11.4%(-1.70)#6,717 |
| 81. | Riverdale | 9.7% | 7.1%(+2.60)#81 | 11.4%(-1.70)#6,745 |
| 82. | Marcus | 9.6% | 7.1%(+2.50)#82 | 11.4%(-1.80)#6,790 |
| 83. | Lucas | 9.5% | 7.1%(+2.40)#83 | 11.4%(-1.90)#6,884 |
| 84. | Durant | 9.2% | 7.1%(+2.10)#84 | 11.4%(-2.20)#7,062 |
| 85. | Ireton | 9.2% | 7.1%(+2.10)#85 | 11.4%(-2.20)#7,076 |
| 86. | Sandusky | 9.1% | 7.1%(+2.00)#86 | 11.4%(-2.30)#7,149 |
| 87. | Houghton | 9.1% | 7.1%(+2.00)#87 | 11.4%(-2.30)#7,158 |
| 88. | Kingsley | 9.0% | 7.1%(+1.90)#88 | 11.4%(-2.40)#7,194 |
| 89. | Fairport | 9.0% | 7.1%(+1.90)#89 | 11.4%(-2.40)#7,215 |
| 90. | Altoona | 8.9% | 7.1%(+1.80)#90 | 11.4%(-2.50)#7,231 |
| 91. | Keystone | 8.9% | 7.1%(+1.80)#91 | 11.4%(-2.50)#7,262 |
| 92. | Lynnville | 8.9% | 7.1%(+1.80)#92 | 11.4%(-2.50)#7,269 |
| 93. | Grinnell | 8.8% | 7.1%(+1.70)#93 | 11.4%(-2.60)#7,300 |
| 94. | Story City | 8.8% | 7.1%(+1.70)#94 | 11.4%(-2.60)#7,312 |
| 95. | Hudson | 8.8% | 7.1%(+1.70)#95 | 11.4%(-2.60)#7,316 |
| 96. | Larchwood | 8.8% | 7.1%(+1.70)#96 | 11.4%(-2.60)#7,327 |
| 97. | Hinton | 8.8% | 7.1%(+1.70)#97 | 11.4%(-2.60)#7,329 |
| 98. | Drakesville | 8.8% | 7.1%(+1.70)#98 | 11.4%(-2.60)#7,347 |
| 99. | Solon | 8.7% | 7.1%(+1.60)#99 | 11.4%(-2.70)#7,388 |
| 100. | Lake Panorama | 8.7% | 7.1%(+1.60)#100 | 11.4%(-2.70)#7,403 |
Common Questions
What are the Top 10 Cities with the Highest Percentage of Households with Income Above $200,000 in Iowa?
Top 10 Cities with the Highest Percentage of Households with Income Above $200,000 in Iowa are:
#1
100.0%
#2
77.1%
#3
39.9%
#4
33.3%
#5
30.3%
#6
30.0%
#7
28.8%
#8
26.5%
#9
25.5%
#10
23.6%
What city has the Highest Percentage of Households with Income Above $200,000 in Iowa?
Roseville has the Highest Percentage of Households with Income Above $200,000 in Iowa with 100.0%.
What is the Percentage of Households with Income Above $200,000 in the State of Iowa?
Percentage of Households with Income Above $200,000 in Iowa is 7.1%.
What is the Percentage of Households with Income Above $200,000 in the United States?
Percentage of Households with Income Above $200,000 in the United States is 11.4%.