Cities with the Highest Percentage of Households with Income Above $200,000 in North Dakota
RELATED REPORTS & OPTIONS
Household Income | $200k+
North Dakota
Compare Cities
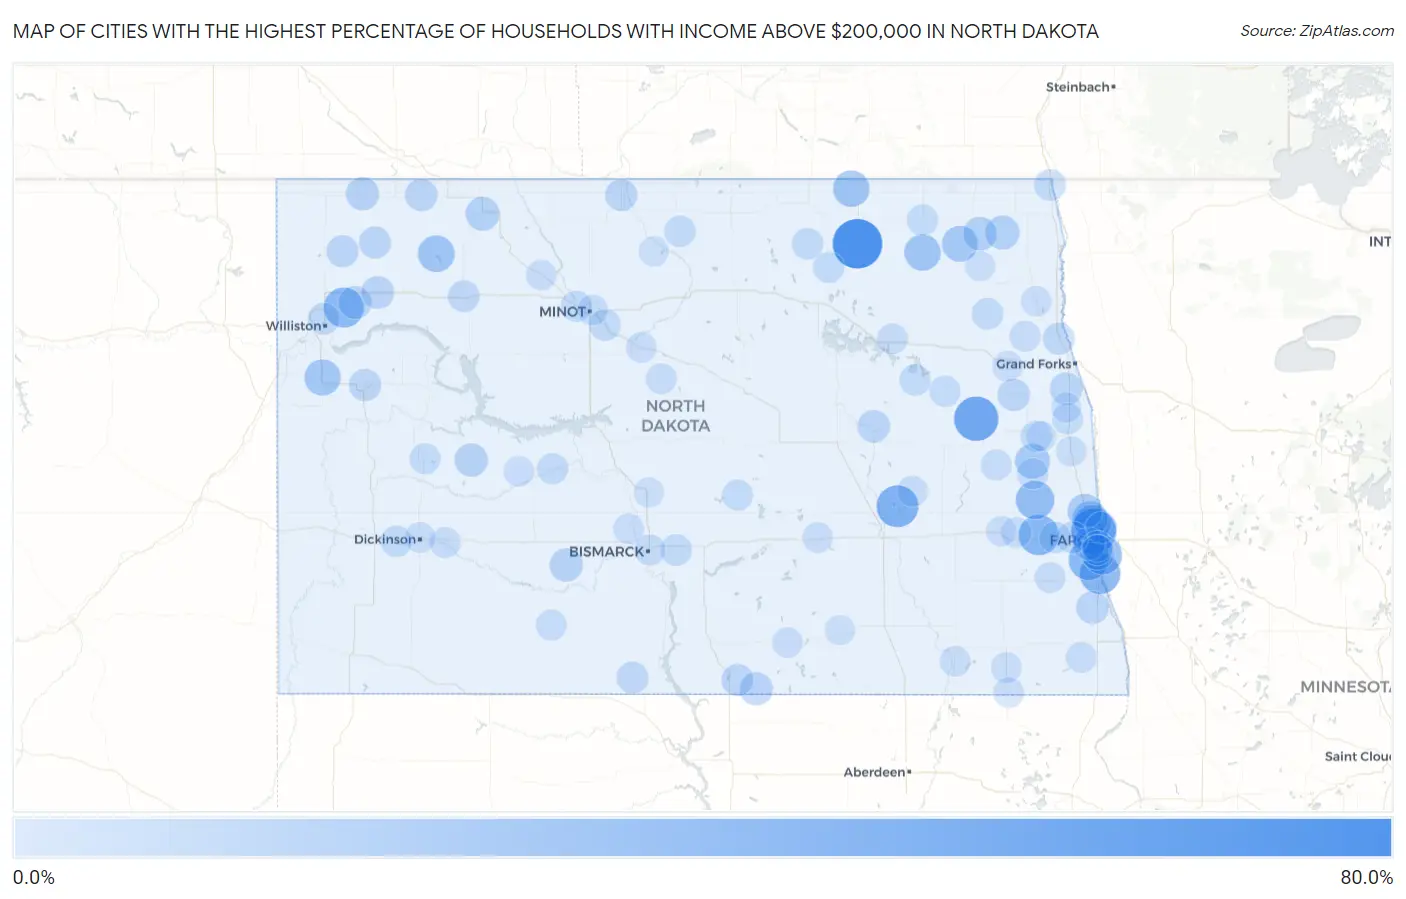
Map of Cities with the Highest Percentage of Households with Income Above $200,000 in North Dakota
0.0%
80.0%
Cities with the Highest Percentage of Households with Income Above $200,000 in North Dakota
| City | Households with Income > $200k | vs State | vs National | |
| 1. | Calio | 66.7% | 8.4%(+58.3)#1 | 11.4%(+55.3)#101 |
| 2. | Reile S Acres | 52.2% | 8.4%(+43.8)#2 | 11.4%(+40.8)#382 |
| 3. | Sharon | 50.0% | 8.4%(+41.6)#3 | 11.4%(+38.6)#452 |
| 4. | Spiritwood Lake | 41.9% | 8.4%(+33.5)#4 | 11.4%(+30.5)#742 |
| 5. | Oxbow | 37.9% | 8.4%(+29.5)#5 | 11.4%(+26.5)#969 |
| 6. | Wheatland | 37.5% | 8.4%(+29.1)#6 | 11.4%(+26.1)#986 |
| 7. | Horace | 36.5% | 8.4%(+28.1)#7 | 11.4%(+25.1)#1,046 |
| 8. | Springbrook | 36.4% | 8.4%(+28.0)#8 | 11.4%(+25.0)#1,056 |
| 9. | Briarwood | 33.3% | 8.4%(+24.9)#9 | 11.4%(+21.9)#1,315 |
| 10. | Erie | 31.3% | 8.4%(+22.9)#10 | 11.4%(+19.9)#1,497 |
| 11. | Harwood | 27.4% | 8.4%(+19.0)#11 | 11.4%(+16.0)#1,884 |
| 12. | Powers Lake | 25.9% | 8.4%(+17.5)#12 | 11.4%(+14.5)#2,071 |
| 13. | Nekoma | 25.0% | 8.4%(+16.6)#14 | 11.4%(+13.6)#2,176 |
| 14. | Sarles | 25.0% | 8.4%(+16.6)#15 | 11.4%(+13.6)#2,177 |
| 15. | Alexander | 24.4% | 8.4%(+16.0)#16 | 11.4%(+13.0)#2,253 |
| 16. | Milton | 23.5% | 8.4%(+15.1)#17 | 11.4%(+12.1)#2,400 |
| 17. | Brooktree Park | 21.6% | 8.4%(+13.2)#18 | 11.4%(+10.2)#2,742 |
| 18. | Clifford | 20.8% | 8.4%(+12.4)#19 | 11.4%(+9.40)#2,894 |
| 19. | Argusville | 19.7% | 8.4%(+11.3)#20 | 11.4%(+8.30)#3,128 |
| 20. | Frontier | 19.4% | 8.4%(+11.0)#21 | 11.4%(+8.00)#3,184 |
| 21. | Canton City Hensel | 17.6% | 8.4%(+9.20)#22 | 11.4%(+6.20)#3,607 |
| 22. | Bowbells | 17.3% | 8.4%(+8.90)#23 | 11.4%(+5.90)#3,665 |
| 23. | Mountain | 16.7% | 8.4%(+8.30)#24 | 11.4%(+5.30)#3,799 |
| 24. | Halliday | 15.6% | 8.4%(+7.20)#25 | 11.4%(+4.20)#4,112 |
| 25. | Almont | 15.5% | 8.4%(+7.10)#26 | 11.4%(+4.10)#4,141 |
| 26. | Crosby | 15.1% | 8.4%(+6.70)#27 | 11.4%(+3.70)#4,275 |
| 27. | Zeeland | 14.5% | 8.4%(+6.10)#28 | 11.4%(+3.10)#4,478 |
| 28. | Epping | 14.3% | 8.4%(+5.90)#29 | 11.4%(+2.90)#4,565 |
| 29. | Ray | 13.8% | 8.4%(+5.40)#30 | 11.4%(+2.40)#4,741 |
| 30. | West Fargo | 13.7% | 8.4%(+5.30)#31 | 11.4%(+2.30)#4,766 |
| 31. | Colfax | 13.5% | 8.4%(+5.10)#32 | 11.4%(+2.10)#4,882 |
| 32. | Thompson | 13.3% | 8.4%(+4.90)#33 | 11.4%(+1.90)#4,944 |
| 33. | Grace City | 13.3% | 8.4%(+4.90)#34 | 11.4%(+1.90)#4,959 |
| 34. | Columbus | 12.8% | 8.4%(+4.40)#35 | 11.4%(+1.40)#5,185 |
| 35. | Watford City | 12.3% | 8.4%(+3.90)#36 | 11.4%(+0.900)#5,384 |
| 36. | Northwood | 12.2% | 8.4%(+3.80)#37 | 11.4%(+0.800)#5,447 |
| 37. | Alamo | 11.8% | 8.4%(+3.40)#38 | 11.4%(+0.400)#5,649 |
| 38. | Westhope | 11.7% | 8.4%(+3.30)#39 | 11.4%(+0.300)#5,690 |
| 39. | Wildrose | 11.7% | 8.4%(+3.30)#40 | 11.4%(+0.300)#5,696 |
| 40. | Hague | 11.6% | 8.4%(+3.20)#41 | 11.4%(+0.200)#5,736 |
| 41. | Selfridge | 11.4% | 8.4%(+3.00)#42 | 11.4%(=0.000)#5,822 |
| 42. | Manvel | 11.3% | 8.4%(+2.90)#43 | 11.4%(-0.100)#5,858 |
| 43. | Stanley | 10.8% | 8.4%(+2.40)#44 | 11.4%(-0.600)#6,086 |
| 44. | Williston | 10.7% | 8.4%(+2.30)#45 | 11.4%(-0.700)#6,111 |
| 45. | Mapleton | 10.6% | 8.4%(+2.20)#46 | 11.4%(-0.800)#6,196 |
| 46. | Pembina | 10.5% | 8.4%(+2.10)#47 | 11.4%(-0.900)#6,253 |
| 47. | Logan | 10.3% | 8.4%(+1.90)#48 | 11.4%(-1.10)#6,370 |
| 48. | Menoken | 10.3% | 8.4%(+1.90)#49 | 11.4%(-1.10)#6,376 |
| 49. | Bisbee | 10.0% | 8.4%(+1.60)#50 | 11.4%(-1.40)#6,543 |
| 50. | Gardena | 10.0% | 8.4%(+1.60)#51 | 11.4%(-1.40)#6,547 |
| 51. | Casselton | 9.9% | 8.4%(+1.50)#52 | 11.4%(-1.50)#6,583 |
| 52. | South Heart | 9.9% | 8.4%(+1.50)#53 | 11.4%(-1.50)#6,601 |
| 53. | Fordville | 9.9% | 8.4%(+1.50)#54 | 11.4%(-1.50)#6,607 |
| 54. | Portland | 9.6% | 8.4%(+1.20)#55 | 11.4%(-1.80)#6,800 |
| 55. | Tolna | 9.5% | 8.4%(+1.10)#56 | 11.4%(-1.90)#6,882 |
| 56. | Hazen | 9.2% | 8.4%(+0.800)#57 | 11.4%(-2.20)#7,057 |
| 57. | Langdon | 9.2% | 8.4%(+0.800)#58 | 11.4%(-2.20)#7,064 |
| 58. | Buxton | 9.2% | 8.4%(+0.800)#59 | 11.4%(-2.20)#7,080 |
| 59. | Mcville | 9.2% | 8.4%(+0.800)#60 | 11.4%(-2.20)#7,082 |
| 60. | North River | 9.1% | 8.4%(+0.700)#61 | 11.4%(-2.30)#7,162 |
| 61. | Galesburg | 8.8% | 8.4%(+0.400)#62 | 11.4%(-2.60)#7,352 |
| 62. | Tuttle | 8.8% | 8.4%(+0.400)#63 | 11.4%(-2.60)#7,353 |
| 63. | Burlington | 8.7% | 8.4%(+0.300)#64 | 11.4%(-2.70)#7,398 |
| 64. | Cando | 8.6% | 8.4%(+0.200)#65 | 11.4%(-2.80)#7,468 |
| 65. | Killdeer | 8.6% | 8.4%(+0.200)#66 | 11.4%(-2.80)#7,474 |
| 66. | Hope | 8.5% | 8.4%(+0.100)#67 | 11.4%(-2.90)#7,565 |
| 67. | Bismarck | 8.3% | 8.4%(-0.100)#68 | 11.4%(-3.10)#7,654 |
| 68. | Trenton | 8.3% | 8.4%(-0.100)#69 | 11.4%(-3.10)#7,706 |
| 69. | Mantador | 8.3% | 8.4%(-0.100)#70 | 11.4%(-3.10)#7,733 |
| 70. | Leith | 8.3% | 8.4%(-0.100)#71 | 11.4%(-3.10)#7,734 |
| 71. | Gilby | 8.2% | 8.4%(-0.200)#72 | 11.4%(-3.20)#7,802 |
| 72. | Gladstone | 8.1% | 8.4%(-0.300)#73 | 11.4%(-3.30)#7,892 |
| 73. | Butte | 8.1% | 8.4%(-0.300)#74 | 11.4%(-3.30)#7,900 |
| 74. | Fargo | 8.0% | 8.4%(-0.400)#75 | 11.4%(-3.40)#7,902 |
| 75. | Leonard | 8.0% | 8.4%(-0.400)#76 | 11.4%(-3.40)#7,976 |
| 76. | Wimbledon | 8.0% | 8.4%(-0.400)#77 | 11.4%(-3.40)#7,978 |
| 77. | Crary | 7.9% | 8.4%(-0.500)#78 | 11.4%(-3.50)#8,055 |
| 78. | Minot | 7.6% | 8.4%(-0.800)#79 | 11.4%(-3.80)#8,235 |
| 79. | Dickinson | 7.5% | 8.4%(-0.900)#80 | 11.4%(-3.90)#8,322 |
| 80. | Forman | 7.5% | 8.4%(-0.900)#81 | 11.4%(-3.90)#8,379 |
| 81. | Harmon | 7.5% | 8.4%(-0.900)#82 | 11.4%(-3.90)#8,395 |
| 82. | Oakes | 7.4% | 8.4%(-1.000)#83 | 11.4%(-4.00)#8,445 |
| 83. | Medina | 7.4% | 8.4%(-1.000)#84 | 11.4%(-4.00)#8,493 |
| 84. | Buffalo | 7.4% | 8.4%(-1.000)#85 | 11.4%(-4.00)#8,501 |
| 85. | Voltaire | 7.4% | 8.4%(-1.000)#86 | 11.4%(-4.00)#8,505 |
| 86. | Minto | 7.1% | 8.4%(-1.30)#87 | 11.4%(-4.30)#8,738 |
| 87. | Carpio | 7.1% | 8.4%(-1.30)#88 | 11.4%(-4.30)#8,752 |
| 88. | Havana | 7.1% | 8.4%(-1.30)#89 | 11.4%(-4.30)#8,760 |
| 89. | Larimore | 7.0% | 8.4%(-1.40)#90 | 11.4%(-4.40)#8,820 |
| 90. | Tower City | 6.9% | 8.4%(-1.50)#91 | 11.4%(-4.50)#8,953 |
| 91. | Zap | 6.9% | 8.4%(-1.50)#92 | 11.4%(-4.50)#8,962 |
| 92. | Wishek | 6.7% | 8.4%(-1.70)#93 | 11.4%(-4.70)#9,168 |
| 93. | Prairie Rose | 6.7% | 8.4%(-1.70)#94 | 11.4%(-4.70)#9,210 |
| 94. | Hillsboro | 6.6% | 8.4%(-1.80)#95 | 11.4%(-4.80)#9,279 |
| 95. | Edinburg | 6.5% | 8.4%(-1.90)#96 | 11.4%(-4.90)#9,416 |
| 96. | Wilton | 6.4% | 8.4%(-2.00)#97 | 11.4%(-5.00)#9,505 |
| 97. | Upham | 6.3% | 8.4%(-2.10)#98 | 11.4%(-5.10)#9,655 |
| 98. | Fredonia | 6.3% | 8.4%(-2.10)#99 | 11.4%(-5.10)#9,671 |
| 99. | Mayville | 6.1% | 8.4%(-2.30)#100 | 11.4%(-5.30)#9,839 |
| 100. | Reynolds | 6.0% | 8.4%(-2.40)#101 | 11.4%(-5.40)#10,014 |
Common Questions
What are the Top 10 Cities with the Highest Percentage of Households with Income Above $200,000 in North Dakota?
Top 10 Cities with the Highest Percentage of Households with Income Above $200,000 in North Dakota are:
#1
66.7%
#2
52.2%
#3
50.0%
#4
41.9%
#5
37.9%
#6
37.5%
#7
36.5%
#8
36.4%
#9
33.3%
#10
31.3%
What city has the Highest Percentage of Households with Income Above $200,000 in North Dakota?
Calio has the Highest Percentage of Households with Income Above $200,000 in North Dakota with 66.7%.
What is the Percentage of Households with Income Above $200,000 in the State of North Dakota?
Percentage of Households with Income Above $200,000 in North Dakota is 8.4%.
What is the Percentage of Households with Income Above $200,000 in the United States?
Percentage of Households with Income Above $200,000 in the United States is 11.4%.