Cities with the Highest Percentage of Households with Income Above $200,000 in Arkansas
RELATED REPORTS & OPTIONS
Household Income | $200k+
Arkansas
Compare Cities
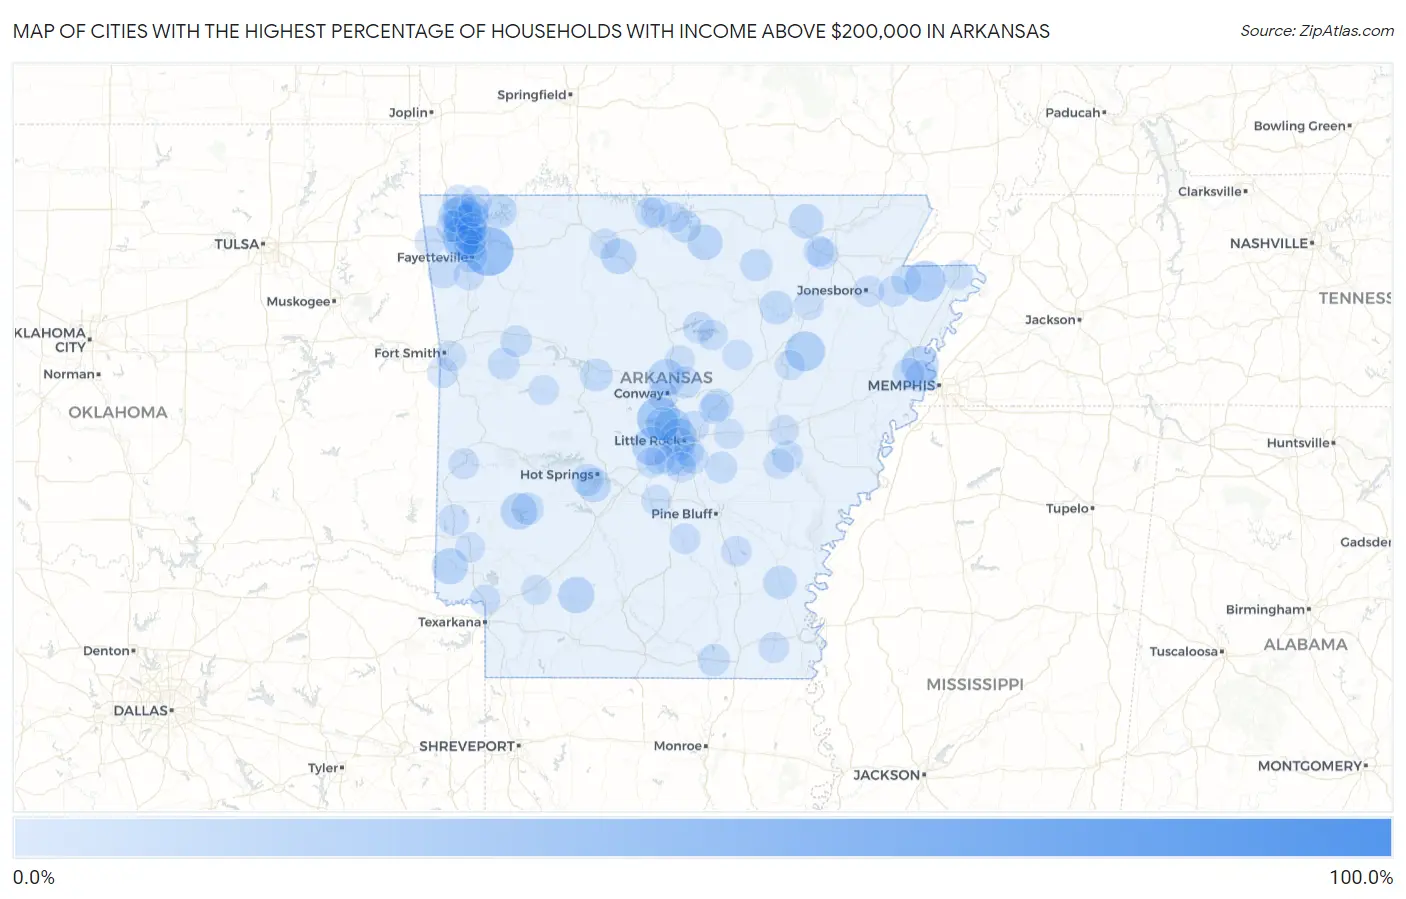
Map of Cities with the Highest Percentage of Households with Income Above $200,000 in Arkansas
0.0%
100.0%
Cities with the Highest Percentage of Households with Income Above $200,000 in Arkansas
| City | Households with Income > $200k | vs State | vs National | |
| 1. | Alleene | 100.0% | 5.6%(+94.4)#1 | 11.4%(+88.6)#6 |
| 2. | Goshen | 38.8% | 5.6%(+33.2)#2 | 11.4%(+27.4)#910 |
| 3. | Hattieville | 36.9% | 5.6%(+31.3)#3 | 11.4%(+25.5)#1,033 |
| 4. | Roland | 28.4% | 5.6%(+22.8)#4 | 11.4%(+17.0)#1,788 |
| 5. | Cave Springs | 27.1% | 5.6%(+21.5)#5 | 11.4%(+15.7)#1,924 |
| 6. | Manila | 23.7% | 5.6%(+18.1)#6 | 11.4%(+12.3)#2,364 |
| 7. | Newhope | 22.5% | 5.6%(+16.9)#7 | 11.4%(+11.1)#2,575 |
| 8. | Elm Springs | 22.0% | 5.6%(+16.4)#8 | 11.4%(+10.6)#2,662 |
| 9. | Tupelo | 21.7% | 5.6%(+16.1)#9 | 11.4%(+10.3)#2,714 |
| 10. | Bentonville | 20.3% | 5.6%(+14.7)#10 | 11.4%(+8.90)#2,968 |
| 11. | Avilla | 19.4% | 5.6%(+13.8)#11 | 11.4%(+8.00)#3,179 |
| 12. | Clarkedale | 18.0% | 5.6%(+12.4)#12 | 11.4%(+6.60)#3,501 |
| 13. | Wooster | 16.5% | 5.6%(+10.9)#13 | 11.4%(+5.10)#3,871 |
| 14. | Daisy | 15.9% | 5.6%(+10.3)#14 | 11.4%(+4.50)#4,018 |
| 15. | Maumelle | 15.6% | 5.6%(+10.00)#15 | 11.4%(+4.20)#4,088 |
| 16. | Cale | 15.6% | 5.6%(+10.00)#16 | 11.4%(+4.20)#4,114 |
| 17. | Winthrop | 15.4% | 5.6%(+9.80)#17 | 11.4%(+4.00)#4,175 |
| 18. | Cammack Village | 14.6% | 5.6%(+9.00)#18 | 11.4%(+3.20)#4,439 |
| 19. | Pindall | 14.5% | 5.6%(+8.90)#19 | 11.4%(+3.10)#4,475 |
| 20. | Wesley | 13.7% | 5.6%(+8.10)#20 | 11.4%(+2.30)#4,804 |
| 21. | Tontitown | 13.6% | 5.6%(+8.00)#21 | 11.4%(+2.20)#4,821 |
| 22. | Pineville | 13.4% | 5.6%(+7.80)#22 | 11.4%(+2.00)#4,916 |
| 23. | Centerton | 13.0% | 5.6%(+7.40)#23 | 11.4%(+1.60)#5,051 |
| 24. | Rogers | 12.6% | 5.6%(+7.00)#24 | 11.4%(+1.20)#5,229 |
| 25. | Ravenden Springs | 12.6% | 5.6%(+7.00)#25 | 11.4%(+1.20)#5,263 |
| 26. | Aplin | 12.5% | 5.6%(+6.90)#26 | 11.4%(+1.10)#5,302 |
| 27. | Lake Hamilton | 12.2% | 5.6%(+6.60)#27 | 11.4%(+0.800)#5,432 |
| 28. | Lost Bridge Village | 11.1% | 5.6%(+5.50)#28 | 11.4%(-0.300)#5,939 |
| 29. | Magness | 11.1% | 5.6%(+5.50)#29 | 11.4%(-0.300)#5,946 |
| 30. | Natural Steps | 10.7% | 5.6%(+5.10)#30 | 11.4%(-0.700)#6,147 |
| 31. | Tillar | 10.7% | 5.6%(+5.10)#31 | 11.4%(-0.700)#6,151 |
| 32. | Little Rock | 9.9% | 5.6%(+4.30)#32 | 11.4%(-1.50)#6,549 |
| 33. | Pottsville | 9.7% | 5.6%(+4.10)#33 | 11.4%(-1.70)#6,723 |
| 34. | Johnson | 9.4% | 5.6%(+3.80)#34 | 11.4%(-2.00)#6,920 |
| 35. | Austin | 9.3% | 5.6%(+3.70)#35 | 11.4%(-2.10)#6,994 |
| 36. | Bella Vista | 9.0% | 5.6%(+3.40)#36 | 11.4%(-2.40)#7,170 |
| 37. | Kirby | 9.0% | 5.6%(+3.40)#37 | 11.4%(-2.40)#7,205 |
| 38. | Fayetteville | 8.9% | 5.6%(+3.30)#38 | 11.4%(-2.50)#7,218 |
| 39. | Sidney | 8.9% | 5.6%(+3.30)#39 | 11.4%(-2.50)#7,279 |
| 40. | Rockwell | 8.8% | 5.6%(+3.20)#40 | 11.4%(-2.60)#7,308 |
| 41. | Briarcliff | 8.6% | 5.6%(+3.00)#41 | 11.4%(-2.80)#7,491 |
| 42. | Holland | 8.5% | 5.6%(+2.90)#42 | 11.4%(-2.90)#7,553 |
| 43. | Caulksville | 8.3% | 5.6%(+2.70)#43 | 11.4%(-3.10)#7,721 |
| 44. | West Crossett | 8.1% | 5.6%(+2.50)#44 | 11.4%(-3.30)#7,869 |
| 45. | Marion | 7.9% | 5.6%(+2.30)#45 | 11.4%(-3.50)#7,996 |
| 46. | Highfill | 7.8% | 5.6%(+2.20)#46 | 11.4%(-3.60)#8,105 |
| 47. | Lincoln | 7.5% | 5.6%(+1.90)#47 | 11.4%(-3.90)#8,355 |
| 48. | Greers Ferry | 7.5% | 5.6%(+1.90)#48 | 11.4%(-3.90)#8,373 |
| 49. | Crawfordsville | 7.5% | 5.6%(+1.90)#49 | 11.4%(-3.90)#8,385 |
| 50. | Springdale | 7.4% | 5.6%(+1.80)#50 | 11.4%(-4.00)#8,411 |
| 51. | England | 7.4% | 5.6%(+1.80)#51 | 11.4%(-4.00)#8,443 |
| 52. | Wayton | 7.1% | 5.6%(+1.50)#52 | 11.4%(-4.30)#8,750 |
| 53. | Altus | 7.0% | 5.6%(+1.40)#53 | 11.4%(-4.40)#8,831 |
| 54. | Portia | 6.8% | 5.6%(+1.20)#54 | 11.4%(-4.60)#9,069 |
| 55. | Landmark | 6.7% | 5.6%(+1.10)#55 | 11.4%(-4.70)#9,132 |
| 56. | Roe | 6.7% | 5.6%(+1.10)#56 | 11.4%(-4.70)#9,201 |
| 57. | Lakeview | 6.6% | 5.6%(+1.00)#57 | 11.4%(-4.80)#9,288 |
| 58. | Gillham | 6.5% | 5.6%(+0.900)#58 | 11.4%(-4.90)#9,413 |
| 59. | Jonesboro | 6.4% | 5.6%(+0.800)#59 | 11.4%(-5.00)#9,426 |
| 60. | Sherwood | 6.4% | 5.6%(+0.800)#60 | 11.4%(-5.00)#9,431 |
| 61. | Pea Ridge | 6.4% | 5.6%(+0.800)#61 | 11.4%(-5.00)#9,457 |
| 62. | Shannon Hills | 6.4% | 5.6%(+0.800)#62 | 11.4%(-5.00)#9,464 |
| 63. | Lowell | 6.2% | 5.6%(+0.600)#63 | 11.4%(-5.20)#9,696 |
| 64. | Bonanza | 6.1% | 5.6%(+0.500)#64 | 11.4%(-5.30)#9,880 |
| 65. | Little Flock | 6.0% | 5.6%(+0.400)#65 | 11.4%(-5.40)#9,952 |
| 66. | Armorel | 6.0% | 5.6%(+0.400)#66 | 11.4%(-5.40)#10,013 |
| 67. | Conway | 5.9% | 5.6%(+0.300)#67 | 11.4%(-5.50)#10,034 |
| 68. | Mena | 5.9% | 5.6%(+0.300)#68 | 11.4%(-5.50)#10,068 |
| 69. | Mountain Home | 5.8% | 5.6%(+0.200)#69 | 11.4%(-5.60)#10,186 |
| 70. | Lake City | 5.8% | 5.6%(+0.200)#70 | 11.4%(-5.60)#10,220 |
| 71. | Black Rock | 5.8% | 5.6%(+0.200)#71 | 11.4%(-5.60)#10,261 |
| 72. | Staves | 5.8% | 5.6%(+0.200)#72 | 11.4%(-5.60)#10,302 |
| 73. | Siloam Springs | 5.7% | 5.6%(+0.100)#73 | 11.4%(-5.70)#10,320 |
| 74. | Portland | 5.7% | 5.6%(+0.100)#74 | 11.4%(-5.70)#10,404 |
| 75. | Heber Springs | 5.6% | 5.6%(=0.000)#75 | 11.4%(-5.80)#10,467 |
| 76. | West Fork | 5.6% | 5.6%(=0.000)#76 | 11.4%(-5.80)#10,491 |
| 77. | Star City | 5.6% | 5.6%(=0.000)#77 | 11.4%(-5.80)#10,506 |
| 78. | Bryant | 5.5% | 5.6%(-0.100)#78 | 11.4%(-5.90)#10,619 |
| 79. | Ogden | 5.4% | 5.6%(-0.200)#79 | 11.4%(-6.00)#10,863 |
| 80. | Monette | 5.3% | 5.6%(-0.300)#80 | 11.4%(-6.10)#10,965 |
| 81. | Letona | 5.3% | 5.6%(-0.300)#81 | 11.4%(-6.10)#11,015 |
| 82. | Ulm | 5.3% | 5.6%(-0.300)#82 | 11.4%(-6.10)#11,017 |
| 83. | Lonoke | 5.2% | 5.6%(-0.400)#83 | 11.4%(-6.20)#11,083 |
| 84. | Augusta | 5.2% | 5.6%(-0.400)#84 | 11.4%(-6.20)#11,100 |
| 85. | Bull Shoals | 5.2% | 5.6%(-0.400)#85 | 11.4%(-6.20)#11,104 |
| 86. | Cabot | 5.1% | 5.6%(-0.500)#86 | 11.4%(-6.30)#11,188 |
| 87. | Sweet Home | 5.1% | 5.6%(-0.500)#87 | 11.4%(-6.30)#11,275 |
| 88. | Valley Springs | 5.1% | 5.6%(-0.500)#88 | 11.4%(-6.30)#11,313 |
| 89. | Fort Smith | 5.0% | 5.6%(-0.600)#89 | 11.4%(-6.40)#11,337 |
| 90. | Benton | 5.0% | 5.6%(-0.600)#90 | 11.4%(-6.40)#11,346 |
| 91. | Wrightsville | 5.0% | 5.6%(-0.600)#91 | 11.4%(-6.40)#11,433 |
| 92. | Havana | 5.0% | 5.6%(-0.600)#92 | 11.4%(-6.40)#11,462 |
| 93. | East End | 4.9% | 5.6%(-0.700)#93 | 11.4%(-6.50)#11,536 |
| 94. | Fredonia Biscoe | 4.9% | 5.6%(-0.700)#94 | 11.4%(-6.50)#11,641 |
| 95. | Hope | 4.8% | 5.6%(-0.800)#95 | 11.4%(-6.60)#11,679 |
| 96. | Prattsville | 4.8% | 5.6%(-0.800)#96 | 11.4%(-6.60)#11,763 |
| 97. | Lockesburg | 4.7% | 5.6%(-0.900)#97 | 11.4%(-6.70)#11,924 |
| 98. | Blytheville | 4.6% | 5.6%(-1.000)#98 | 11.4%(-6.80)#12,007 |
| 99. | Tuckerman | 4.6% | 5.6%(-1.000)#99 | 11.4%(-6.80)#12,067 |
| 100. | Guy | 4.6% | 5.6%(-1.000)#100 | 11.4%(-6.80)#12,098 |
Common Questions
What are the Top 10 Cities with the Highest Percentage of Households with Income Above $200,000 in Arkansas?
Top 10 Cities with the Highest Percentage of Households with Income Above $200,000 in Arkansas are:
#1
38.8%
#2
28.4%
#3
27.1%
#4
23.7%
#5
22.0%
#6
21.7%
#7
20.3%
#8
19.4%
#9
18.0%
#10
16.5%
What city has the Highest Percentage of Households with Income Above $200,000 in Arkansas?
Goshen has the Highest Percentage of Households with Income Above $200,000 in Arkansas with 38.8%.
What is the Percentage of Households with Income Above $200,000 in the State of Arkansas?
Percentage of Households with Income Above $200,000 in Arkansas is 5.6%.
What is the Percentage of Households with Income Above $200,000 in the United States?
Percentage of Households with Income Above $200,000 in the United States is 11.4%.