Cities with the Highest Percentage of Households with Income Above $200,000 in Delaware
RELATED REPORTS & OPTIONS
Household Income | $200k+
Delaware
Compare Cities
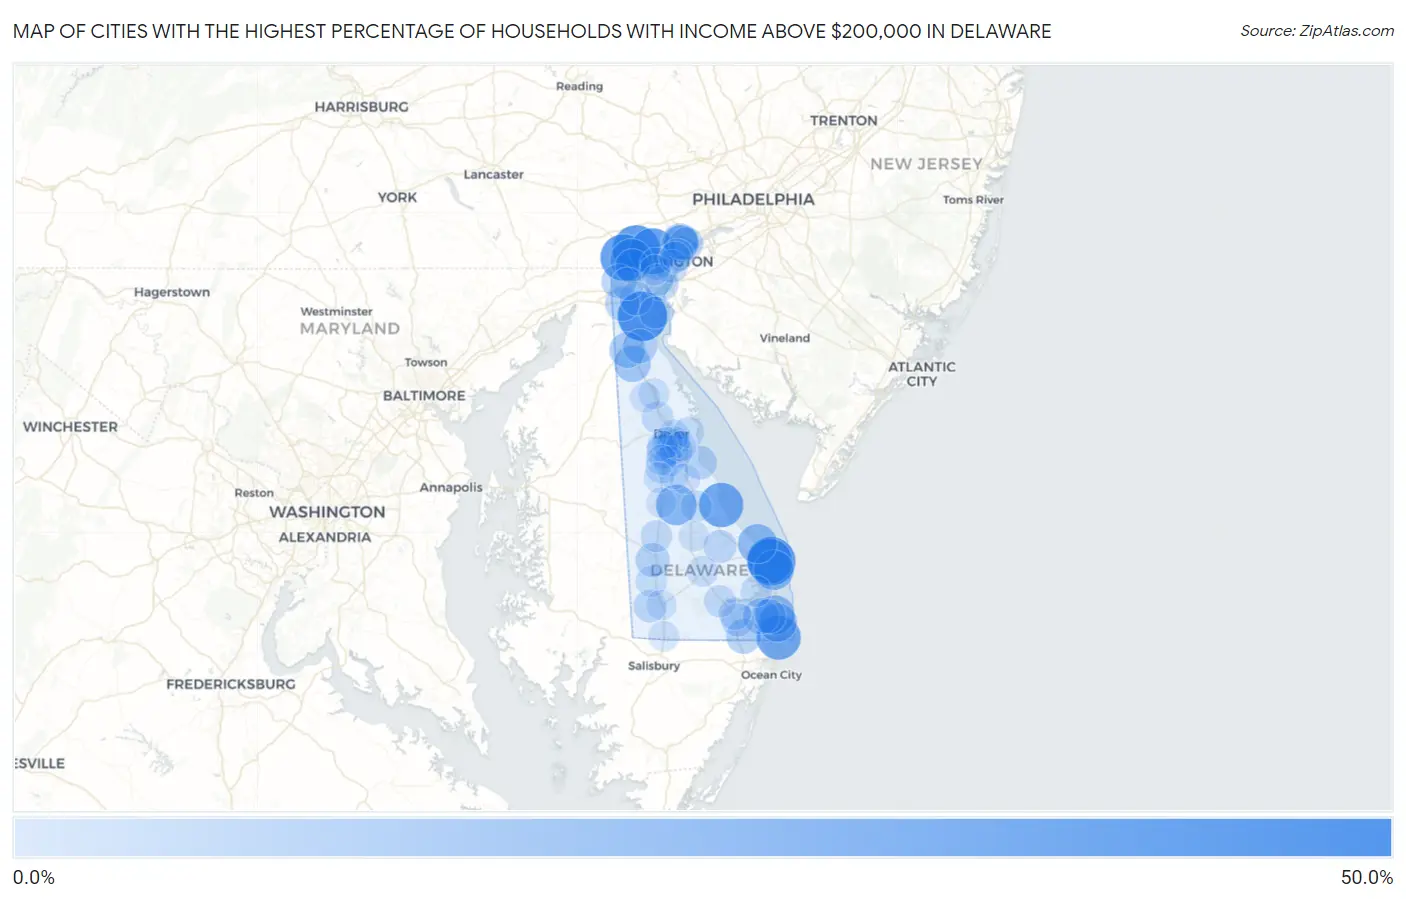
Map of Cities with the Highest Percentage of Households with Income Above $200,000 in Delaware
0.0%
50.0%
Cities with the Highest Percentage of Households with Income Above $200,000 in Delaware
| City | Households with Income > $200k | vs State | vs National | |
| 1. | St Georges | 45.4% | 10.3%(+35.1)#1 | 11.4%(+34.0)#597 |
| 2. | Henlopen Acres | 42.7% | 10.3%(+32.4)#2 | 11.4%(+31.3)#707 |
| 3. | Hockessin | 39.4% | 10.3%(+29.1)#3 | 11.4%(+28.0)#873 |
| 4. | North Star | 38.2% | 10.3%(+27.9)#4 | 11.4%(+26.8)#946 |
| 5. | Greenville | 36.9% | 10.3%(+26.6)#5 | 11.4%(+25.5)#1,029 |
| 6. | Rehoboth Beach | 34.2% | 10.3%(+23.9)#6 | 11.4%(+22.8)#1,231 |
| 7. | Slaughter Beach | 32.9% | 10.3%(+22.6)#7 | 11.4%(+21.5)#1,349 |
| 8. | Fenwick Island | 32.5% | 10.3%(+22.2)#8 | 11.4%(+21.1)#1,381 |
| 9. | Pike Creek | 27.9% | 10.3%(+17.6)#9 | 11.4%(+16.5)#1,828 |
| 10. | Houston | 24.0% | 10.3%(+13.7)#10 | 11.4%(+12.6)#2,318 |
| 11. | Dewey Beach | 22.7% | 10.3%(+12.4)#11 | 11.4%(+11.3)#2,535 |
| 12. | Bethany Beach | 21.1% | 10.3%(+10.8)#12 | 11.4%(+9.70)#2,836 |
| 13. | Lewes | 20.6% | 10.3%(+10.3)#13 | 11.4%(+9.20)#2,918 |
| 14. | South Bethany | 19.9% | 10.3%(+9.60)#14 | 11.4%(+8.50)#3,086 |
| 15. | Ardencroft | 14.9% | 10.3%(+4.60)#15 | 11.4%(+3.50)#4,344 |
| 16. | Townsend | 14.4% | 10.3%(+4.10)#16 | 11.4%(+3.00)#4,505 |
| 17. | Millville | 13.1% | 10.3%(+2.80)#17 | 11.4%(+1.70)#5,025 |
| 18. | Middletown | 13.0% | 10.3%(+2.70)#18 | 11.4%(+1.60)#5,050 |
| 19. | Arden | 12.6% | 10.3%(+2.30)#19 | 11.4%(+1.20)#5,259 |
| 20. | Lincoln | 11.1% | 10.3%(+0.800)#20 | 11.4%(-0.300)#5,927 |
| 21. | Selbyville | 10.7% | 10.3%(+0.400)#21 | 11.4%(-0.700)#6,133 |
| 22. | Ardentown | 10.6% | 10.3%(+0.300)#22 | 11.4%(-0.800)#6,208 |
| 23. | Highland Acres | 10.1% | 10.3%(-0.200)#23 | 11.4%(-1.30)#6,457 |
| 24. | Glasgow | 9.9% | 10.3%(-0.400)#24 | 11.4%(-1.50)#6,559 |
| 25. | Ocean View | 9.9% | 10.3%(-0.400)#25 | 11.4%(-1.50)#6,581 |
| 26. | Odessa | 9.8% | 10.3%(-0.500)#26 | 11.4%(-1.60)#6,685 |
| 27. | Newark | 9.7% | 10.3%(-0.600)#27 | 11.4%(-1.70)#6,703 |
| 28. | Camden | 9.5% | 10.3%(-0.800)#28 | 11.4%(-1.90)#6,854 |
| 29. | Pike Creek Valley | 9.4% | 10.3%(-0.900)#29 | 11.4%(-2.00)#6,903 |
| 30. | New Castle | 8.7% | 10.3%(-1.60)#30 | 11.4%(-2.70)#7,380 |
| 31. | Bridgeville | 8.5% | 10.3%(-1.80)#31 | 11.4%(-2.90)#7,531 |
| 32. | Bowers | 8.1% | 10.3%(-2.20)#32 | 11.4%(-3.30)#7,888 |
| 33. | Claymont | 7.7% | 10.3%(-2.60)#33 | 11.4%(-3.70)#8,163 |
| 34. | Bear | 7.4% | 10.3%(-2.90)#34 | 11.4%(-4.00)#8,418 |
| 35. | Rising Sun Lebanon | 6.6% | 10.3%(-3.70)#35 | 11.4%(-4.80)#9,254 |
| 36. | Frankford | 6.5% | 10.3%(-3.80)#36 | 11.4%(-4.90)#9,388 |
| 37. | Wilmington | 6.0% | 10.3%(-4.30)#37 | 11.4%(-5.40)#9,909 |
| 38. | Brookside | 5.9% | 10.3%(-4.40)#38 | 11.4%(-5.50)#10,049 |
| 39. | Milton | 5.8% | 10.3%(-4.50)#39 | 11.4%(-5.60)#10,206 |
| 40. | Bethel | 5.3% | 10.3%(-5.00)#40 | 11.4%(-6.10)#11,005 |
| 41. | Elsmere | 5.2% | 10.3%(-5.10)#41 | 11.4%(-6.20)#11,071 |
| 42. | Bellefonte | 5.0% | 10.3%(-5.30)#42 | 11.4%(-6.40)#11,429 |
| 43. | Dagsboro | 4.9% | 10.3%(-5.40)#43 | 11.4%(-6.50)#11,587 |
| 44. | Kent Acres | 4.6% | 10.3%(-5.70)#44 | 11.4%(-6.80)#12,061 |
| 45. | Millsboro | 4.4% | 10.3%(-5.90)#45 | 11.4%(-7.00)#12,381 |
| 46. | Delaware City | 4.3% | 10.3%(-6.00)#46 | 11.4%(-7.10)#12,589 |
| 47. | Cheswold | 4.3% | 10.3%(-6.00)#47 | 11.4%(-7.10)#12,600 |
| 48. | Greenwood | 4.1% | 10.3%(-6.20)#48 | 11.4%(-7.30)#12,975 |
| 49. | Wilmington Manor | 3.5% | 10.3%(-6.80)#49 | 11.4%(-7.90)#14,105 |
| 50. | Edgemoor | 3.4% | 10.3%(-6.90)#50 | 11.4%(-8.00)#14,318 |
| 51. | Viola | 3.2% | 10.3%(-7.10)#51 | 11.4%(-8.20)#14,967 |
| 52. | Milford | 3.1% | 10.3%(-7.20)#52 | 11.4%(-8.30)#14,998 |
| 53. | Seaford | 2.8% | 10.3%(-7.50)#53 | 11.4%(-8.60)#15,803 |
| 54. | Dover | 2.5% | 10.3%(-7.80)#54 | 11.4%(-8.90)#16,530 |
| 55. | Long Neck | 2.5% | 10.3%(-7.80)#55 | 11.4%(-8.90)#16,601 |
| 56. | Rodney Village | 2.2% | 10.3%(-8.10)#56 | 11.4%(-9.20)#17,428 |
| 57. | Little Creek | 2.2% | 10.3%(-8.10)#57 | 11.4%(-9.20)#17,517 |
| 58. | Smyrna | 1.9% | 10.3%(-8.40)#58 | 11.4%(-9.50)#18,101 |
| 59. | Wyoming | 1.8% | 10.3%(-8.50)#59 | 11.4%(-9.60)#18,498 |
| 60. | Georgetown | 1.6% | 10.3%(-8.70)#60 | 11.4%(-9.80)#18,928 |
| 61. | Riverview | 1.4% | 10.3%(-8.90)#61 | 11.4%(-10.00)#19,560 |
| 62. | Woodside East | 1.3% | 10.3%(-9.00)#62 | 11.4%(-10.1)#19,847 |
| 63. | Newport | 1.1% | 10.3%(-9.20)#63 | 11.4%(-10.3)#20,385 |
| 64. | Dover Base Housing | 1.0% | 10.3%(-9.30)#64 | 11.4%(-10.4)#20,575 |
| 65. | Delmar | 1.0% | 10.3%(-9.30)#65 | 11.4%(-10.4)#20,594 |
| 66. | Woodside | 1.0% | 10.3%(-9.30)#66 | 11.4%(-10.4)#20,785 |
| 67. | Felton | 0.90% | 10.3%(-9.40)#67 | 11.4%(-10.5)#20,945 |
| 68. | Laurel | 0.70% | 10.3%(-9.60)#68 | 11.4%(-10.7)#21,403 |
| 69. | Clayton | 0.60% | 10.3%(-9.70)#69 | 11.4%(-10.8)#21,641 |
| 70. | Frederica | 0.60% | 10.3%(-9.70)#70 | 11.4%(-10.8)#21,754 |
| 71. | Ellendale | 0.60% | 10.3%(-9.70)#71 | 11.4%(-10.8)#21,799 |
| 72. | Harrington | 0.30% | 10.3%(-10.00)#72 | 11.4%(-11.1)#22,226 |
1
Common Questions
What are the Top 10 Cities with the Highest Percentage of Households with Income Above $200,000 in Delaware?
Top 10 Cities with the Highest Percentage of Households with Income Above $200,000 in Delaware are:
#1
45.4%
#2
42.7%
#3
39.4%
#4
38.2%
#5
36.9%
#6
34.2%
#7
32.9%
#8
32.5%
#9
27.9%
#10
24.0%
What city has the Highest Percentage of Households with Income Above $200,000 in Delaware?
St Georges has the Highest Percentage of Households with Income Above $200,000 in Delaware with 45.4%.
What is the Percentage of Households with Income Above $200,000 in the State of Delaware?
Percentage of Households with Income Above $200,000 in Delaware is 10.3%.
What is the Percentage of Households with Income Above $200,000 in the United States?
Percentage of Households with Income Above $200,000 in the United States is 11.4%.