Santa Rosa Valley, CA Map & Demographics
Santa Rosa Valley Map
Santa Rosa Valley Overview
$96,141
PER CAPITA INCOME
$205,817
AVG FAMILY INCOME
$176,058
AVG HOUSEHOLD INCOME
36.9%
WAGE / INCOME GAP [ % ]
63.1¢/ $1
WAGE / INCOME GAP [ $ ]
0.47
INEQUALITY / GINI INDEX
2,508
TOTAL POPULATION
1,245
MALE POPULATION
1,263
FEMALE POPULATION
98.57
MALES / 100 FEMALES
101.45
FEMALES / 100 MALES
52.4
MEDIAN AGE
3.1
AVG FAMILY SIZE
2.9
AVG HOUSEHOLD SIZE
1,196
LABOR FORCE [ PEOPLE ]
55.4%
PERCENT IN LABOR FORCE
4.7%
UNEMPLOYMENT RATE
Santa Rosa Valley Area Codes
Income in Santa Rosa Valley
Income Overview in Santa Rosa Valley
Per Capita Income in Santa Rosa Valley is $96,141, while median incomes of families and households are $205,817 and $176,058 respectively.
| Characteristic | Number | Measure |
| Per Capita Income | 2,508 | $96,141 |
| Median Family Income | 713 | $205,817 |
| Mean Family Income | 713 | $293,745 |
| Median Household Income | 877 | $176,058 |
| Mean Household Income | 877 | $266,583 |
| Income Deficit | 713 | $0 |
| Wage / Income Gap (%) | 2,508 | 36.87% |
| Wage / Income Gap ($) | 2,508 | 63.13¢ per $1 |
| Gini / Inequality Index | 2,508 | 0.47 |
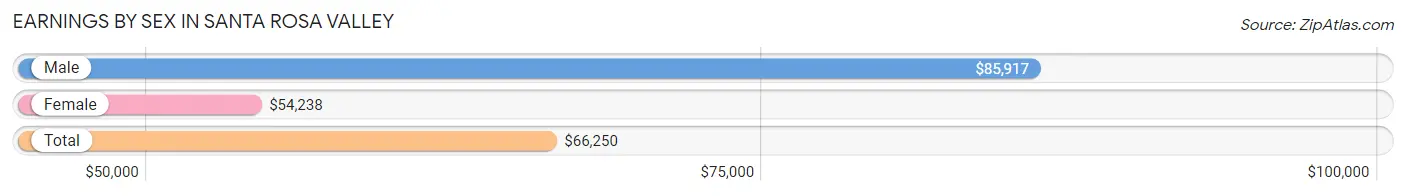
Earnings by Sex in Santa Rosa Valley
Average Earnings in Santa Rosa Valley are $66,250, $85,917 for men and $54,238 for women, a difference of 36.9%.
| Sex | Number | Average Earnings |
| Male | 819 (63.1%) | $85,917 |
| Female | 479 (36.9%) | $54,238 |
| Total | 1,298 (100.0%) | $66,250 |
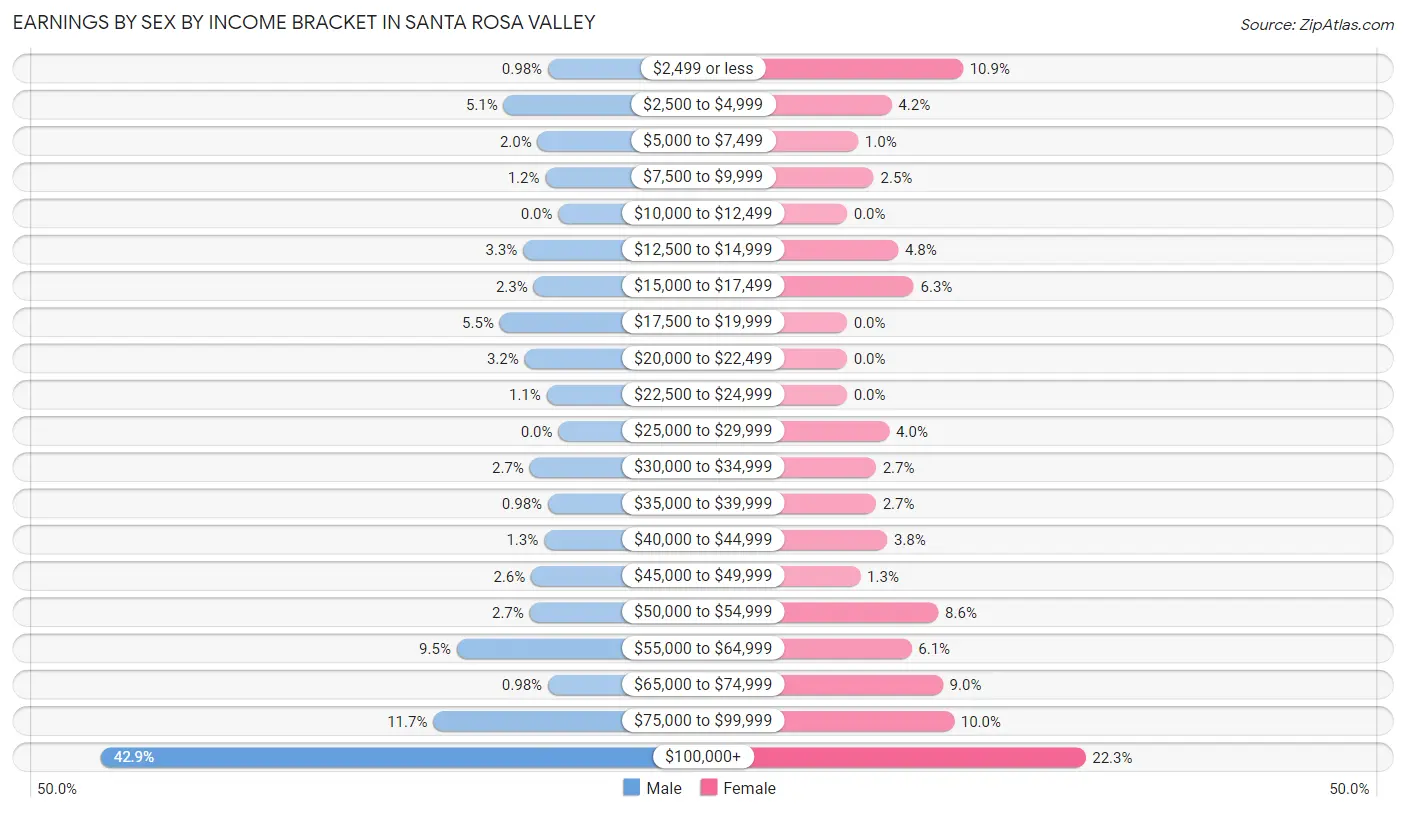
Earnings by Sex by Income Bracket in Santa Rosa Valley
The most common earnings brackets in Santa Rosa Valley are $100,000+ for men (351 | 42.9%) and $100,000+ for women (107 | 22.3%).
| Income | Male | Female |
| $2,499 or less | 8 (1.0%) | 52 (10.9%) |
| $2,500 to $4,999 | 42 (5.1%) | 20 (4.2%) |
| $5,000 to $7,499 | 16 (1.9%) | 5 (1.0%) |
| $7,500 to $9,999 | 10 (1.2%) | 12 (2.5%) |
| $10,000 to $12,499 | 0 (0.0%) | 0 (0.0%) |
| $12,500 to $14,999 | 27 (3.3%) | 23 (4.8%) |
| $15,000 to $17,499 | 19 (2.3%) | 30 (6.3%) |
| $17,500 to $19,999 | 45 (5.5%) | 0 (0.0%) |
| $20,000 to $22,499 | 26 (3.2%) | 0 (0.0%) |
| $22,500 to $24,999 | 9 (1.1%) | 0 (0.0%) |
| $25,000 to $29,999 | 0 (0.0%) | 19 (4.0%) |
| $30,000 to $34,999 | 22 (2.7%) | 13 (2.7%) |
| $35,000 to $39,999 | 8 (1.0%) | 13 (2.7%) |
| $40,000 to $44,999 | 11 (1.3%) | 18 (3.8%) |
| $45,000 to $49,999 | 21 (2.6%) | 6 (1.3%) |
| $50,000 to $54,999 | 22 (2.7%) | 41 (8.6%) |
| $55,000 to $64,999 | 78 (9.5%) | 29 (6.0%) |
| $65,000 to $74,999 | 8 (1.0%) | 43 (9.0%) |
| $75,000 to $99,999 | 96 (11.7%) | 48 (10.0%) |
| $100,000+ | 351 (42.9%) | 107 (22.3%) |
| Total | 819 (100.0%) | 479 (100.0%) |
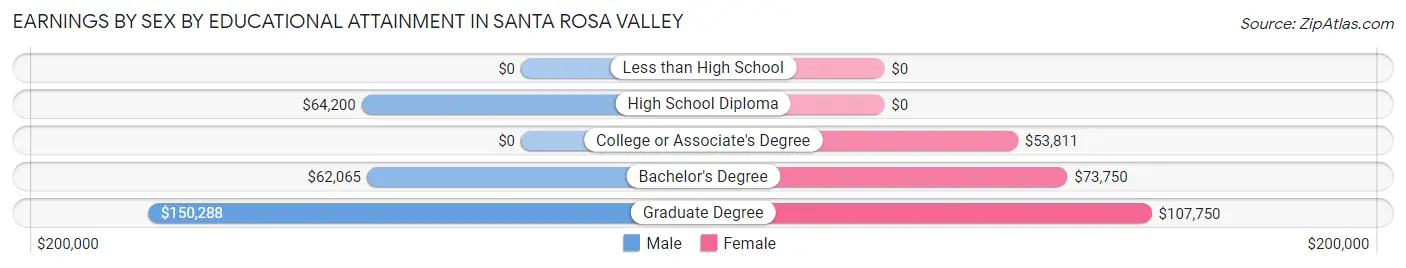
Earnings by Sex by Educational Attainment in Santa Rosa Valley
Average earnings in Santa Rosa Valley are $92,188 for men and $67,763 for women, a difference of 26.5%. Men with an educational attainment of graduate degree enjoy the highest average annual earnings of $150,288, while those with bachelor's degree education earn the least with $62,065. Women with an educational attainment of graduate degree earn the most with the average annual earnings of $107,750, while those with college or associate's degree education have the smallest earnings of $53,811.
| Educational Attainment | Male Income | Female Income |
| Less than High School | - | - |
| High School Diploma | $64,200 | $0 |
| College or Associate's Degree | - | - |
| Bachelor's Degree | $62,065 | $73,750 |
| Graduate Degree | $150,288 | $107,750 |
| Total | $92,188 | $67,763 |
Family Income in Santa Rosa Valley
Family Income Brackets in Santa Rosa Valley
According to the Santa Rosa Valley family income data, there are 365 families falling into the $200,000+ income range, which is the most common income bracket and makes up 51.2% of all families.
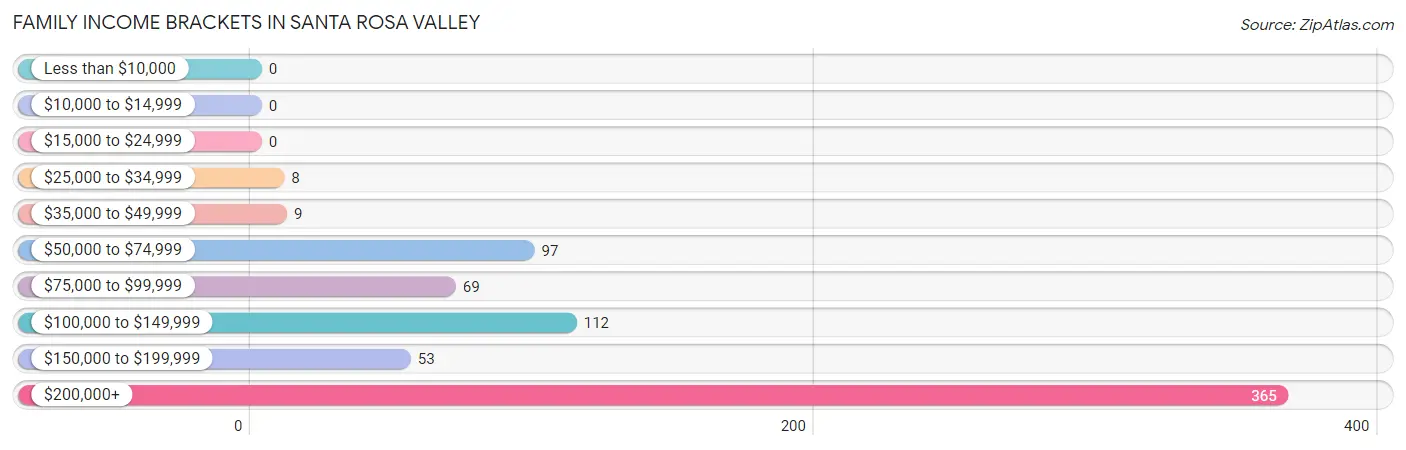
| Income Bracket | # Families | % Families |
| Less than $10,000 | 0 | 0.0% |
| $10,000 to $14,999 | 0 | 0.0% |
| $15,000 to $24,999 | 0 | 0.0% |
| $25,000 to $34,999 | 8 | 1.1% |
| $35,000 to $49,999 | 9 | 1.3% |
| $50,000 to $74,999 | 97 | 13.6% |
| $75,000 to $99,999 | 69 | 9.7% |
| $100,000 to $149,999 | 112 | 15.7% |
| $150,000 to $199,999 | 53 | 7.4% |
| $200,000+ | 365 | 51.2% |
Family Income by Famaliy Size in Santa Rosa Valley
3-person families (62 | 8.7%) account for the highest median family income in Santa Rosa Valley with $250,001 per family, while 2-person families (418 | 58.6%) have the highest median income of $103,077 per family member.
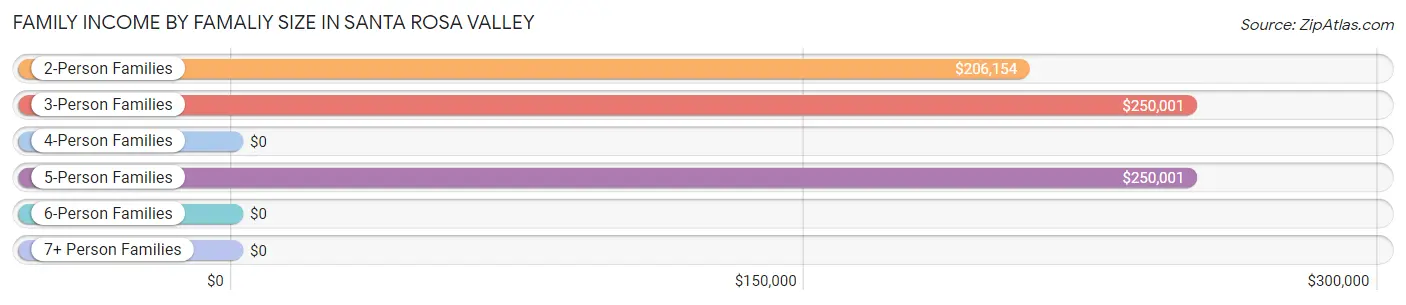
| Income Bracket | # Families | Median Income |
| 2-Person Families | 418 (58.6%) | $206,154 |
| 3-Person Families | 62 (8.7%) | $250,001 |
| 4-Person Families | 141 (19.8%) | $0 |
| 5-Person Families | 68 (9.5%) | $250,001 |
| 6-Person Families | 24 (3.4%) | $0 |
| 7+ Person Families | 0 (0.0%) | $0 |
| Total | 713 (100.0%) | $205,817 |
Family Income by Number of Earners in Santa Rosa Valley
The median family income in Santa Rosa Valley is $205,817, with families comprising 2 earners (207) having the highest median family income of $250,001, while families with 1 earner (316) have the lowest median family income of $127,222, accounting for 29.0% and 44.3% of families, respectively.
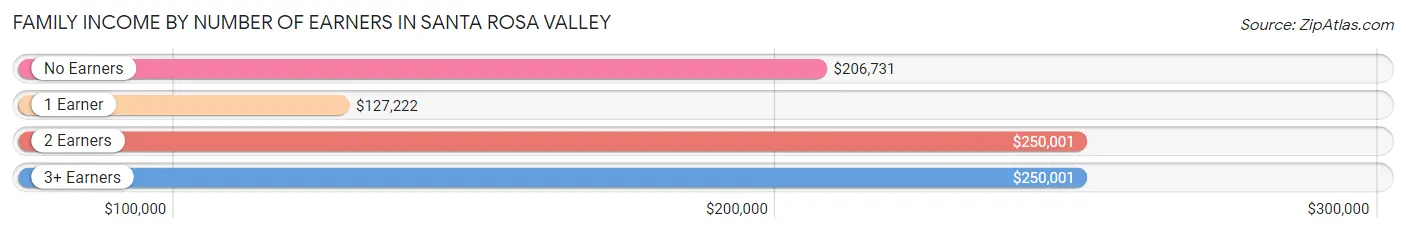
| Number of Earners | # Families | Median Income |
| No Earners | 122 (17.1%) | $206,731 |
| 1 Earner | 316 (44.3%) | $127,222 |
| 2 Earners | 207 (29.0%) | $250,001 |
| 3+ Earners | 68 (9.5%) | $250,001 |
| Total | 713 (100.0%) | $205,817 |
Household Income in Santa Rosa Valley
Household Income Brackets in Santa Rosa Valley
With 410 households falling in the category, the $200,000+ income range is the most frequent in Santa Rosa Valley, accounting for 46.8% of all households.
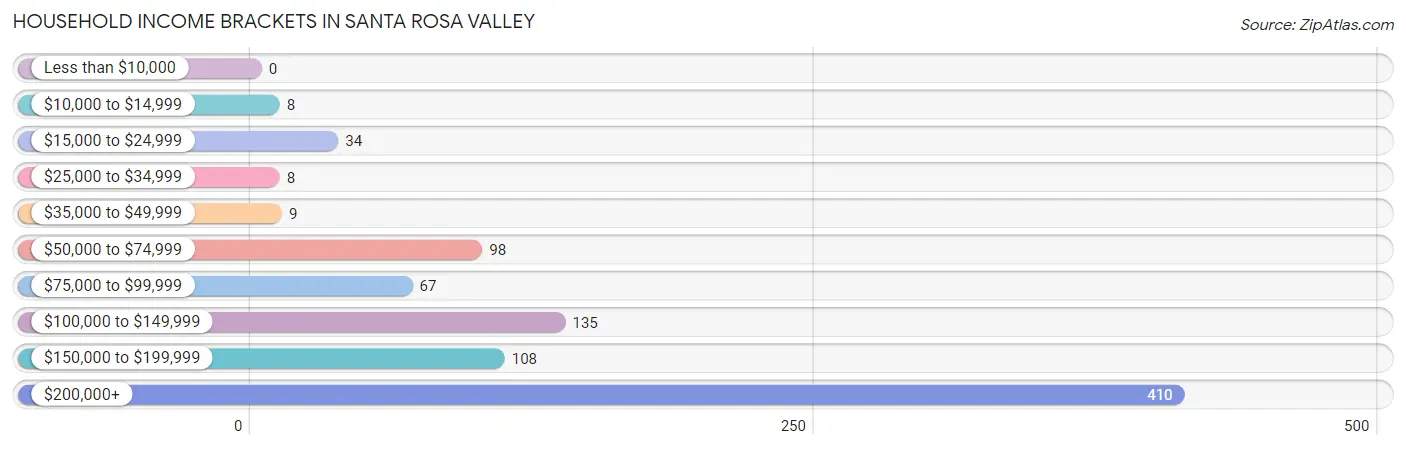
| Income Bracket | # Households | % Households |
| Less than $10,000 | 0 | 0.0% |
| $10,000 to $14,999 | 8 | 0.9% |
| $15,000 to $24,999 | 34 | 3.9% |
| $25,000 to $34,999 | 8 | 0.9% |
| $35,000 to $49,999 | 9 | 1.0% |
| $50,000 to $74,999 | 98 | 11.2% |
| $75,000 to $99,999 | 67 | 7.6% |
| $100,000 to $149,999 | 135 | 15.4% |
| $150,000 to $199,999 | 108 | 12.3% |
| $200,000+ | 410 | 46.8% |
Household Income by Householder Age in Santa Rosa Valley
The median household income in Santa Rosa Valley is $176,058, with the highest median household income of $176,442 found in the 45 to 64 years age bracket for the primary householder. A total of 355 households (40.5%) fall into this category.
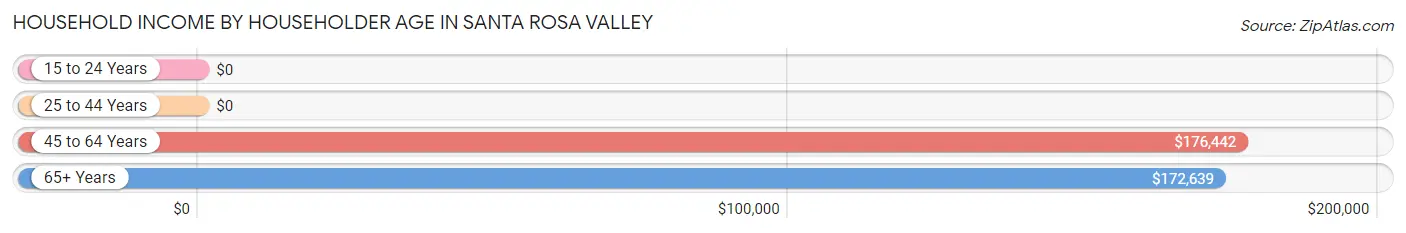
| Income Bracket | # Households | Median Income |
| 15 to 24 Years | 0 (0.0%) | $0 |
| 25 to 44 Years | 141 (16.1%) | $0 |
| 45 to 64 Years | 355 (40.5%) | $176,442 |
| 65+ Years | 381 (43.4%) | $172,639 |
| Total | 877 (100.0%) | $176,058 |
Poverty in Santa Rosa Valley
Income Below Poverty by Sex and Age in Santa Rosa Valley
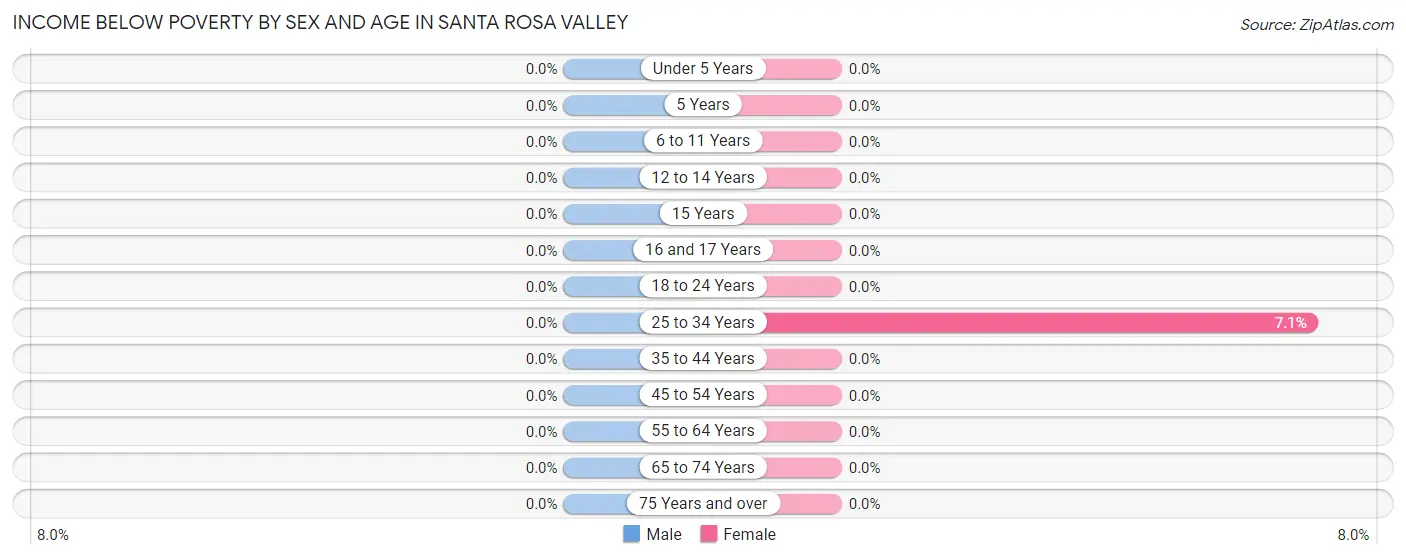
| Age Bracket | Male | Female |
| Under 5 Years | 0 (0.0%) | 0 (0.0%) |
| 5 Years | 0 (0.0%) | 0 (0.0%) |
| 6 to 11 Years | 0 (0.0%) | 0 (0.0%) |
| 12 to 14 Years | 0 (0.0%) | 0 (0.0%) |
| 15 Years | 0 (0.0%) | 0 (0.0%) |
| 16 and 17 Years | 0 (0.0%) | 0 (0.0%) |
| 18 to 24 Years | 0 (0.0%) | 0 (0.0%) |
| 25 to 34 Years | 0 (0.0%) | 8 (7.1%) |
| 35 to 44 Years | 0 (0.0%) | 0 (0.0%) |
| 45 to 54 Years | 0 (0.0%) | 0 (0.0%) |
| 55 to 64 Years | 0 (0.0%) | 0 (0.0%) |
| 65 to 74 Years | 0 (0.0%) | 0 (0.0%) |
| 75 Years and over | 0 (0.0%) | 0 (0.0%) |
| Total | 0 (0.0%) | 8 (0.6%) |
Income Above Poverty by Sex and Age in Santa Rosa Valley
According to the poverty statistics in Santa Rosa Valley, males aged under 5 years and females aged under 5 years are the age groups that are most secure financially, with 100.0% of males and 100.0% of females in these age groups living above the poverty line.
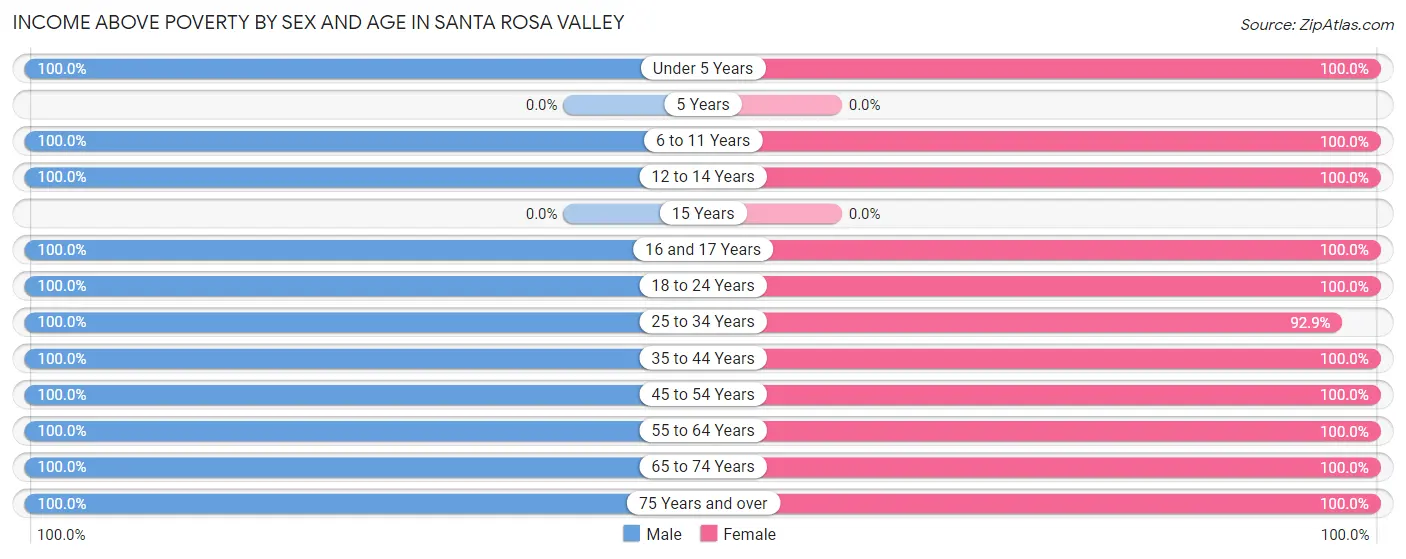
| Age Bracket | Male | Female |
| Under 5 Years | 10 (100.0%) | 6 (100.0%) |
| 5 Years | 0 (0.0%) | 0 (0.0%) |
| 6 to 11 Years | 168 (100.0%) | 113 (100.0%) |
| 12 to 14 Years | 13 (100.0%) | 39 (100.0%) |
| 15 Years | 0 (0.0%) | 0 (0.0%) |
| 16 and 17 Years | 11 (100.0%) | 58 (100.0%) |
| 18 to 24 Years | 87 (100.0%) | 98 (100.0%) |
| 25 to 34 Years | 114 (100.0%) | 105 (92.9%) |
| 35 to 44 Years | 148 (100.0%) | 78 (100.0%) |
| 45 to 54 Years | 135 (100.0%) | 190 (100.0%) |
| 55 to 64 Years | 190 (100.0%) | 243 (100.0%) |
| 65 to 74 Years | 267 (100.0%) | 183 (100.0%) |
| 75 Years and over | 102 (100.0%) | 142 (100.0%) |
| Total | 1,245 (100.0%) | 1,255 (99.4%) |
Income Below Poverty Among Married-Couple Families in Santa Rosa Valley
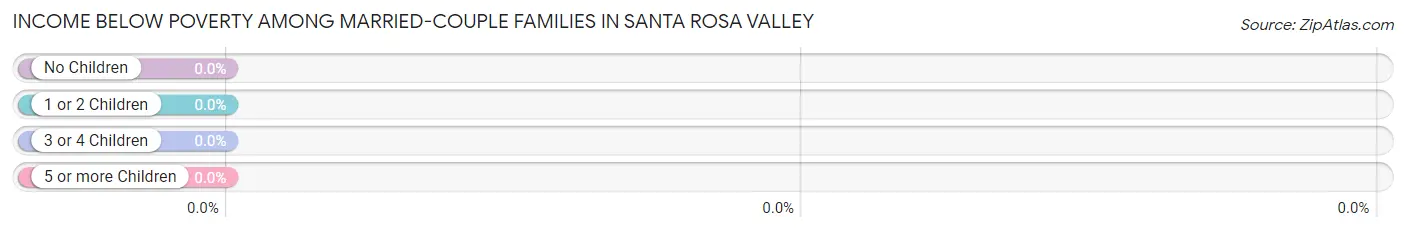
| Children | Above Poverty | Below Poverty |
| No Children | 480 (100.0%) | 0 (0.0%) |
| 1 or 2 Children | 157 (100.0%) | 0 (0.0%) |
| 3 or 4 Children | 24 (100.0%) | 0 (0.0%) |
| 5 or more Children | 0 (0.0%) | 0 (0.0%) |
| Total | 661 (100.0%) | 0 (0.0%) |
Income Below Poverty Among Single-Parent Households in Santa Rosa Valley
| Children | Single Father | Single Mother |
| No Children | 0 (0.0%) | 0 (0.0%) |
| 1 or 2 Children | 0 (0.0%) | 0 (0.0%) |
| 3 or 4 Children | 0 (0.0%) | 0 (0.0%) |
| 5 or more Children | 0 (0.0%) | 0 (0.0%) |
| Total | 0 (0.0%) | 0 (0.0%) |
Income Below Poverty Among Married-Couple vs Single-Parent Households in Santa Rosa Valley
| Children | Married-Couple Families | Single-Parent Households |
| No Children | 0 (0.0%) | 0 (0.0%) |
| 1 or 2 Children | 0 (0.0%) | 0 (0.0%) |
| 3 or 4 Children | 0 (0.0%) | 0 (0.0%) |
| 5 or more Children | 0 (0.0%) | 0 (0.0%) |
| Total | 0 (0.0%) | 0 (0.0%) |
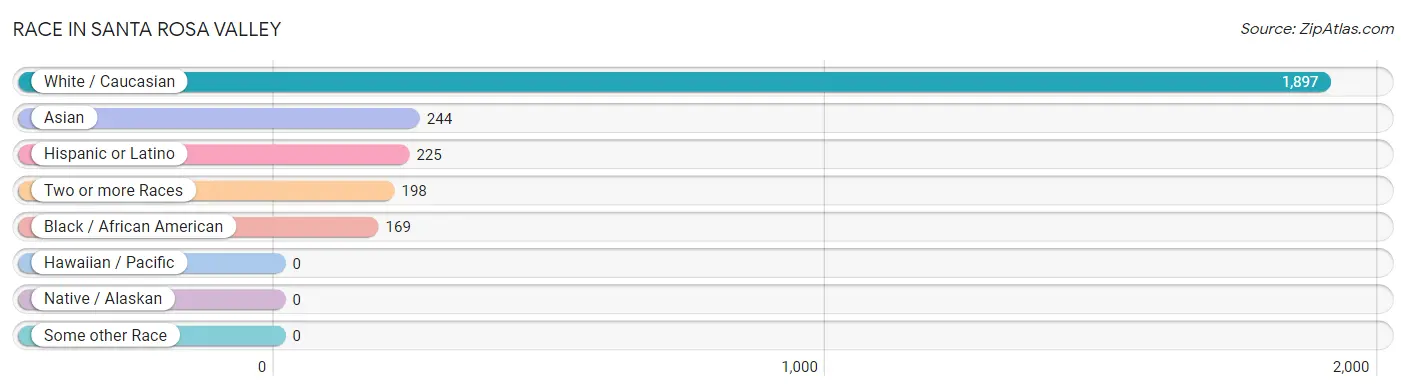
Race in Santa Rosa Valley
The most populous races in Santa Rosa Valley are White / Caucasian (1,897 | 75.6%), Asian (244 | 9.7%), and Hispanic or Latino (225 | 9.0%).
| Race | # Population | % Population |
| Asian | 244 | 9.7% |
| Black / African American | 169 | 6.7% |
| Hawaiian / Pacific | 0 | 0.0% |
| Hispanic or Latino | 225 | 9.0% |
| Native / Alaskan | 0 | 0.0% |
| White / Caucasian | 1,897 | 75.6% |
| Two or more Races | 198 | 7.9% |
| Some other Race | 0 | 0.0% |
| Total | 2,508 | 100.0% |
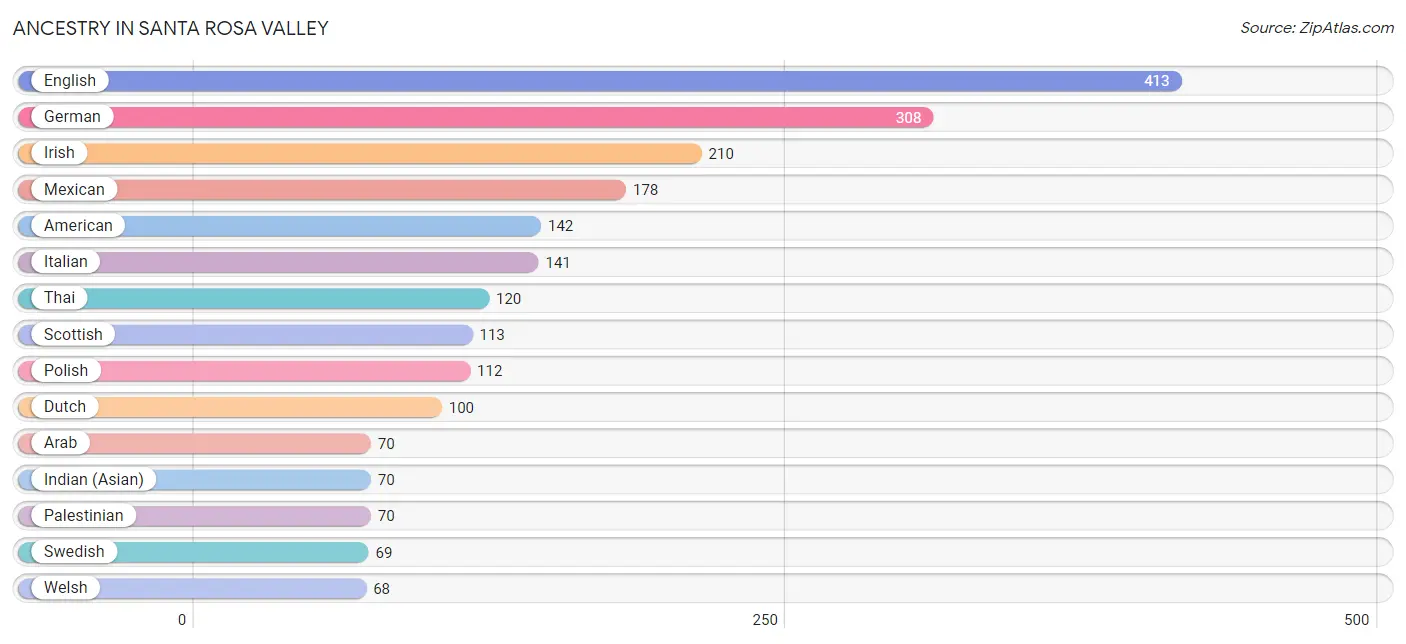
Ancestry in Santa Rosa Valley
The most populous ancestries reported in Santa Rosa Valley are English (413 | 16.5%), German (308 | 12.3%), Irish (210 | 8.4%), Mexican (178 | 7.1%), and American (142 | 5.7%), together accounting for 49.9% of all Santa Rosa Valley residents.
| Ancestry | # Population | % Population |
| American | 142 | 5.7% |
| Arab | 70 | 2.8% |
| Austrian | 26 | 1.0% |
| Bhutanese | 8 | 0.3% |
| Bolivian | 15 | 0.6% |
| Danish | 36 | 1.4% |
| Dutch | 100 | 4.0% |
| English | 413 | 16.5% |
| European | 46 | 1.8% |
| Filipino | 44 | 1.8% |
| Finnish | 10 | 0.4% |
| French | 8 | 0.3% |
| German | 308 | 12.3% |
| Greek | 34 | 1.4% |
| Hungarian | 10 | 0.4% |
| Indian (Asian) | 70 | 2.8% |
| Iranian | 10 | 0.4% |
| Irish | 210 | 8.4% |
| Italian | 141 | 5.6% |
| Korean | 49 | 1.9% |
| Laotian | 7 | 0.3% |
| Lithuanian | 8 | 0.3% |
| Mexican | 178 | 7.1% |
| Norwegian | 39 | 1.6% |
| Pakistani | 10 | 0.4% |
| Palestinian | 70 | 2.8% |
| Polish | 112 | 4.5% |
| Portuguese | 8 | 0.3% |
| Puerto Rican | 22 | 0.9% |
| Russian | 24 | 1.0% |
| Scandinavian | 8 | 0.3% |
| Scottish | 113 | 4.5% |
| South American | 15 | 0.6% |
| Spaniard | 10 | 0.4% |
| Swedish | 69 | 2.8% |
| Swiss | 16 | 0.6% |
| Thai | 120 | 4.8% |
| Ukrainian | 8 | 0.3% |
| Welsh | 68 | 2.7% | View All 39 Rows |
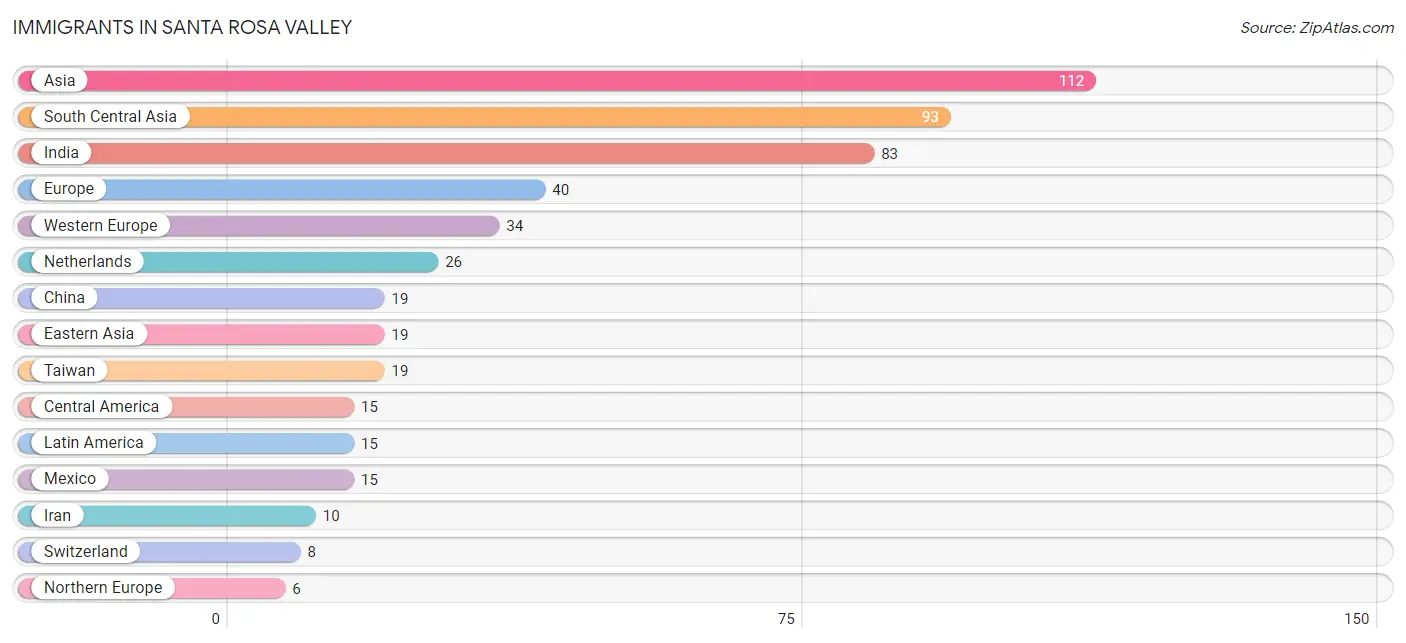
Immigrants in Santa Rosa Valley
The most numerous immigrant groups reported in Santa Rosa Valley came from Asia (112 | 4.5%), South Central Asia (93 | 3.7%), India (83 | 3.3%), Europe (40 | 1.6%), and Western Europe (34 | 1.4%), together accounting for 14.4% of all Santa Rosa Valley residents.
| Immigration Origin | # Population | % Population |
| Asia | 112 | 4.5% |
| Central America | 15 | 0.6% |
| China | 19 | 0.8% |
| Eastern Asia | 19 | 0.8% |
| Europe | 40 | 1.6% |
| India | 83 | 3.3% |
| Iran | 10 | 0.4% |
| Latin America | 15 | 0.6% |
| Mexico | 15 | 0.6% |
| Netherlands | 26 | 1.0% |
| Northern Europe | 6 | 0.2% |
| South Central Asia | 93 | 3.7% |
| Switzerland | 8 | 0.3% |
| Taiwan | 19 | 0.8% |
| Western Europe | 34 | 1.4% | View All 15 Rows |
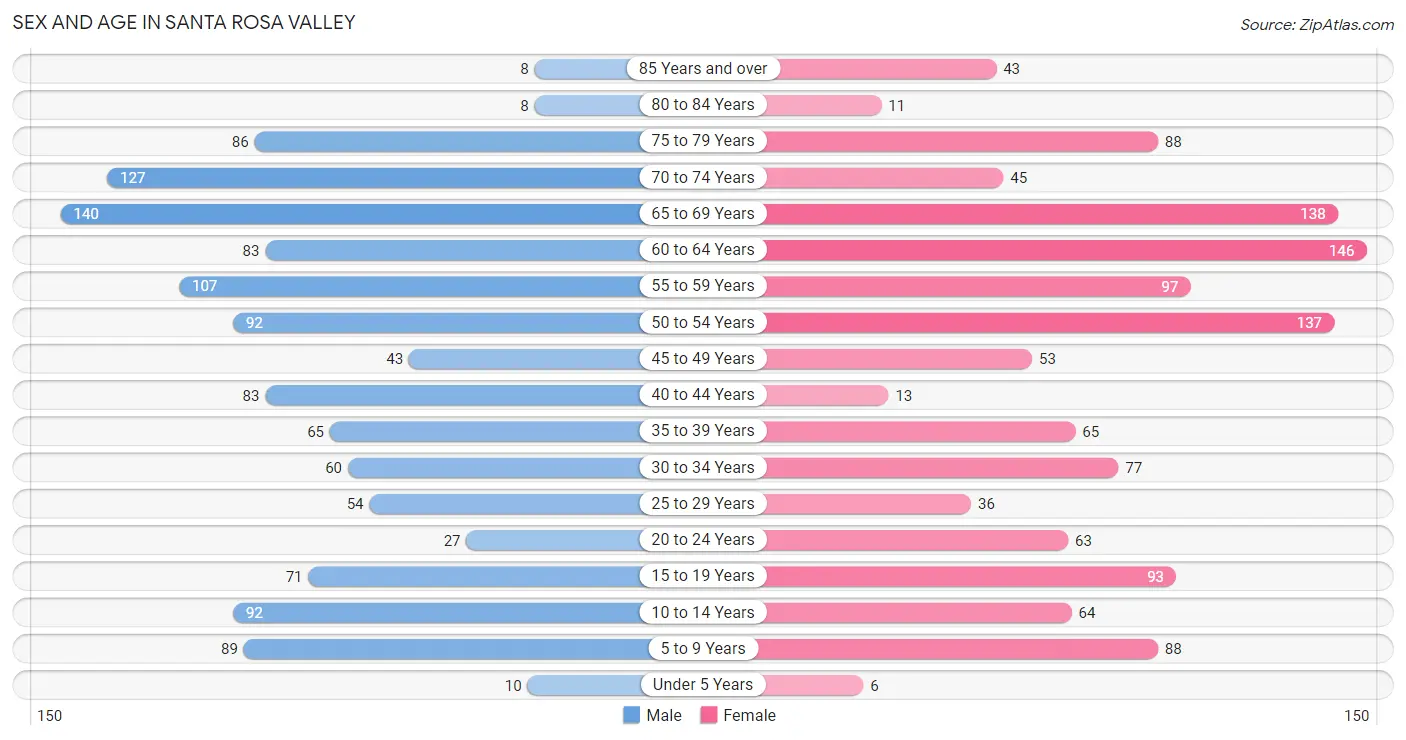
Sex and Age in Santa Rosa Valley
Sex and Age in Santa Rosa Valley
The most populous age groups in Santa Rosa Valley are 65 to 69 Years (140 | 11.2%) for men and 60 to 64 Years (146 | 11.6%) for women.
| Age Bracket | Male | Female |
| Under 5 Years | 10 (0.8%) | 6 (0.5%) |
| 5 to 9 Years | 89 (7.1%) | 88 (7.0%) |
| 10 to 14 Years | 92 (7.4%) | 64 (5.1%) |
| 15 to 19 Years | 71 (5.7%) | 93 (7.4%) |
| 20 to 24 Years | 27 (2.2%) | 63 (5.0%) |
| 25 to 29 Years | 54 (4.3%) | 36 (2.9%) |
| 30 to 34 Years | 60 (4.8%) | 77 (6.1%) |
| 35 to 39 Years | 65 (5.2%) | 65 (5.1%) |
| 40 to 44 Years | 83 (6.7%) | 13 (1.0%) |
| 45 to 49 Years | 43 (3.5%) | 53 (4.2%) |
| 50 to 54 Years | 92 (7.4%) | 137 (10.8%) |
| 55 to 59 Years | 107 (8.6%) | 97 (7.7%) |
| 60 to 64 Years | 83 (6.7%) | 146 (11.6%) |
| 65 to 69 Years | 140 (11.2%) | 138 (10.9%) |
| 70 to 74 Years | 127 (10.2%) | 45 (3.6%) |
| 75 to 79 Years | 86 (6.9%) | 88 (7.0%) |
| 80 to 84 Years | 8 (0.6%) | 11 (0.9%) |
| 85 Years and over | 8 (0.6%) | 43 (3.4%) |
| Total | 1,245 (100.0%) | 1,263 (100.0%) |
Families and Households in Santa Rosa Valley
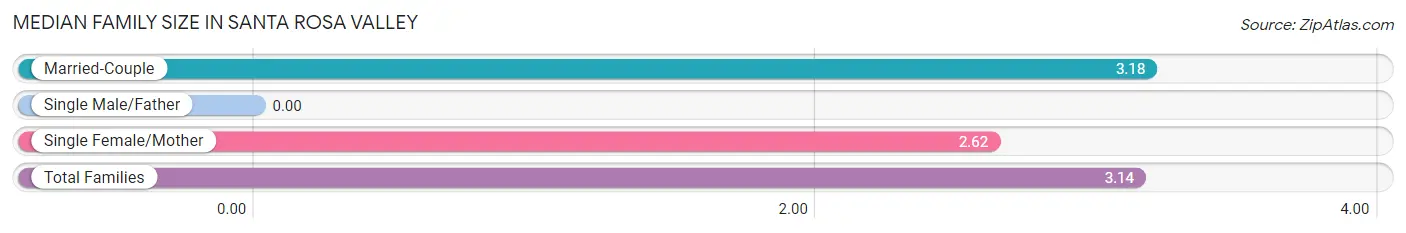
Median Family Size in Santa Rosa Valley
| Family Type | # Families | Family Size |
| Married-Couple | 661 (92.7%) | 3.18 |
| Single Male/Father | 0 (0.0%) | - |
| Single Female/Mother | 52 (7.3%) | 2.62 |
| Total Families | 713 (100.0%) | 3.14 |
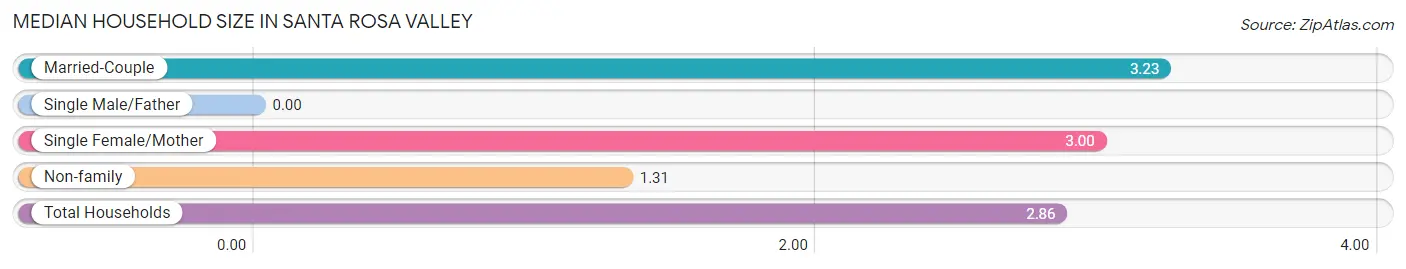
Median Household Size in Santa Rosa Valley
| Household Type | # Households | Household Size |
| Married-Couple | 661 (75.4%) | 3.23 |
| Single Male/Father | 0 (0.0%) | - |
| Single Female/Mother | 52 (5.9%) | 3.00 |
| Non-family | 164 (18.7%) | 1.31 |
| Total Households | 877 (100.0%) | 2.86 |
Household Size by Marriage Status in Santa Rosa Valley
Out of a total of 877 households in Santa Rosa Valley, 713 (81.3%) are family households, while 164 (18.7%) are nonfamily households. The most numerous type of family households are 2-person households, comprising 401, and the most common type of nonfamily households are 1-person households, comprising 133.
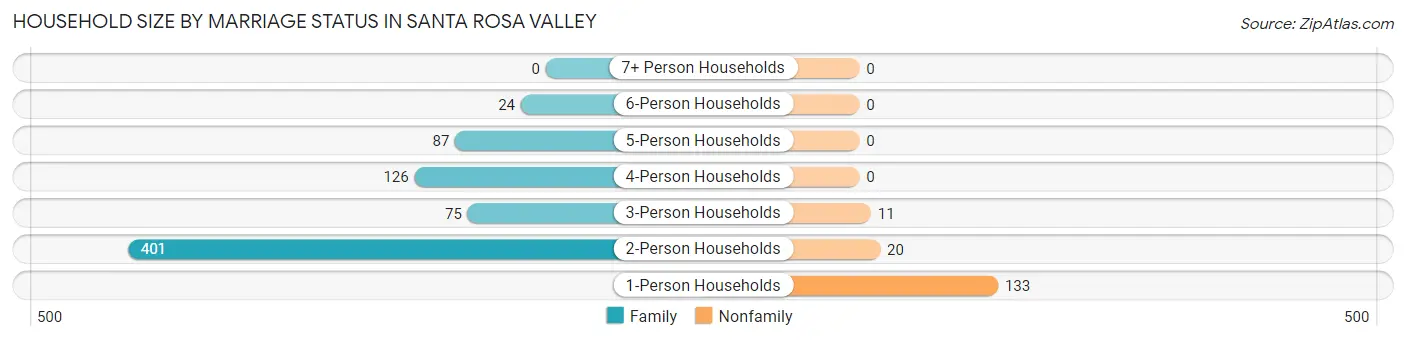
| Household Size | Family Households | Nonfamily Households |
| 1-Person Households | - | 133 (15.2%) |
| 2-Person Households | 401 (45.7%) | 20 (2.3%) |
| 3-Person Households | 75 (8.6%) | 11 (1.3%) |
| 4-Person Households | 126 (14.4%) | 0 (0.0%) |
| 5-Person Households | 87 (9.9%) | 0 (0.0%) |
| 6-Person Households | 24 (2.7%) | 0 (0.0%) |
| 7+ Person Households | 0 (0.0%) | 0 (0.0%) |
| Total | 713 (81.3%) | 164 (18.7%) |
Female Fertility in Santa Rosa Valley
Fertility by Age in Santa Rosa Valley
Average fertility rate in Santa Rosa Valley is 59.0 births per 1,000 women. Women in the age bracket of 20 to 34 years have the highest fertility rate with 142.0 births per 1,000 women. Women in the age bracket of 20 to 34 years acount for 100.0% of all women with births.
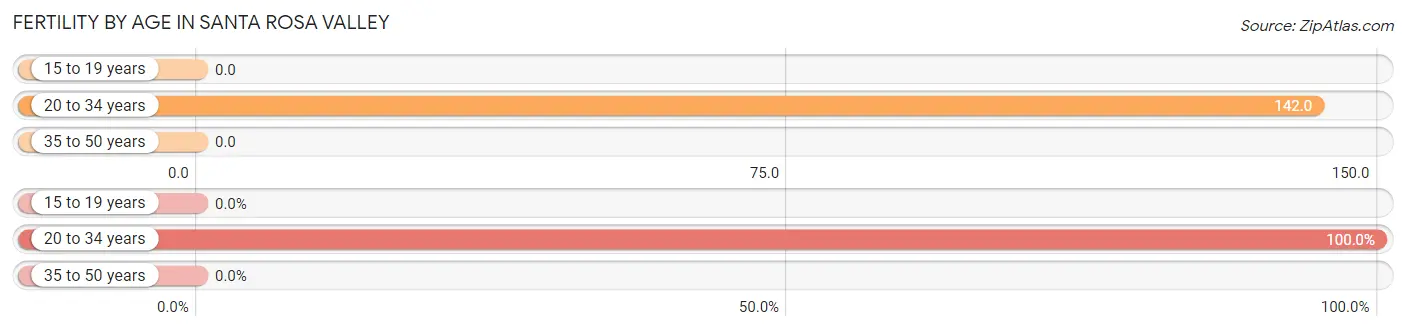
| Age Bracket | Women with Births | Births / 1,000 Women |
| 15 to 19 years | 0 (0.0%) | 0.0 |
| 20 to 34 years | 25 (100.0%) | 142.0 |
| 35 to 50 years | 0 (0.0%) | 0.0 |
| Total | 25 (100.0%) | 59.0 |
Fertility by Age by Marriage Status in Santa Rosa Valley
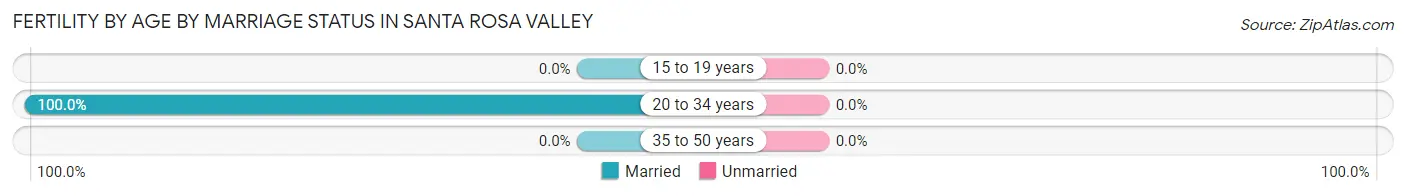
| Age Bracket | Married | Unmarried |
| 15 to 19 years | 0 (0.0%) | 0 (0.0%) |
| 20 to 34 years | 25 (100.0%) | 0 (0.0%) |
| 35 to 50 years | 0 (0.0%) | 0 (0.0%) |
| Total | 25 (100.0%) | 0 (0.0%) |
Fertility by Education in Santa Rosa Valley
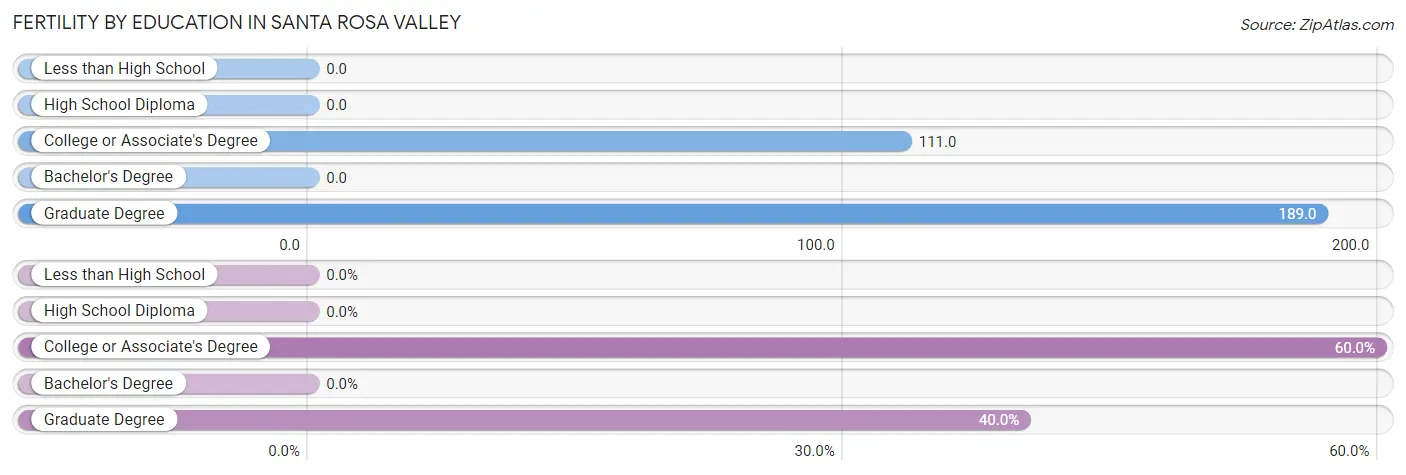
| Educational Attainment | Women with Births | Births / 1,000 Women |
| Less than High School | 0 (0.0%) | 0.0 |
| High School Diploma | 0 (0.0%) | 0.0 |
| College or Associate's Degree | 15 (60.0%) | 111.0 |
| Bachelor's Degree | 0 (0.0%) | 0.0 |
| Graduate Degree | 10 (40.0%) | 189.0 |
| Total | 25 (100.0%) | 59.0 |
Fertility by Education by Marriage Status in Santa Rosa Valley
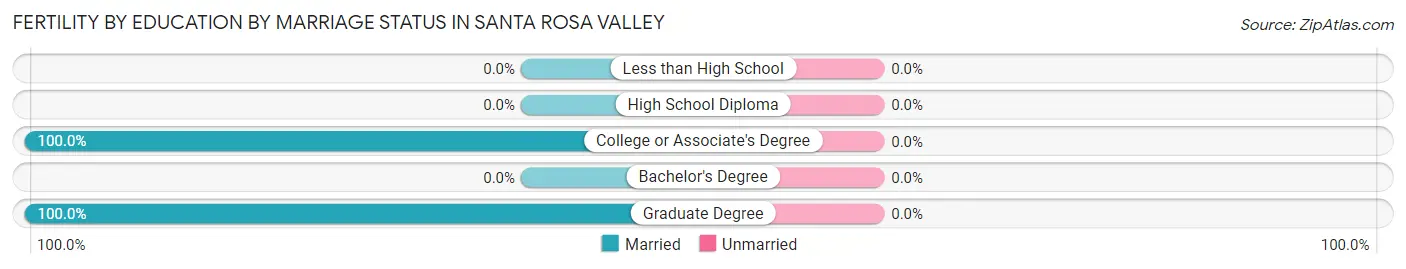
| Educational Attainment | Married | Unmarried |
| Less than High School | 0 (0.0%) | 0 (0.0%) |
| High School Diploma | 0 (0.0%) | 0 (0.0%) |
| College or Associate's Degree | 15 (100.0%) | 0 (0.0%) |
| Bachelor's Degree | 0 (0.0%) | 0 (0.0%) |
| Graduate Degree | 10 (100.0%) | 0 (0.0%) |
| Total | 25 (100.0%) | 0 (0.0%) |
Employment Characteristics in Santa Rosa Valley
Employment by Class of Employer in Santa Rosa Valley
Among the 1,105 employed individuals in Santa Rosa Valley, private company employees (621 | 56.2%), self-employed (incorporated) (204 | 18.5%), and self-employed (not incorporated) (130 | 11.8%) make up the most common classes of employment.
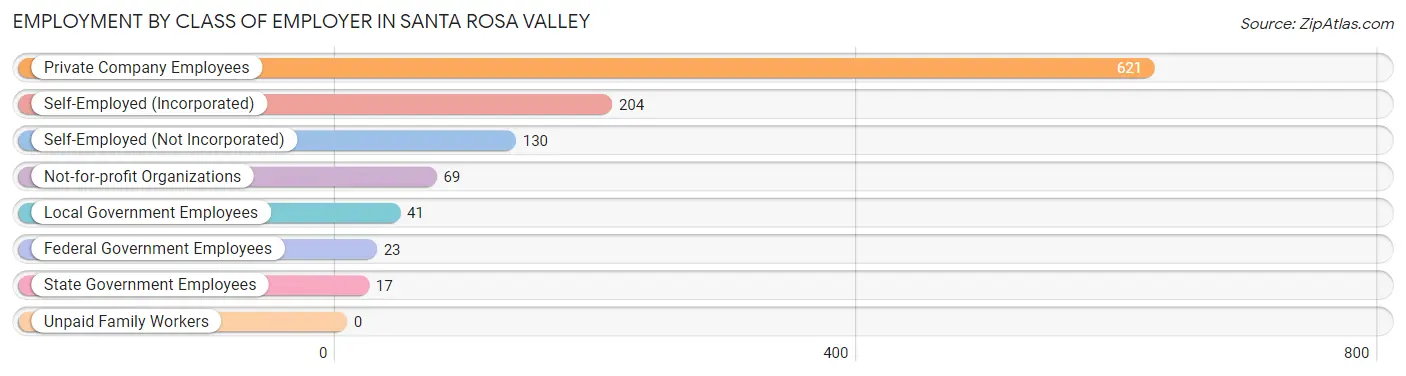
| Employer Class | # Employees | % Employees |
| Private Company Employees | 621 | 56.2% |
| Self-Employed (Incorporated) | 204 | 18.5% |
| Self-Employed (Not Incorporated) | 130 | 11.8% |
| Not-for-profit Organizations | 69 | 6.2% |
| Local Government Employees | 41 | 3.7% |
| State Government Employees | 17 | 1.5% |
| Federal Government Employees | 23 | 2.1% |
| Unpaid Family Workers | 0 | 0.0% |
| Total | 1,105 | 100.0% |
Employment Status by Age in Santa Rosa Valley
According to the labor force statistics for Santa Rosa Valley, out of the total population over 16 years of age (2,159), 55.4% or 1,196 individuals are in the labor force, with 4.7% or 56 of them unemployed. The age group with the highest labor force participation rate is 20 to 24 years, with 100.0% or 90 individuals in the labor force. Within the labor force, the 16 to 19 years age range has the highest percentage of unemployed individuals, with 34.3% or 12 of them being unemployed.
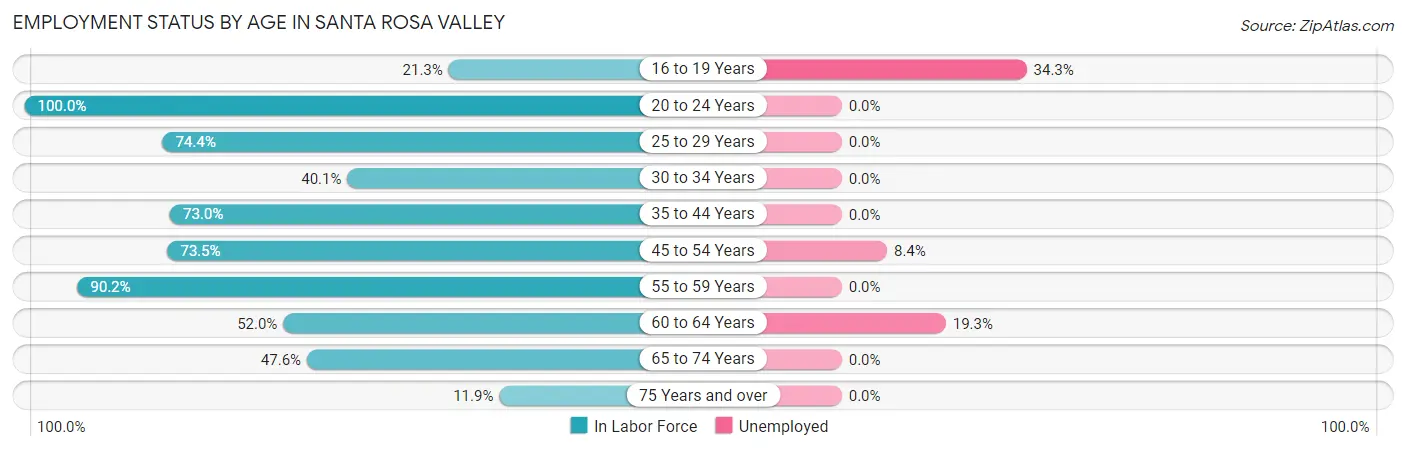
| Age Bracket | In Labor Force | Unemployed |
| 16 to 19 Years | 35 (21.3%) | 12 (34.3%) |
| 20 to 24 Years | 90 (100.0%) | 0 (0.0%) |
| 25 to 29 Years | 67 (74.4%) | 0 (0.0%) |
| 30 to 34 Years | 55 (40.1%) | 0 (0.0%) |
| 35 to 44 Years | 165 (73.0%) | 0 (0.0%) |
| 45 to 54 Years | 239 (73.5%) | 20 (8.4%) |
| 55 to 59 Years | 184 (90.2%) | 0 (0.0%) |
| 60 to 64 Years | 119 (52.0%) | 23 (19.3%) |
| 65 to 74 Years | 214 (47.6%) | 0 (0.0%) |
| 75 Years and over | 29 (11.9%) | 0 (0.0%) |
| Total | 1,196 (55.4%) | 56 (4.7%) |
Employment Status by Educational Attainment in Santa Rosa Valley
According to labor force statistics for Santa Rosa Valley, 68.5% of individuals (830) out of the total population between 25 and 64 years of age (1,211) are in the labor force, with 5.3% or 44 of them being unemployed. The group with the highest labor force participation rate are those with the educational attainment of bachelor's degree or higher, with 71.5% or 462 individuals in the labor force. Within the labor force, individuals with bachelor's degree or higher education have the highest percentage of unemployment, with 8.0% or 37 of them being unemployed.
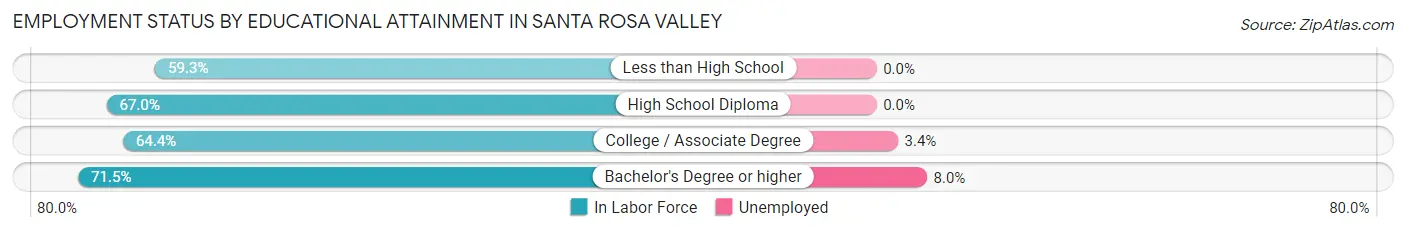
| Educational Attainment | In Labor Force | Unemployed |
| Less than High School | 16 (59.3%) | 0 (0.0%) |
| High School Diploma | 118 (67.0%) | 0 (0.0%) |
| College / Associate Degree | 233 (64.4%) | 12 (3.4%) |
| Bachelor's Degree or higher | 462 (71.5%) | 52 (8.0%) |
| Total | 830 (68.5%) | 64 (5.3%) |
Employment Occupations by Sex in Santa Rosa Valley
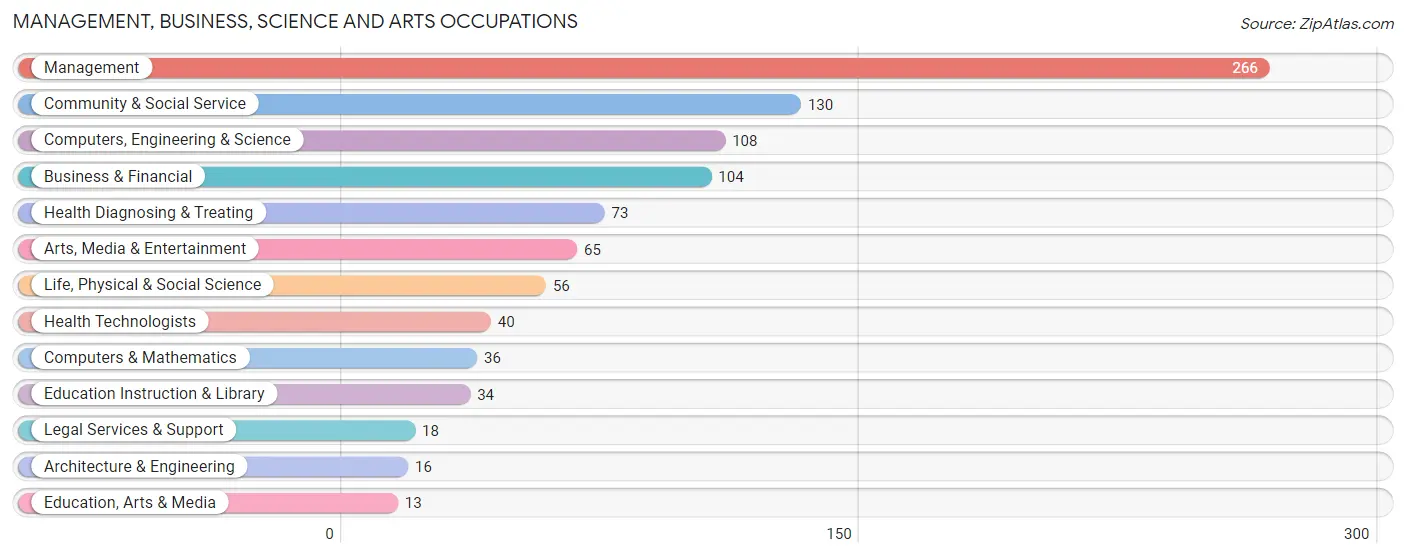
Management, Business, Science and Arts Occupations
The most common Management, Business, Science and Arts occupations in Santa Rosa Valley are Management (266 | 23.8%), Community & Social Service (130 | 11.6%), Computers, Engineering & Science (108 | 9.7%), Business & Financial (104 | 9.3%), and Health Diagnosing & Treating (73 | 6.5%).
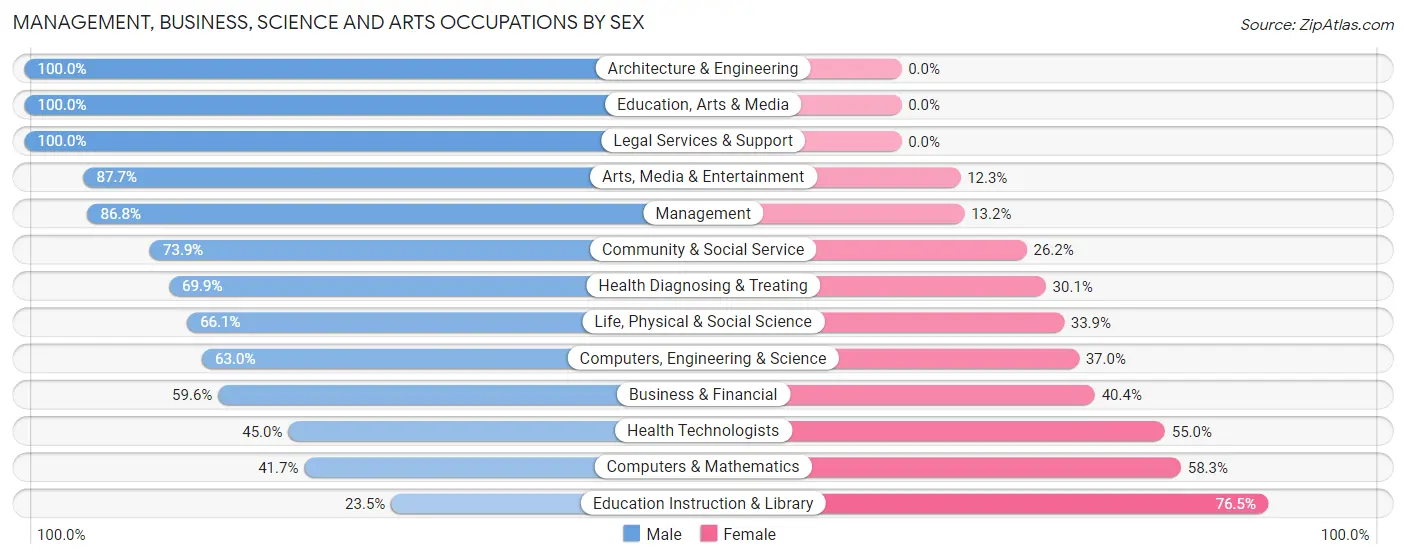
Management, Business, Science and Arts Occupations by Sex
Within the Management, Business, Science and Arts occupations in Santa Rosa Valley, the most male-oriented occupations are Architecture & Engineering (100.0%), Education, Arts & Media (100.0%), and Legal Services & Support (100.0%), while the most female-oriented occupations are Education Instruction & Library (76.5%), Computers & Mathematics (58.3%), and Health Technologists (55.0%).
| Occupation | Male | Female |
| Management | 231 (86.8%) | 35 (13.2%) |
| Business & Financial | 62 (59.6%) | 42 (40.4%) |
| Computers, Engineering & Science | 68 (63.0%) | 40 (37.0%) |
| Computers & Mathematics | 15 (41.7%) | 21 (58.3%) |
| Architecture & Engineering | 16 (100.0%) | 0 (0.0%) |
| Life, Physical & Social Science | 37 (66.1%) | 19 (33.9%) |
| Community & Social Service | 96 (73.9%) | 34 (26.2%) |
| Education, Arts & Media | 13 (100.0%) | 0 (0.0%) |
| Legal Services & Support | 18 (100.0%) | 0 (0.0%) |
| Education Instruction & Library | 8 (23.5%) | 26 (76.5%) |
| Arts, Media & Entertainment | 57 (87.7%) | 8 (12.3%) |
| Health Diagnosing & Treating | 51 (69.9%) | 22 (30.1%) |
| Health Technologists | 18 (45.0%) | 22 (55.0%) |
| Total (Category) | 508 (74.6%) | 173 (25.4%) |
| Total (Overall) | 707 (63.2%) | 412 (36.8%) |
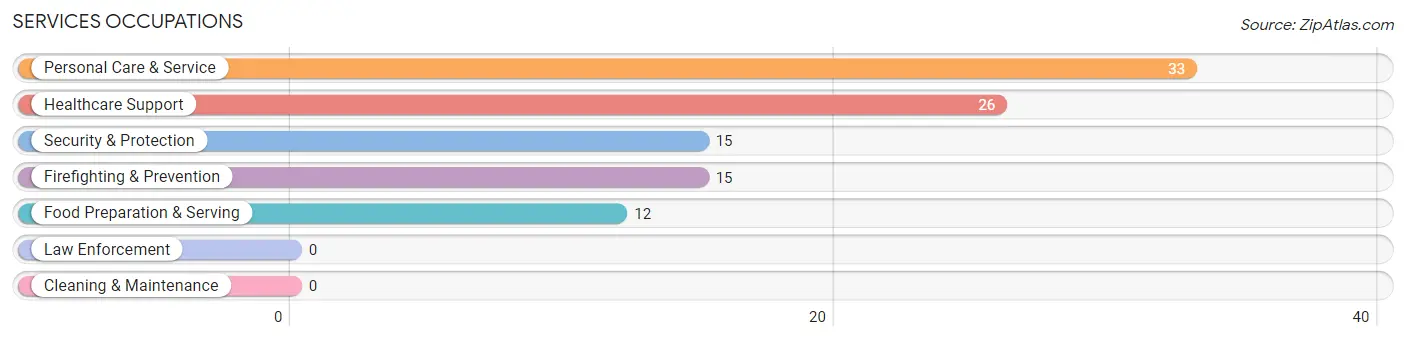
Services Occupations
The most common Services occupations in Santa Rosa Valley are Personal Care & Service (33 | 2.9%), Healthcare Support (26 | 2.3%), Security & Protection (15 | 1.3%), Firefighting & Prevention (15 | 1.3%), and Food Preparation & Serving (12 | 1.1%).
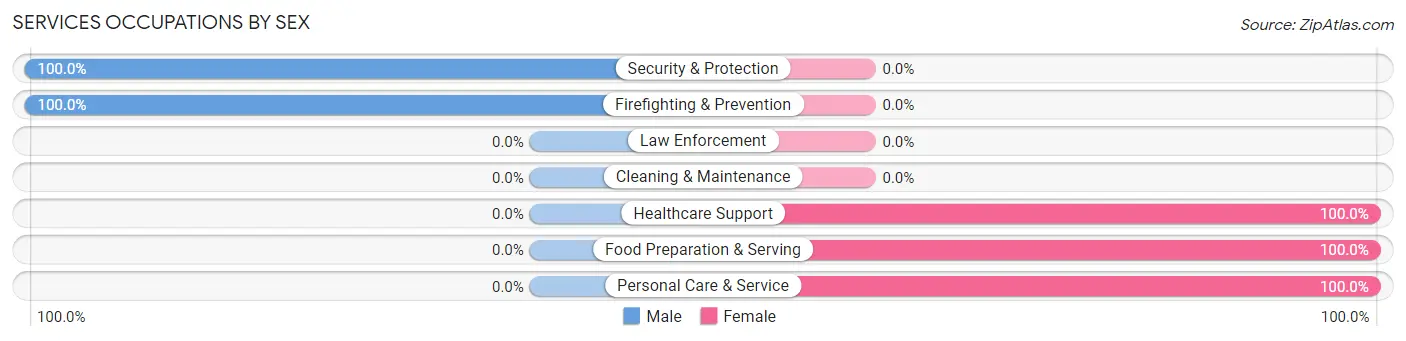
Services Occupations by Sex
Within the Services occupations in Santa Rosa Valley, the most male-oriented occupations are Security & Protection (100.0%), and Firefighting & Prevention (100.0%), while the most female-oriented occupations are Healthcare Support (100.0%), Food Preparation & Serving (100.0%), and Personal Care & Service (100.0%).
| Occupation | Male | Female |
| Healthcare Support | 0 (0.0%) | 26 (100.0%) |
| Security & Protection | 15 (100.0%) | 0 (0.0%) |
| Firefighting & Prevention | 15 (100.0%) | 0 (0.0%) |
| Law Enforcement | 0 (0.0%) | 0 (0.0%) |
| Food Preparation & Serving | 0 (0.0%) | 12 (100.0%) |
| Cleaning & Maintenance | 0 (0.0%) | 0 (0.0%) |
| Personal Care & Service | 0 (0.0%) | 33 (100.0%) |
| Total (Category) | 15 (17.4%) | 71 (82.6%) |
| Total (Overall) | 707 (63.2%) | 412 (36.8%) |
Sales and Office Occupations
The most common Sales and Office occupations in Santa Rosa Valley are Sales & Related (149 | 13.3%), and Office & Administration (108 | 9.7%).
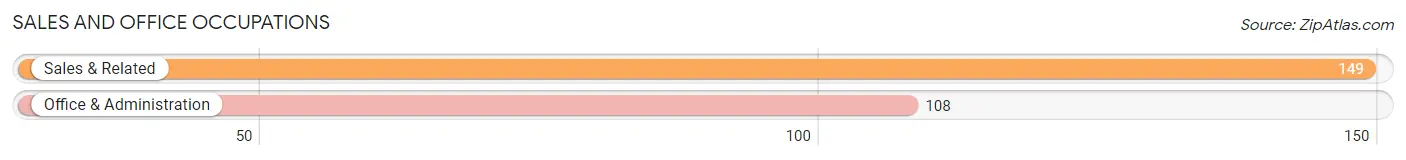
Sales and Office Occupations by Sex
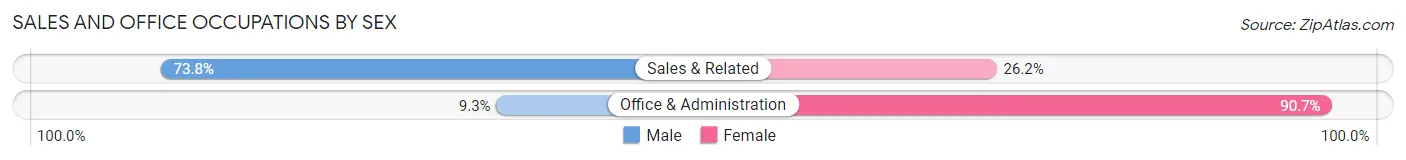
| Occupation | Male | Female |
| Sales & Related | 110 (73.8%) | 39 (26.2%) |
| Office & Administration | 10 (9.3%) | 98 (90.7%) |
| Total (Category) | 120 (46.7%) | 137 (53.3%) |
| Total (Overall) | 707 (63.2%) | 412 (36.8%) |
Natural Resources, Construction and Maintenance Occupations
The most common Natural Resources, Construction and Maintenance occupations in Santa Rosa Valley are , and Construction & Extraction (9 | 0.8%).
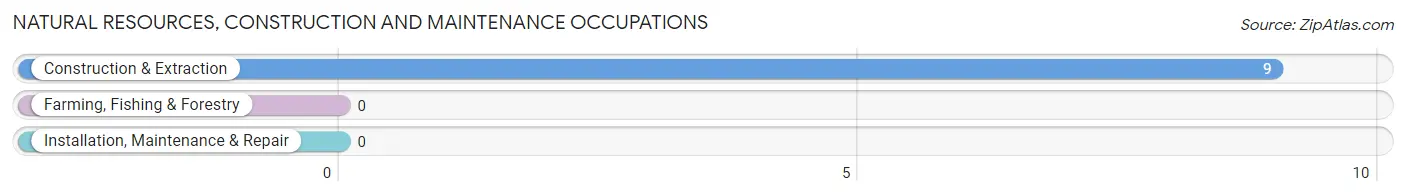
Natural Resources, Construction and Maintenance Occupations by Sex
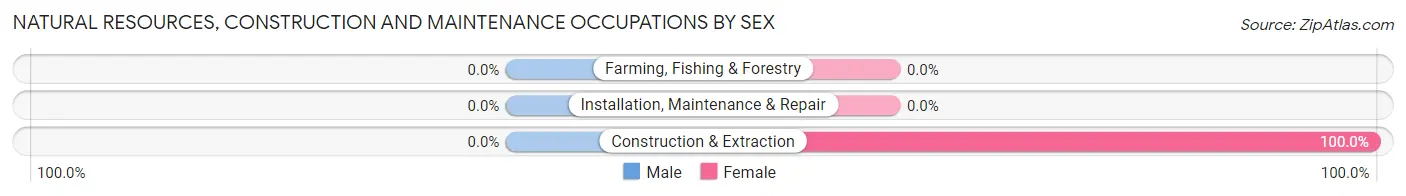
| Occupation | Male | Female |
| Farming, Fishing & Forestry | 0 (0.0%) | 0 (0.0%) |
| Construction & Extraction | 0 (0.0%) | 9 (100.0%) |
| Installation, Maintenance & Repair | 0 (0.0%) | 0 (0.0%) |
| Total (Category) | 0 (0.0%) | 9 (100.0%) |
| Total (Overall) | 707 (63.2%) | 412 (36.8%) |
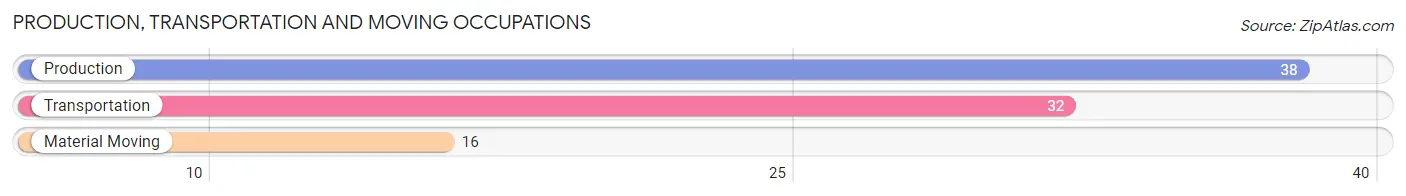
Production, Transportation and Moving Occupations
The most common Production, Transportation and Moving occupations in Santa Rosa Valley are Production (38 | 3.4%), Transportation (32 | 2.9%), and Material Moving (16 | 1.4%).
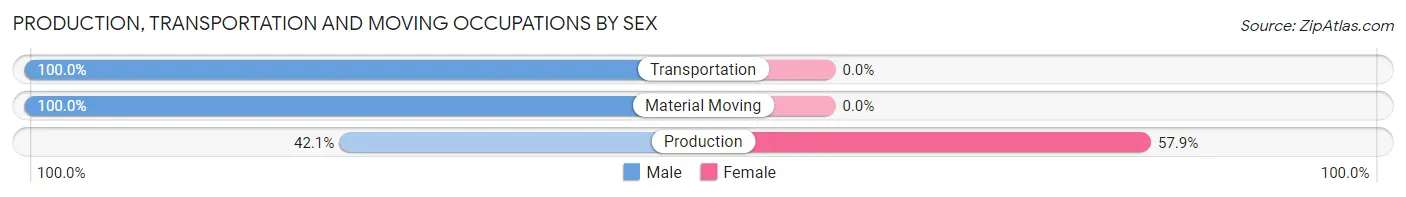
Production, Transportation and Moving Occupations by Sex
| Occupation | Male | Female |
| Production | 16 (42.1%) | 22 (57.9%) |
| Transportation | 32 (100.0%) | 0 (0.0%) |
| Material Moving | 16 (100.0%) | 0 (0.0%) |
| Total (Category) | 64 (74.4%) | 22 (25.6%) |
| Total (Overall) | 707 (63.2%) | 412 (36.8%) |
Employment Industries by Sex in Santa Rosa Valley
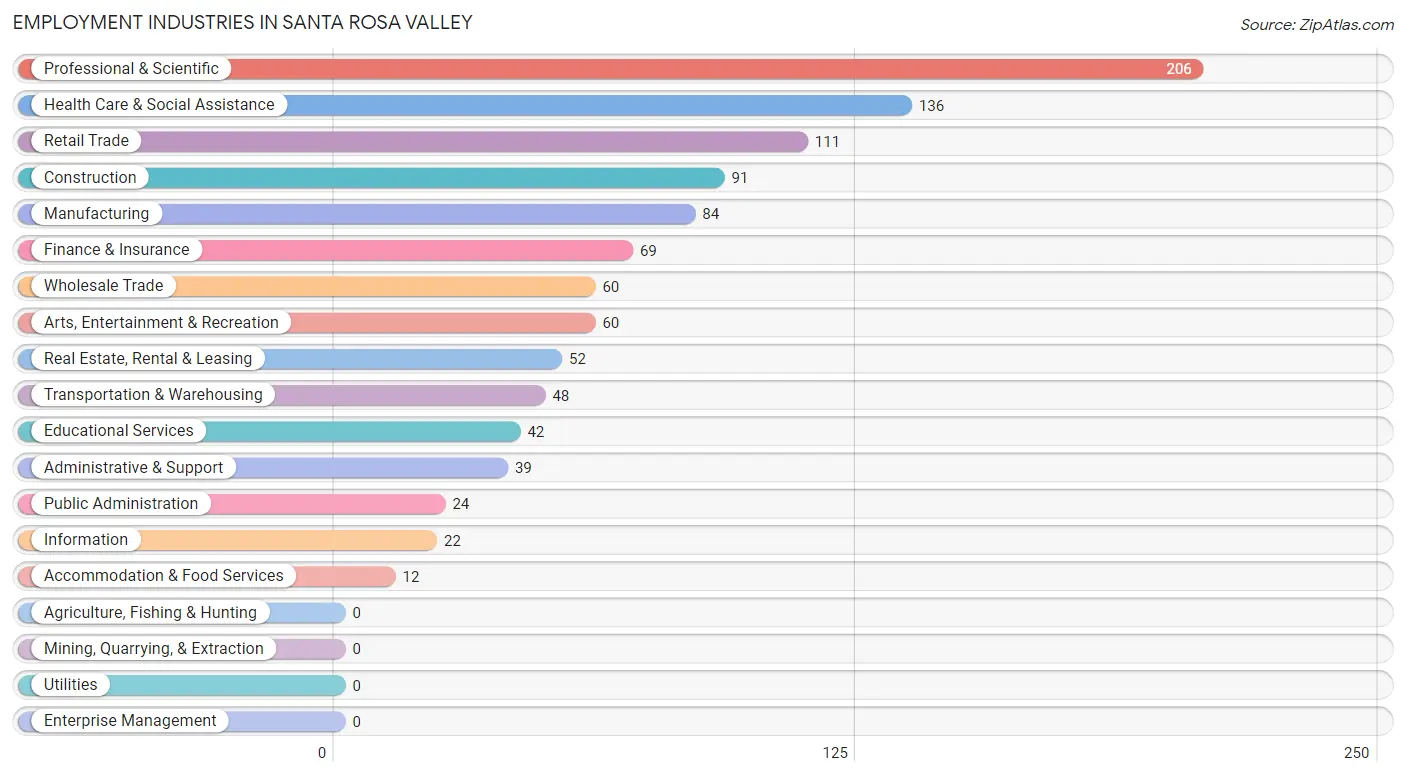
Employment Industries in Santa Rosa Valley
The major employment industries in Santa Rosa Valley include Professional & Scientific (206 | 18.4%), Health Care & Social Assistance (136 | 12.1%), Retail Trade (111 | 9.9%), Construction (91 | 8.1%), and Manufacturing (84 | 7.5%).
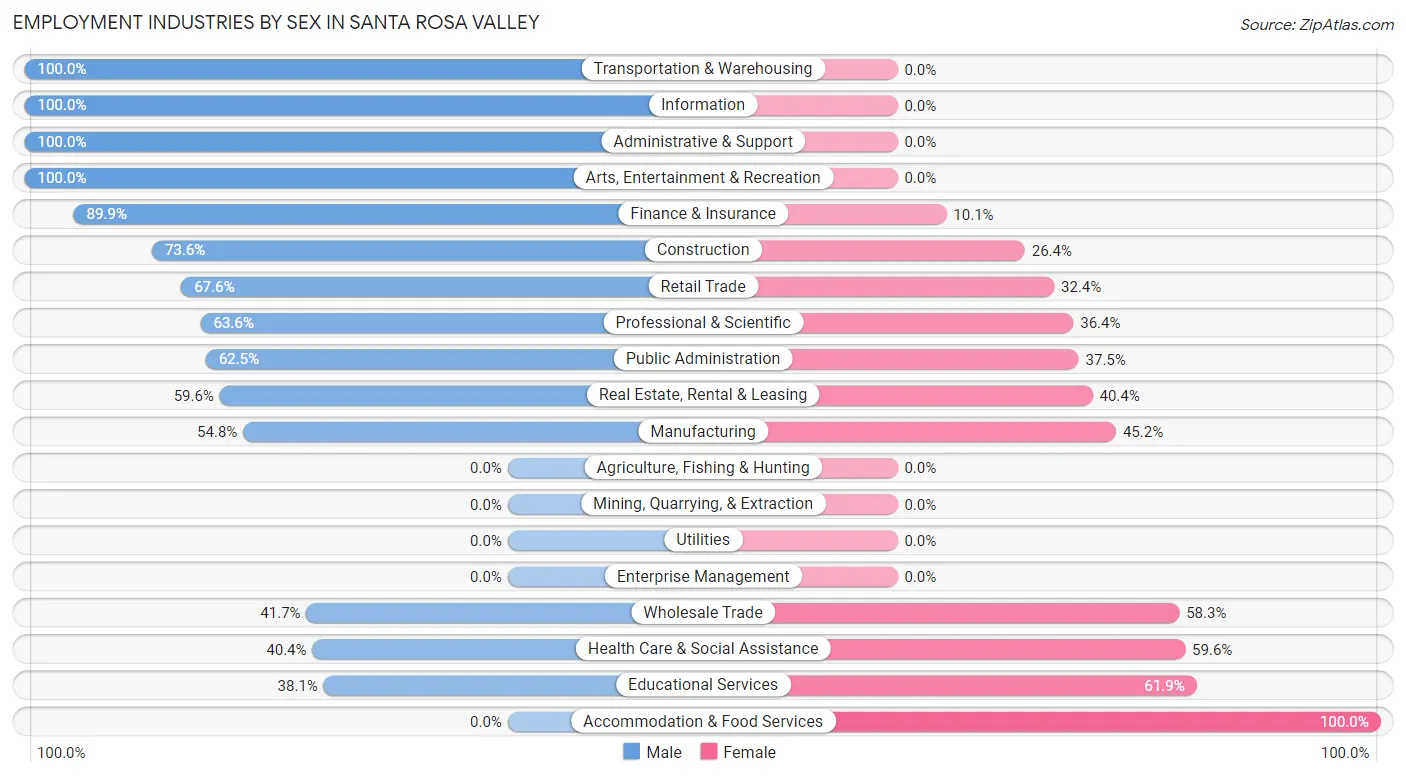
Employment Industries by Sex in Santa Rosa Valley
The Santa Rosa Valley industries that see more men than women are Transportation & Warehousing (100.0%), Information (100.0%), and Administrative & Support (100.0%), whereas the industries that tend to have a higher number of women are Accommodation & Food Services (100.0%), Educational Services (61.9%), and Health Care & Social Assistance (59.6%).
| Industry | Male | Female |
| Agriculture, Fishing & Hunting | 0 (0.0%) | 0 (0.0%) |
| Mining, Quarrying, & Extraction | 0 (0.0%) | 0 (0.0%) |
| Construction | 67 (73.6%) | 24 (26.4%) |
| Manufacturing | 46 (54.8%) | 38 (45.2%) |
| Wholesale Trade | 25 (41.7%) | 35 (58.3%) |
| Retail Trade | 75 (67.6%) | 36 (32.4%) |
| Transportation & Warehousing | 48 (100.0%) | 0 (0.0%) |
| Utilities | 0 (0.0%) | 0 (0.0%) |
| Information | 22 (100.0%) | 0 (0.0%) |
| Finance & Insurance | 62 (89.9%) | 7 (10.1%) |
| Real Estate, Rental & Leasing | 31 (59.6%) | 21 (40.4%) |
| Professional & Scientific | 131 (63.6%) | 75 (36.4%) |
| Enterprise Management | 0 (0.0%) | 0 (0.0%) |
| Administrative & Support | 39 (100.0%) | 0 (0.0%) |
| Educational Services | 16 (38.1%) | 26 (61.9%) |
| Health Care & Social Assistance | 55 (40.4%) | 81 (59.6%) |
| Arts, Entertainment & Recreation | 60 (100.0%) | 0 (0.0%) |
| Accommodation & Food Services | 0 (0.0%) | 12 (100.0%) |
| Public Administration | 15 (62.5%) | 9 (37.5%) |
| Total | 707 (63.2%) | 412 (36.8%) |
Education in Santa Rosa Valley
School Enrollment in Santa Rosa Valley
The most common levels of schooling among the 538 students in Santa Rosa Valley are elementary school (191 | 35.5%), high school (174 | 32.3%), and middle school (116 | 21.6%).
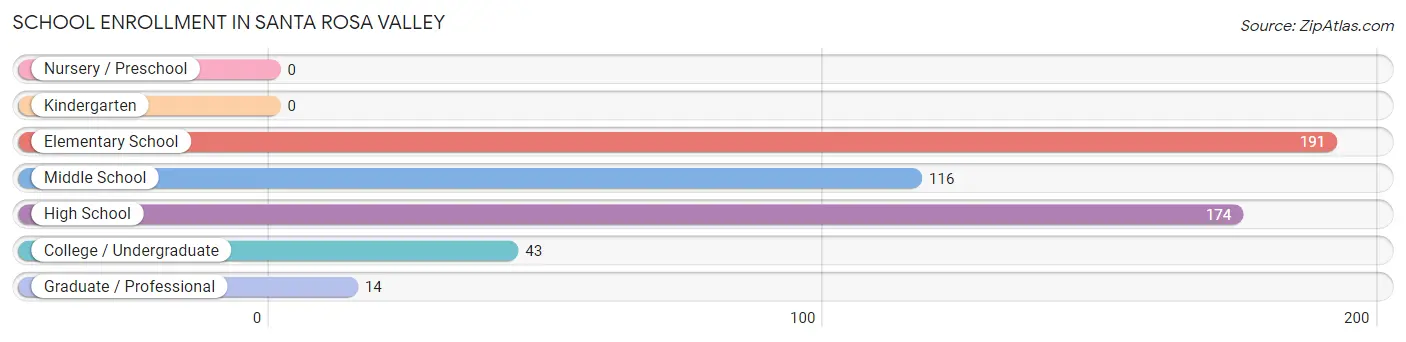
| School Level | # Students | % Students |
| Nursery / Preschool | 0 | 0.0% |
| Kindergarten | 0 | 0.0% |
| Elementary School | 191 | 35.5% |
| Middle School | 116 | 21.6% |
| High School | 174 | 32.3% |
| College / Undergraduate | 43 | 8.0% |
| Graduate / Professional | 14 | 2.6% |
| Total | 538 | 100.0% |
School Enrollment by Age by Funding Source in Santa Rosa Valley
Out of a total of 538 students who are enrolled in schools in Santa Rosa Valley, 133 (24.7%) attend a private institution, while the remaining 405 (75.3%) are enrolled in public schools. The age group of 20 to 24 year olds has the highest likelihood of being enrolled in private schools, with 26 (100.0% in the age bracket) enrolled. Conversely, the age group of 18 to 19 year olds has the lowest likelihood of being enrolled in a private school, with 79 (100.0% in the age bracket) attending a public institution.
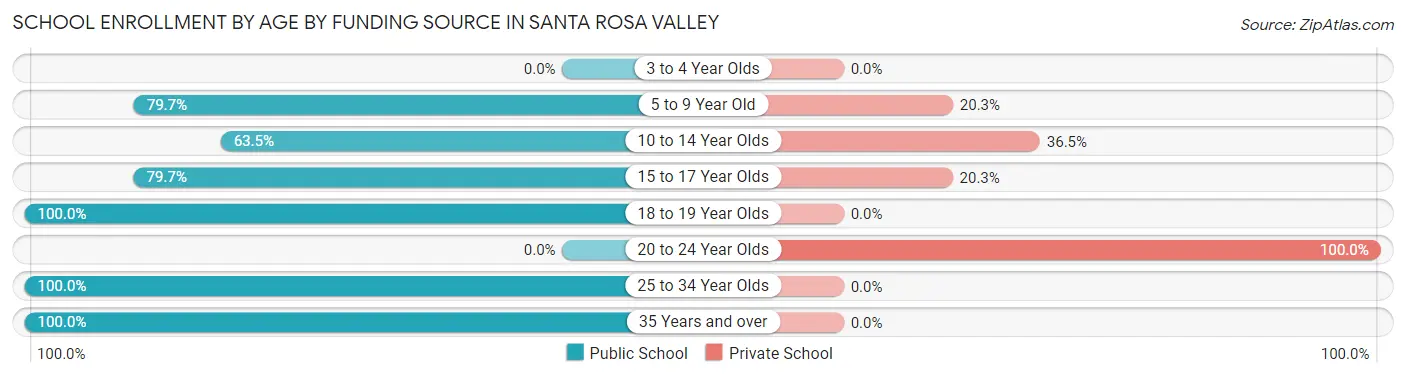
| Age Bracket | Public School | Private School |
| 3 to 4 Year Olds | 0 (0.0%) | 0 (0.0%) |
| 5 to 9 Year Old | 141 (79.7%) | 36 (20.3%) |
| 10 to 14 Year Olds | 99 (63.5%) | 57 (36.5%) |
| 15 to 17 Year Olds | 55 (79.7%) | 14 (20.3%) |
| 18 to 19 Year Olds | 79 (100.0%) | 0 (0.0%) |
| 20 to 24 Year Olds | 0 (0.0%) | 26 (100.0%) |
| 25 to 34 Year Olds | 15 (100.0%) | 0 (0.0%) |
| 35 Years and over | 16 (100.0%) | 0 (0.0%) |
| Total | 405 (75.3%) | 133 (24.7%) |
Educational Attainment by Field of Study in Santa Rosa Valley
Communications (170 | 14.8%), business (151 | 13.2%), social sciences (138 | 12.0%), engineering (123 | 10.7%), and bio, nature & agricultural (120 | 10.5%) are the most common fields of study among 1,147 individuals in Santa Rosa Valley who have obtained a bachelor's degree or higher.
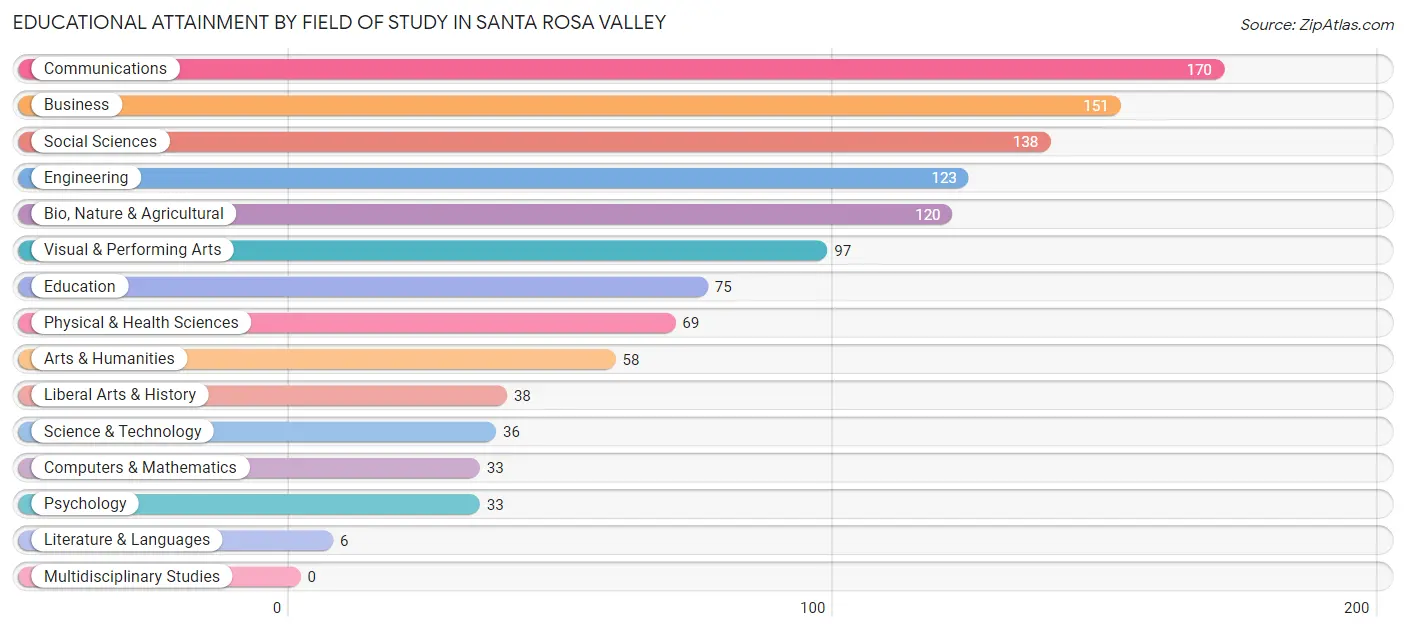
| Field of Study | # Graduates | % Graduates |
| Computers & Mathematics | 33 | 2.9% |
| Bio, Nature & Agricultural | 120 | 10.5% |
| Physical & Health Sciences | 69 | 6.0% |
| Psychology | 33 | 2.9% |
| Social Sciences | 138 | 12.0% |
| Engineering | 123 | 10.7% |
| Multidisciplinary Studies | 0 | 0.0% |
| Science & Technology | 36 | 3.1% |
| Business | 151 | 13.2% |
| Education | 75 | 6.5% |
| Literature & Languages | 6 | 0.5% |
| Liberal Arts & History | 38 | 3.3% |
| Visual & Performing Arts | 97 | 8.5% |
| Communications | 170 | 14.8% |
| Arts & Humanities | 58 | 5.1% |
| Total | 1,147 | 100.0% |
Transportation & Commute in Santa Rosa Valley
Vehicle Availability by Sex in Santa Rosa Valley
The most prevalent vehicle ownership categories in Santa Rosa Valley are males with 3 vehicles (241, accounting for 34.3%) and females with 3 vehicles (104, making up 60.0%).
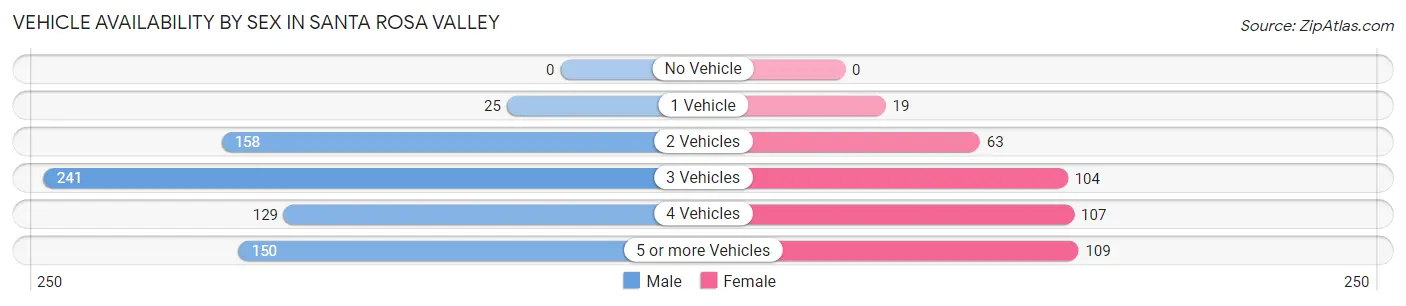
| Vehicles Available | Male | Female |
| No Vehicle | 0 (0.0%) | 0 (0.0%) |
| 1 Vehicle | 25 (3.6%) | 19 (4.7%) |
| 2 Vehicles | 158 (22.5%) | 63 (15.7%) |
| 3 Vehicles | 241 (34.3%) | 104 (25.9%) |
| 4 Vehicles | 129 (18.3%) | 107 (26.6%) |
| 5 or more Vehicles | 150 (21.3%) | 109 (27.1%) |
| Total | 703 (100.0%) | 402 (100.0%) |
Commute Time in Santa Rosa Valley
The most frequently occuring commute durations in Santa Rosa Valley are 15 to 19 minutes (175 commuters, 23.1%), 45 to 59 minutes (139 commuters, 18.3%), and 30 to 34 minutes (134 commuters, 17.7%).
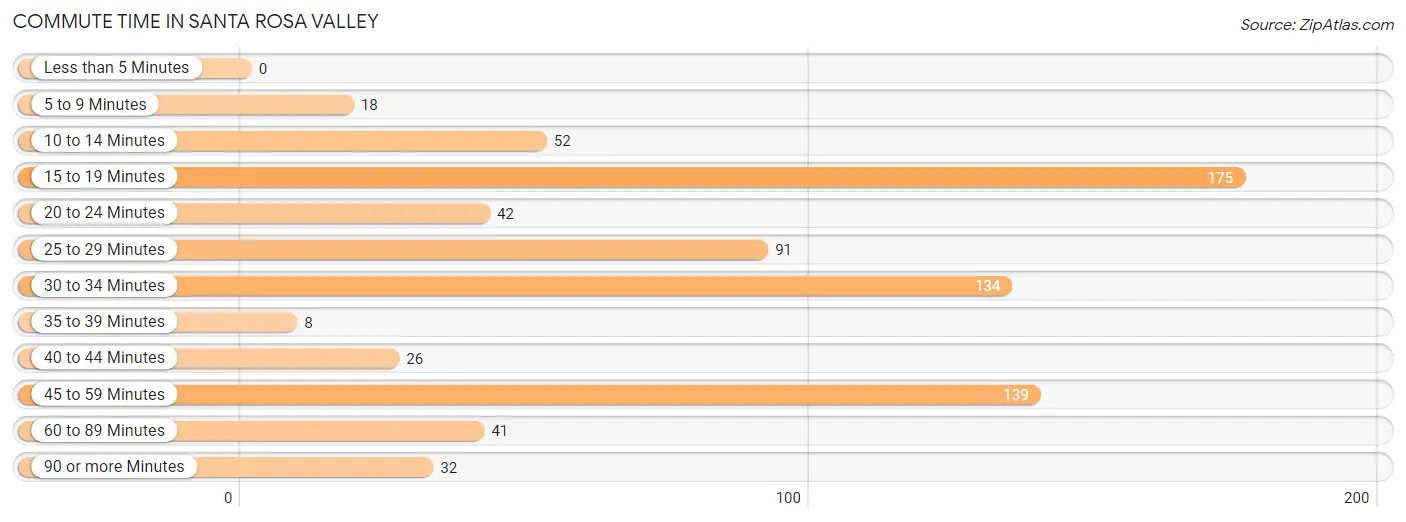
| Commute Time | # Commuters | % Commuters |
| Less than 5 Minutes | 0 | 0.0% |
| 5 to 9 Minutes | 18 | 2.4% |
| 10 to 14 Minutes | 52 | 6.9% |
| 15 to 19 Minutes | 175 | 23.1% |
| 20 to 24 Minutes | 42 | 5.5% |
| 25 to 29 Minutes | 91 | 12.0% |
| 30 to 34 Minutes | 134 | 17.7% |
| 35 to 39 Minutes | 8 | 1.1% |
| 40 to 44 Minutes | 26 | 3.4% |
| 45 to 59 Minutes | 139 | 18.3% |
| 60 to 89 Minutes | 41 | 5.4% |
| 90 or more Minutes | 32 | 4.2% |
Commute Time by Sex in Santa Rosa Valley
The most common commute times in Santa Rosa Valley are 45 to 59 minutes (139 commuters, 26.1%) for males and 15 to 19 minutes (101 commuters, 44.9%) for females.
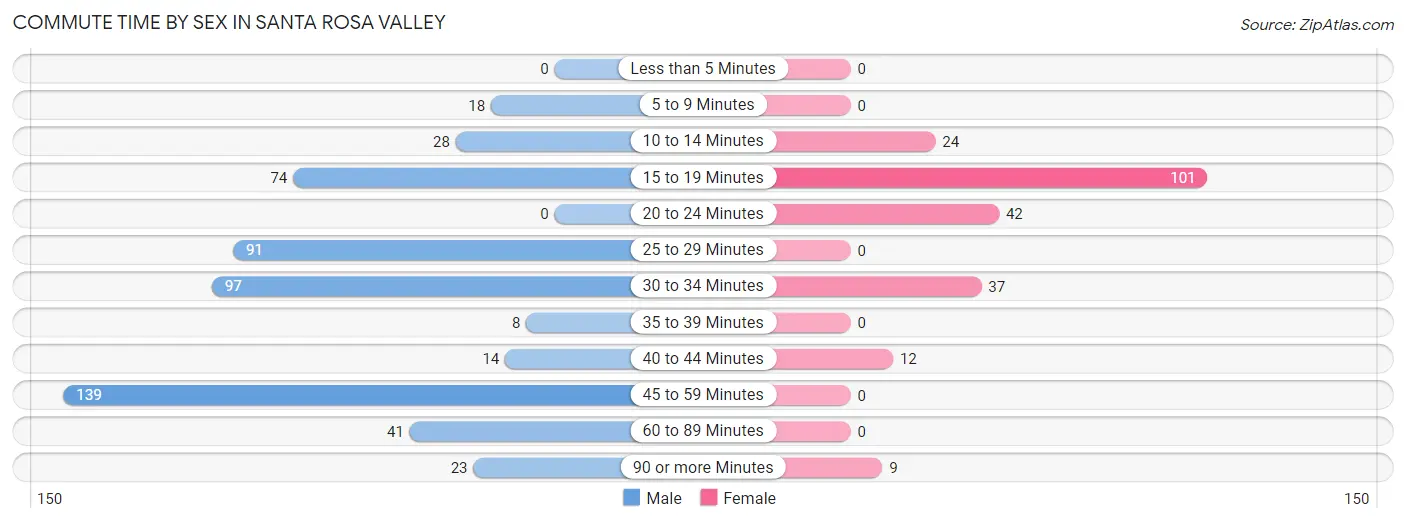
| Commute Time | Male | Female |
| Less than 5 Minutes | 0 (0.0%) | 0 (0.0%) |
| 5 to 9 Minutes | 18 (3.4%) | 0 (0.0%) |
| 10 to 14 Minutes | 28 (5.2%) | 24 (10.7%) |
| 15 to 19 Minutes | 74 (13.9%) | 101 (44.9%) |
| 20 to 24 Minutes | 0 (0.0%) | 42 (18.7%) |
| 25 to 29 Minutes | 91 (17.1%) | 0 (0.0%) |
| 30 to 34 Minutes | 97 (18.2%) | 37 (16.4%) |
| 35 to 39 Minutes | 8 (1.5%) | 0 (0.0%) |
| 40 to 44 Minutes | 14 (2.6%) | 12 (5.3%) |
| 45 to 59 Minutes | 139 (26.1%) | 0 (0.0%) |
| 60 to 89 Minutes | 41 (7.7%) | 0 (0.0%) |
| 90 or more Minutes | 23 (4.3%) | 9 (4.0%) |
Time of Departure to Work by Sex in Santa Rosa Valley
The most frequent times of departure to work in Santa Rosa Valley are 6:30 AM to 6:59 AM (108, 20.3%) for males and 9:00 AM to 9:59 AM (69, 30.7%) for females.
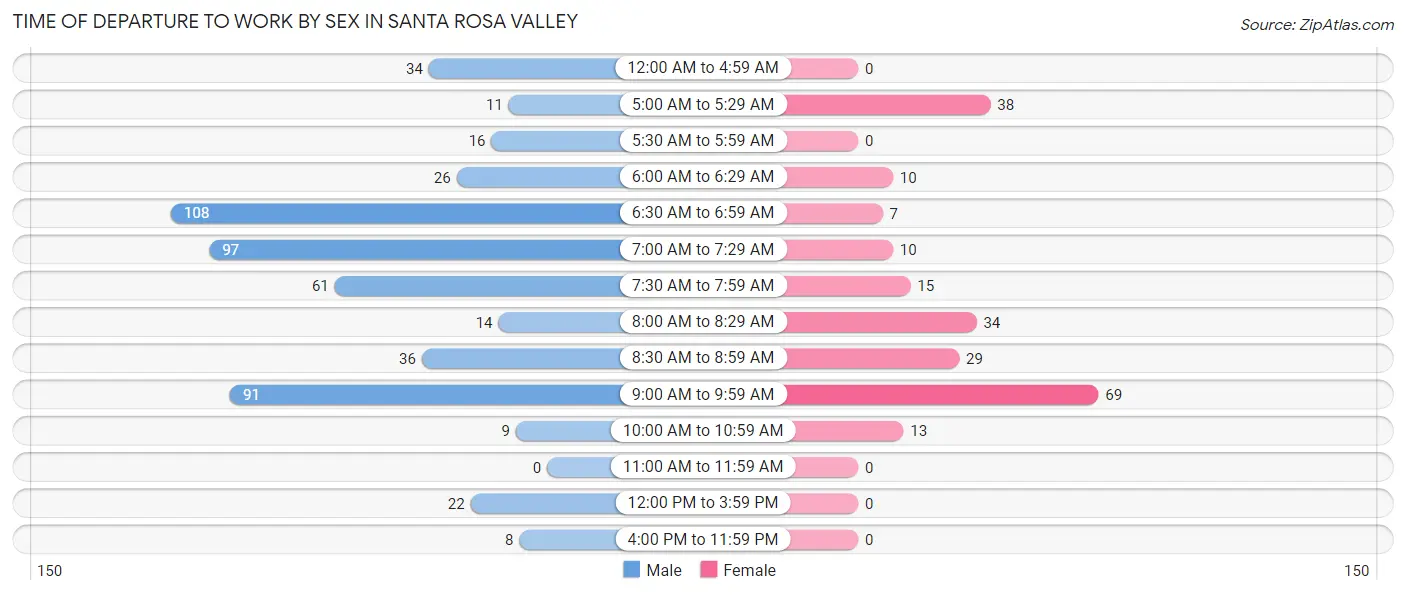
| Time of Departure | Male | Female |
| 12:00 AM to 4:59 AM | 34 (6.4%) | 0 (0.0%) |
| 5:00 AM to 5:29 AM | 11 (2.1%) | 38 (16.9%) |
| 5:30 AM to 5:59 AM | 16 (3.0%) | 0 (0.0%) |
| 6:00 AM to 6:29 AM | 26 (4.9%) | 10 (4.4%) |
| 6:30 AM to 6:59 AM | 108 (20.3%) | 7 (3.1%) |
| 7:00 AM to 7:29 AM | 97 (18.2%) | 10 (4.4%) |
| 7:30 AM to 7:59 AM | 61 (11.4%) | 15 (6.7%) |
| 8:00 AM to 8:29 AM | 14 (2.6%) | 34 (15.1%) |
| 8:30 AM to 8:59 AM | 36 (6.8%) | 29 (12.9%) |
| 9:00 AM to 9:59 AM | 91 (17.1%) | 69 (30.7%) |
| 10:00 AM to 10:59 AM | 9 (1.7%) | 13 (5.8%) |
| 11:00 AM to 11:59 AM | 0 (0.0%) | 0 (0.0%) |
| 12:00 PM to 3:59 PM | 22 (4.1%) | 0 (0.0%) |
| 4:00 PM to 11:59 PM | 8 (1.5%) | 0 (0.0%) |
| Total | 533 (100.0%) | 225 (100.0%) |
Housing Occupancy in Santa Rosa Valley
Occupancy by Ownership in Santa Rosa Valley
Of the total 877 dwellings in Santa Rosa Valley, owner-occupied units account for 801 (91.3%), while renter-occupied units make up 76 (8.7%).
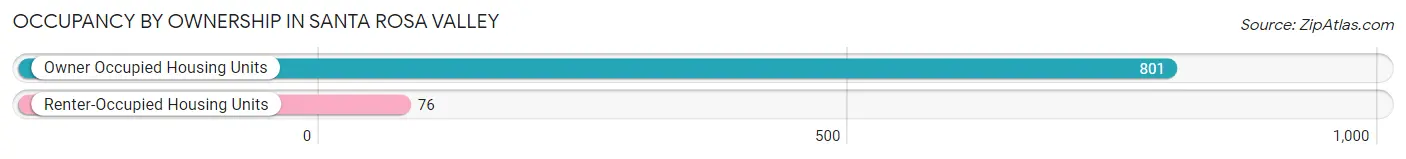
| Occupancy | # Housing Units | % Housing Units |
| Owner Occupied Housing Units | 801 | 91.3% |
| Renter-Occupied Housing Units | 76 | 8.7% |
| Total Occupied Housing Units | 877 | 100.0% |
Occupancy by Household Size in Santa Rosa Valley
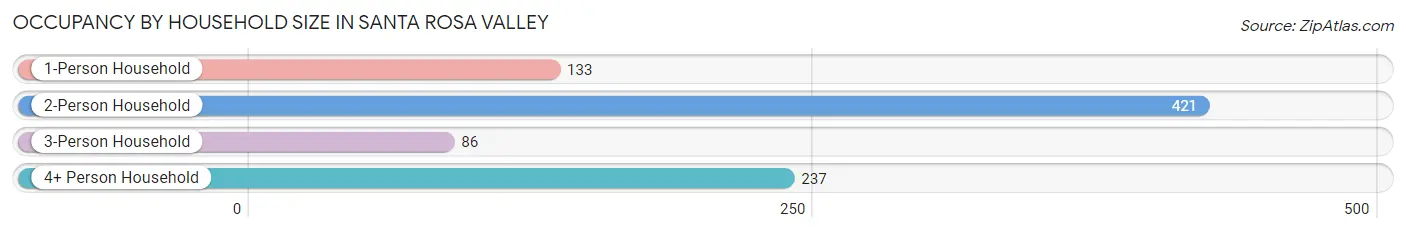
| Household Size | # Housing Units | % Housing Units |
| 1-Person Household | 133 | 15.2% |
| 2-Person Household | 421 | 48.0% |
| 3-Person Household | 86 | 9.8% |
| 4+ Person Household | 237 | 27.0% |
| Total Housing Units | 877 | 100.0% |
Occupancy by Ownership by Household Size in Santa Rosa Valley
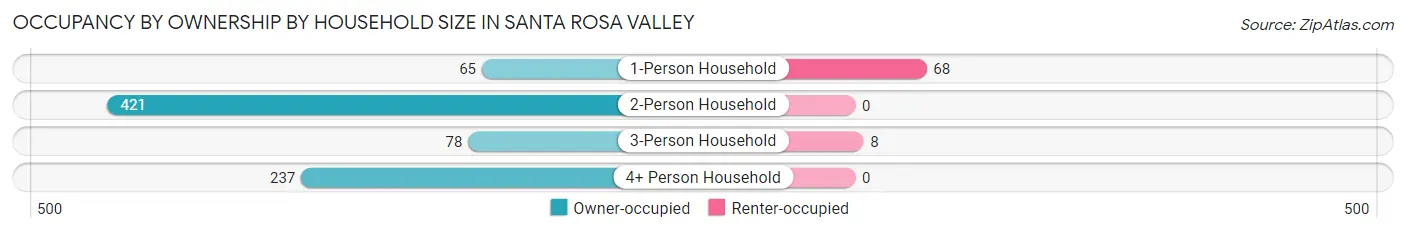
| Household Size | Owner-occupied | Renter-occupied |
| 1-Person Household | 65 (48.9%) | 68 (51.1%) |
| 2-Person Household | 421 (100.0%) | 0 (0.0%) |
| 3-Person Household | 78 (90.7%) | 8 (9.3%) |
| 4+ Person Household | 237 (100.0%) | 0 (0.0%) |
| Total Housing Units | 801 (91.3%) | 76 (8.7%) |
Occupancy by Educational Attainment in Santa Rosa Valley
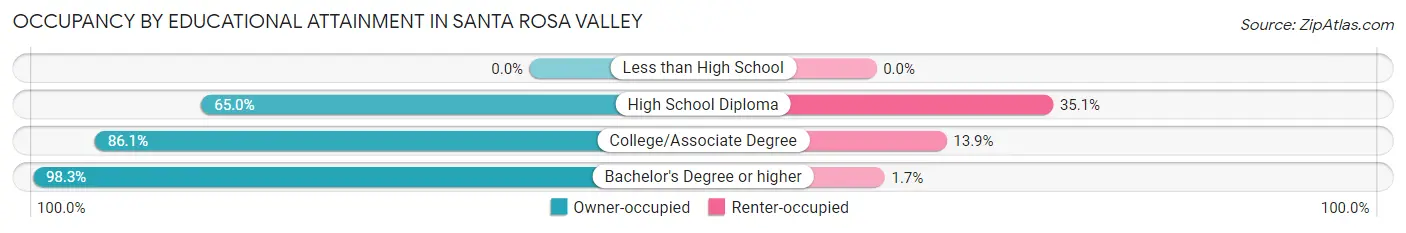
| Household Size | Owner-occupied | Renter-occupied |
| Less than High School | 0 (0.0%) | 0 (0.0%) |
| High School Diploma | 63 (64.9%) | 34 (35.0%) |
| College/Associate Degree | 204 (86.1%) | 33 (13.9%) |
| Bachelor's Degree or higher | 534 (98.3%) | 9 (1.7%) |
Occupancy by Age of Householder in Santa Rosa Valley
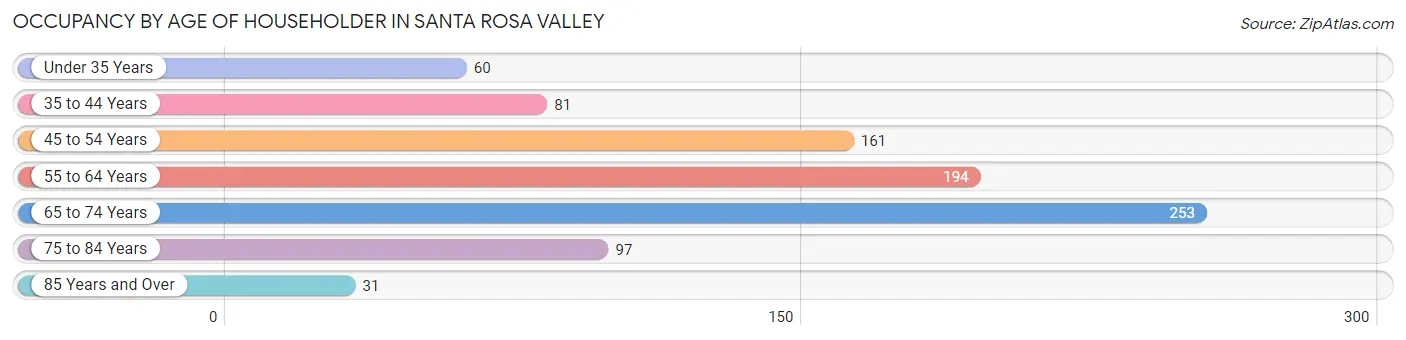
| Age Bracket | # Households | % Households |
| Under 35 Years | 60 | 6.8% |
| 35 to 44 Years | 81 | 9.2% |
| 45 to 54 Years | 161 | 18.4% |
| 55 to 64 Years | 194 | 22.1% |
| 65 to 74 Years | 253 | 28.8% |
| 75 to 84 Years | 97 | 11.1% |
| 85 Years and Over | 31 | 3.5% |
| Total | 877 | 100.0% |
Housing Finances in Santa Rosa Valley
Median Income by Occupancy in Santa Rosa Valley
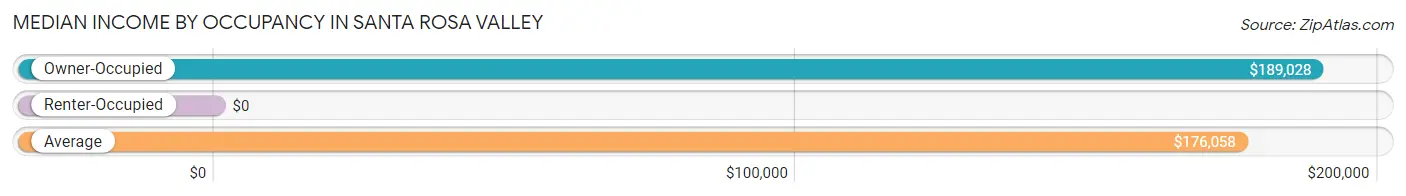
| Occupancy Type | # Households | Median Income |
| Owner-Occupied | 801 (91.3%) | $189,028 |
| Renter-Occupied | 76 (8.7%) | $0 |
| Average | 877 (100.0%) | $176,058 |
Occupancy by Householder Income Bracket in Santa Rosa Valley
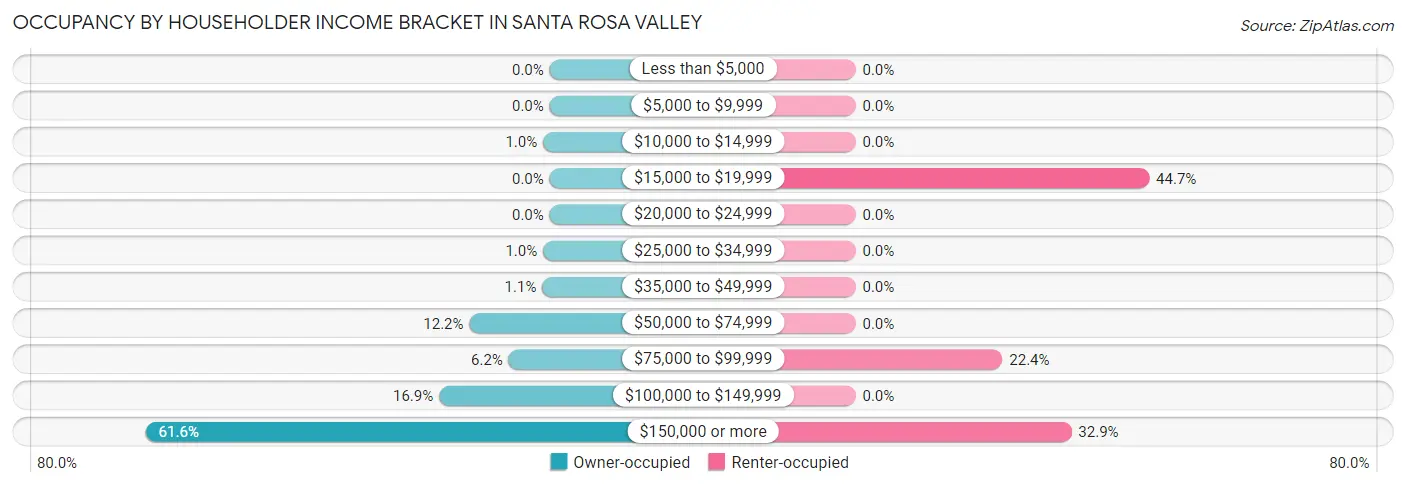
| Income Bracket | Owner-occupied | Renter-occupied |
| Less than $5,000 | 0 (0.0%) | 0 (0.0%) |
| $5,000 to $9,999 | 0 (0.0%) | 0 (0.0%) |
| $10,000 to $14,999 | 8 (1.0%) | 0 (0.0%) |
| $15,000 to $19,999 | 0 (0.0%) | 34 (44.7%) |
| $20,000 to $24,999 | 0 (0.0%) | 0 (0.0%) |
| $25,000 to $34,999 | 8 (1.0%) | 0 (0.0%) |
| $35,000 to $49,999 | 9 (1.1%) | 0 (0.0%) |
| $50,000 to $74,999 | 98 (12.2%) | 0 (0.0%) |
| $75,000 to $99,999 | 50 (6.2%) | 17 (22.4%) |
| $100,000 to $149,999 | 135 (16.9%) | 0 (0.0%) |
| $150,000 or more | 493 (61.6%) | 25 (32.9%) |
| Total | 801 (100.0%) | 76 (100.0%) |
Monthly Housing Cost Tiers in Santa Rosa Valley
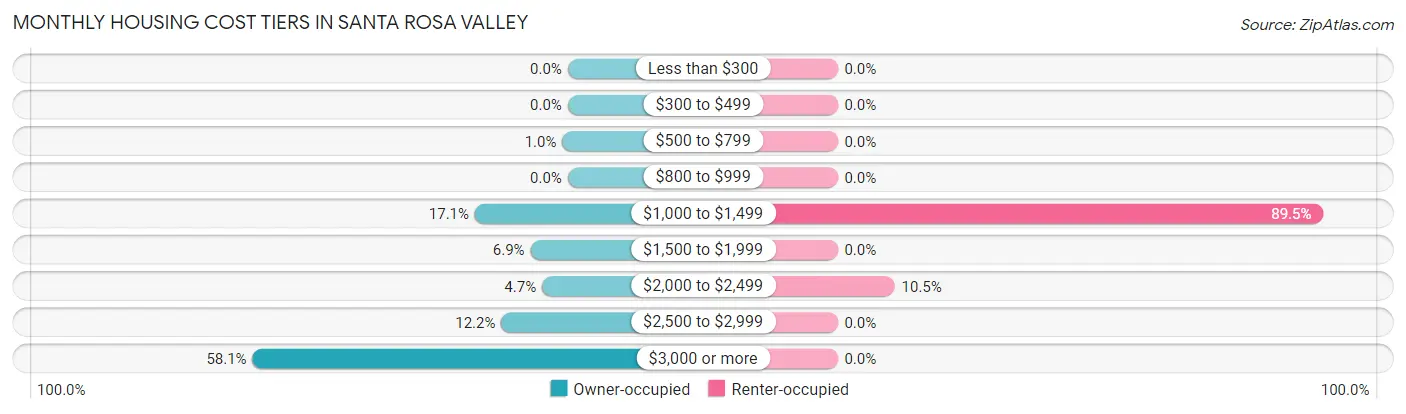
| Monthly Cost | Owner-occupied | Renter-occupied |
| Less than $300 | 0 (0.0%) | 0 (0.0%) |
| $300 to $499 | 0 (0.0%) | 0 (0.0%) |
| $500 to $799 | 8 (1.0%) | 0 (0.0%) |
| $800 to $999 | 0 (0.0%) | 0 (0.0%) |
| $1,000 to $1,499 | 137 (17.1%) | 68 (89.5%) |
| $1,500 to $1,999 | 55 (6.9%) | 0 (0.0%) |
| $2,000 to $2,499 | 38 (4.7%) | 8 (10.5%) |
| $2,500 to $2,999 | 98 (12.2%) | 0 (0.0%) |
| $3,000 or more | 465 (58.1%) | 0 (0.0%) |
| Total | 801 (100.0%) | 76 (100.0%) |
Physical Housing Characteristics in Santa Rosa Valley
Housing Structures in Santa Rosa Valley
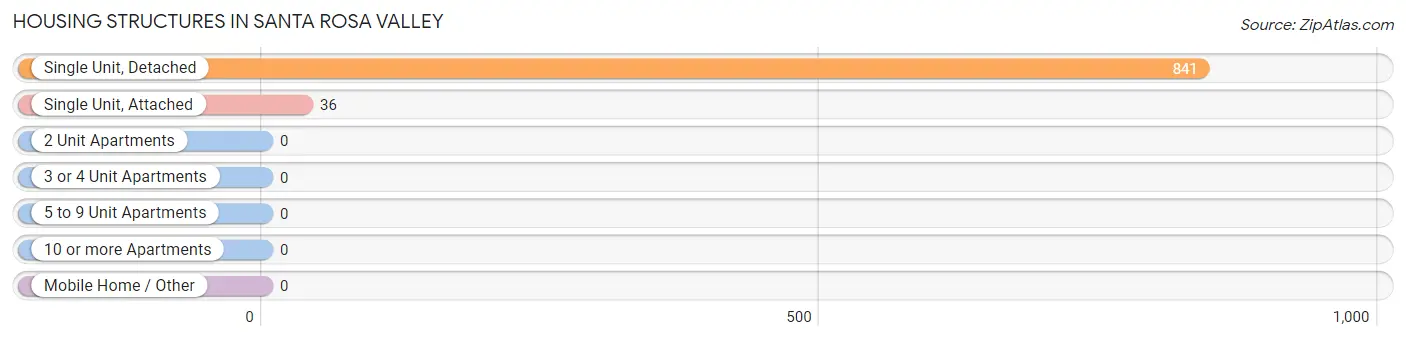
| Structure Type | # Housing Units | % Housing Units |
| Single Unit, Detached | 841 | 95.9% |
| Single Unit, Attached | 36 | 4.1% |
| 2 Unit Apartments | 0 | 0.0% |
| 3 or 4 Unit Apartments | 0 | 0.0% |
| 5 to 9 Unit Apartments | 0 | 0.0% |
| 10 or more Apartments | 0 | 0.0% |
| Mobile Home / Other | 0 | 0.0% |
| Total | 877 | 100.0% |
Housing Structures by Occupancy in Santa Rosa Valley
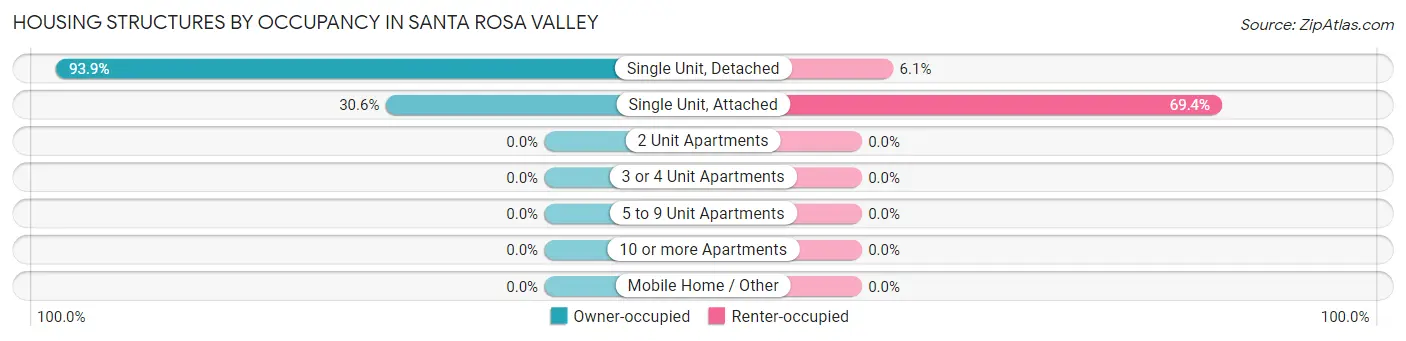
| Structure Type | Owner-occupied | Renter-occupied |
| Single Unit, Detached | 790 (93.9%) | 51 (6.1%) |
| Single Unit, Attached | 11 (30.6%) | 25 (69.4%) |
| 2 Unit Apartments | 0 (0.0%) | 0 (0.0%) |
| 3 or 4 Unit Apartments | 0 (0.0%) | 0 (0.0%) |
| 5 to 9 Unit Apartments | 0 (0.0%) | 0 (0.0%) |
| 10 or more Apartments | 0 (0.0%) | 0 (0.0%) |
| Mobile Home / Other | 0 (0.0%) | 0 (0.0%) |
| Total | 801 (91.3%) | 76 (8.7%) |
Housing Structures by Number of Rooms in Santa Rosa Valley
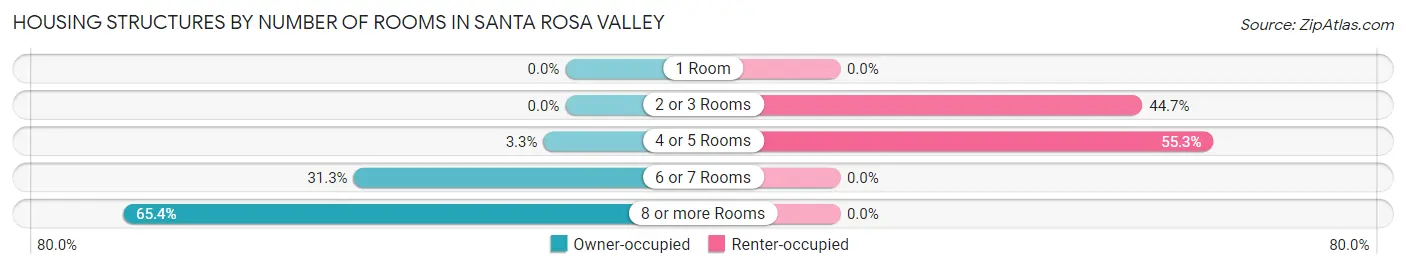
| Number of Rooms | Owner-occupied | Renter-occupied |
| 1 Room | 0 (0.0%) | 0 (0.0%) |
| 2 or 3 Rooms | 0 (0.0%) | 34 (44.7%) |
| 4 or 5 Rooms | 26 (3.3%) | 42 (55.3%) |
| 6 or 7 Rooms | 251 (31.3%) | 0 (0.0%) |
| 8 or more Rooms | 524 (65.4%) | 0 (0.0%) |
| Total | 801 (100.0%) | 76 (100.0%) |
Housing Structure by Heating Type in Santa Rosa Valley
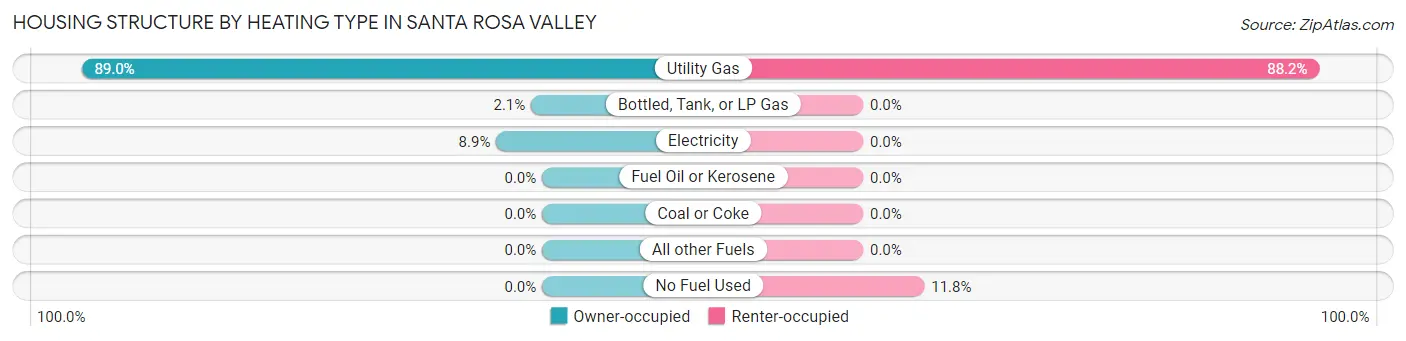
| Heating Type | Owner-occupied | Renter-occupied |
| Utility Gas | 713 (89.0%) | 67 (88.2%) |
| Bottled, Tank, or LP Gas | 17 (2.1%) | 0 (0.0%) |
| Electricity | 71 (8.9%) | 0 (0.0%) |
| Fuel Oil or Kerosene | 0 (0.0%) | 0 (0.0%) |
| Coal or Coke | 0 (0.0%) | 0 (0.0%) |
| All other Fuels | 0 (0.0%) | 0 (0.0%) |
| No Fuel Used | 0 (0.0%) | 9 (11.8%) |
| Total | 801 (100.0%) | 76 (100.0%) |
Household Vehicle Usage in Santa Rosa Valley
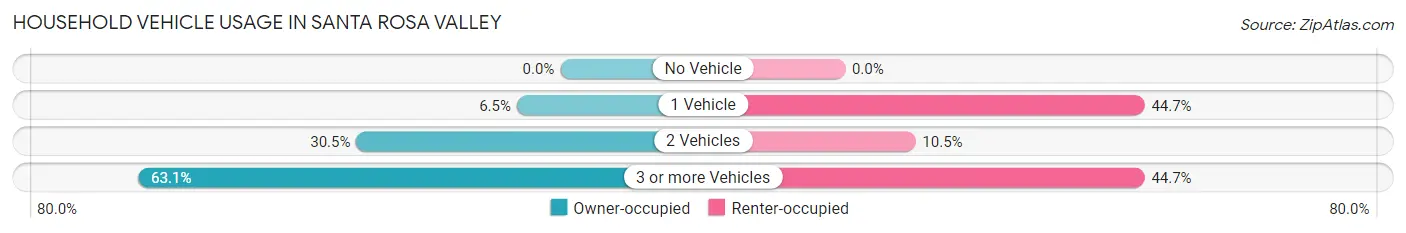
| Vehicles per Household | Owner-occupied | Renter-occupied |
| No Vehicle | 0 (0.0%) | 0 (0.0%) |
| 1 Vehicle | 52 (6.5%) | 34 (44.7%) |
| 2 Vehicles | 244 (30.5%) | 8 (10.5%) |
| 3 or more Vehicles | 505 (63.0%) | 34 (44.7%) |
| Total | 801 (100.0%) | 76 (100.0%) |
Real Estate & Mortgages in Santa Rosa Valley
Real Estate and Mortgage Overview in Santa Rosa Valley
| Characteristic | Without Mortgage | With Mortgage |
| Housing Units | 264 | 537 |
| Median Property Value | $1,354,500 | $1,525,000 |
| Median Household Income | $168,750 | $338 |
| Monthly Housing Costs | $1,461 | $465 |
| Real Estate Taxes | $10,001 | $10 |
Property Value by Mortgage Status in Santa Rosa Valley
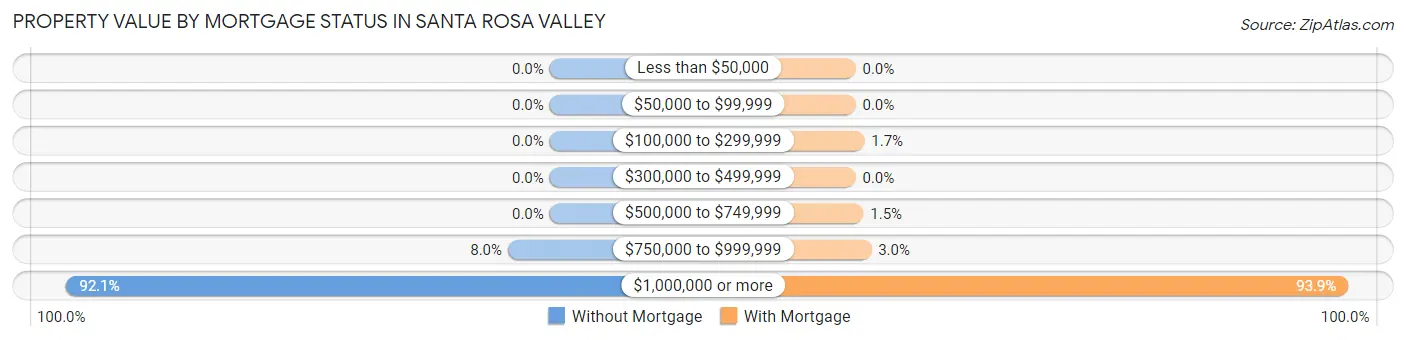
| Property Value | Without Mortgage | With Mortgage |
| Less than $50,000 | 0 (0.0%) | 0 (0.0%) |
| $50,000 to $99,999 | 0 (0.0%) | 0 (0.0%) |
| $100,000 to $299,999 | 0 (0.0%) | 9 (1.7%) |
| $300,000 to $499,999 | 0 (0.0%) | 0 (0.0%) |
| $500,000 to $749,999 | 0 (0.0%) | 8 (1.5%) |
| $750,000 to $999,999 | 21 (8.0%) | 16 (3.0%) |
| $1,000,000 or more | 243 (92.0%) | 504 (93.9%) |
| Total | 264 (100.0%) | 537 (100.0%) |
Household Income by Mortgage Status in Santa Rosa Valley
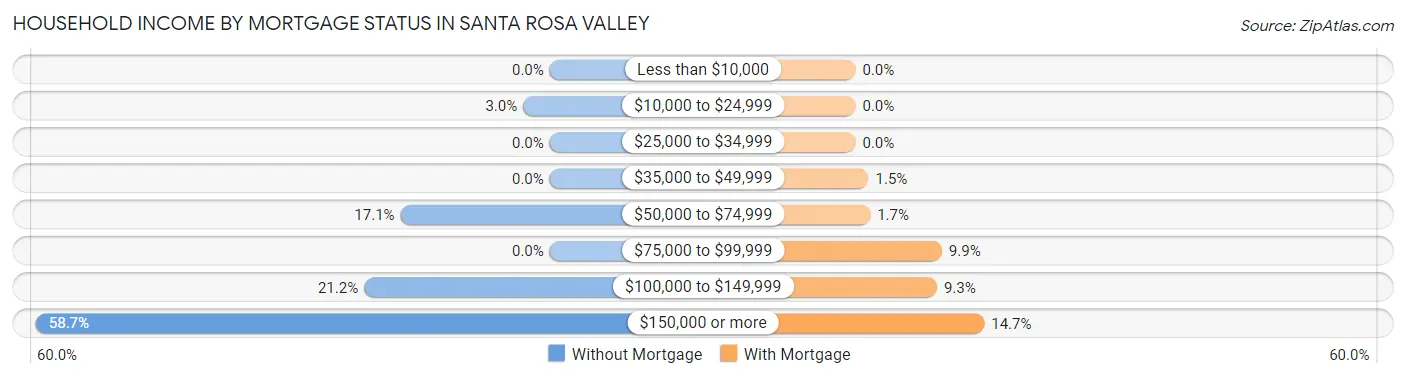
| Household Income | Without Mortgage | With Mortgage |
| Less than $10,000 | 0 (0.0%) | 0 (0.0%) |
| $10,000 to $24,999 | 8 (3.0%) | 0 (0.0%) |
| $25,000 to $34,999 | 0 (0.0%) | 0 (0.0%) |
| $35,000 to $49,999 | 0 (0.0%) | 8 (1.5%) |
| $50,000 to $74,999 | 45 (17.1%) | 9 (1.7%) |
| $75,000 to $99,999 | 0 (0.0%) | 53 (9.9%) |
| $100,000 to $149,999 | 56 (21.2%) | 50 (9.3%) |
| $150,000 or more | 155 (58.7%) | 79 (14.7%) |
| Total | 264 (100.0%) | 537 (100.0%) |
Property Value to Household Income Ratio in Santa Rosa Valley
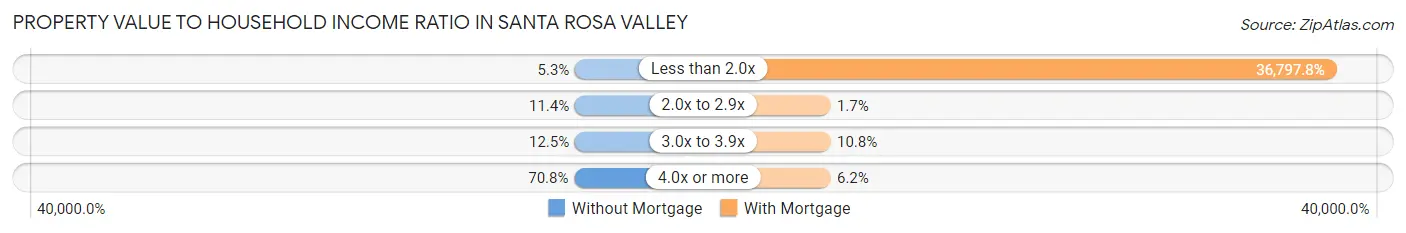
| Value-to-Income Ratio | Without Mortgage | With Mortgage |
| Less than 2.0x | 14 (5.3%) | 197,604 (36,797.8%) |
| 2.0x to 2.9x | 30 (11.4%) | 9 (1.7%) |
| 3.0x to 3.9x | 33 (12.5%) | 58 (10.8%) |
| 4.0x or more | 187 (70.8%) | 33 (6.1%) |
| Total | 264 (100.0%) | 537 (100.0%) |
Real Estate Taxes by Mortgage Status in Santa Rosa Valley
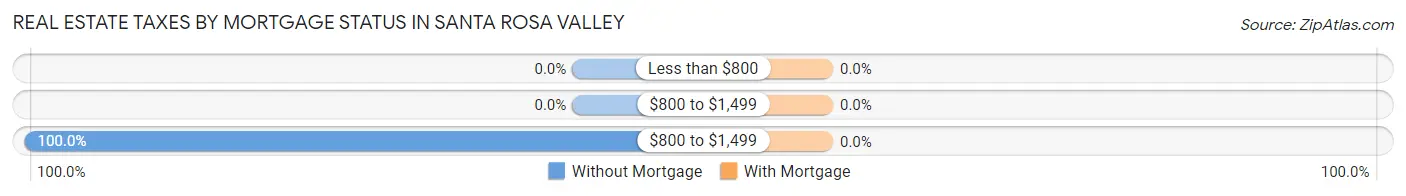
| Property Taxes | Without Mortgage | With Mortgage |
| Less than $800 | 0 (0.0%) | 0 (0.0%) |
| $800 to $1,499 | 0 (0.0%) | 0 (0.0%) |
| $800 to $1,499 | 264 (100.0%) | 0 (0.0%) |
| Total | 264 (100.0%) | 537 (100.0%) |
Health & Disability in Santa Rosa Valley
Health Insurance Coverage by Age in Santa Rosa Valley
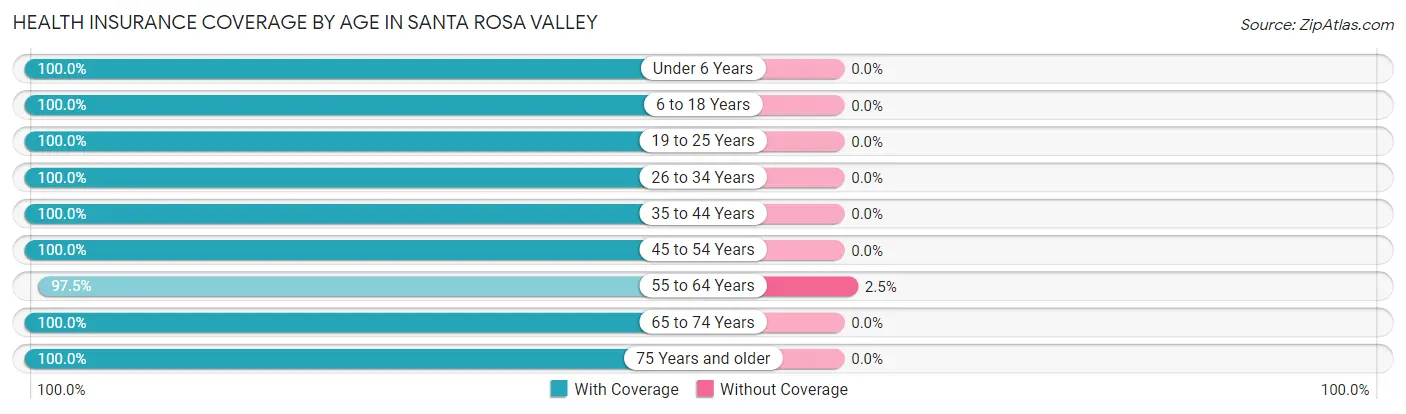
| Age Bracket | With Coverage | Without Coverage |
| Under 6 Years | 16 (100.0%) | 0 (0.0%) |
| 6 to 18 Years | 481 (100.0%) | 0 (0.0%) |
| 19 to 25 Years | 114 (100.0%) | 0 (0.0%) |
| 26 to 34 Years | 219 (100.0%) | 0 (0.0%) |
| 35 to 44 Years | 203 (100.0%) | 0 (0.0%) |
| 45 to 54 Years | 325 (100.0%) | 0 (0.0%) |
| 55 to 64 Years | 422 (97.5%) | 11 (2.5%) |
| 65 to 74 Years | 450 (100.0%) | 0 (0.0%) |
| 75 Years and older | 244 (100.0%) | 0 (0.0%) |
| Total | 2,474 (99.6%) | 11 (0.4%) |
Health Insurance Coverage by Citizenship Status in Santa Rosa Valley
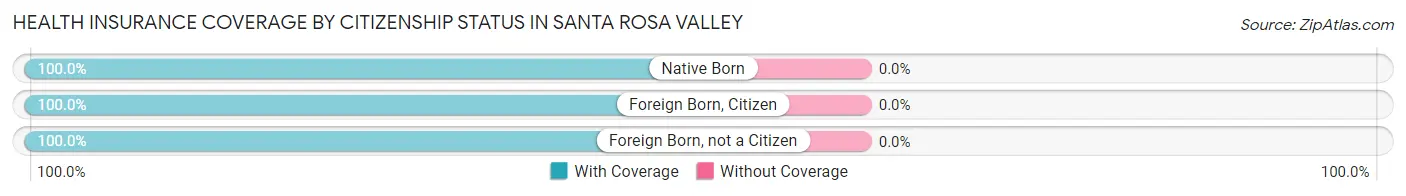
| Citizenship Status | With Coverage | Without Coverage |
| Native Born | 16 (100.0%) | 0 (0.0%) |
| Foreign Born, Citizen | 481 (100.0%) | 0 (0.0%) |
| Foreign Born, not a Citizen | 114 (100.0%) | 0 (0.0%) |
Health Insurance Coverage by Household Income in Santa Rosa Valley
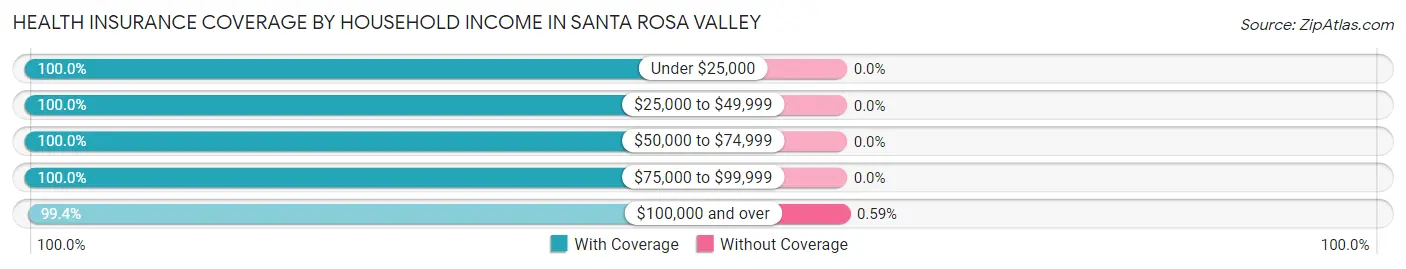
| Household Income | With Coverage | Without Coverage |
| Under $25,000 | 42 (100.0%) | 0 (0.0%) |
| $25,000 to $49,999 | 32 (100.0%) | 0 (0.0%) |
| $50,000 to $74,999 | 308 (100.0%) | 0 (0.0%) |
| $75,000 to $99,999 | 234 (100.0%) | 0 (0.0%) |
| $100,000 and over | 1,858 (99.4%) | 11 (0.6%) |
Public vs Private Health Insurance Coverage by Age in Santa Rosa Valley
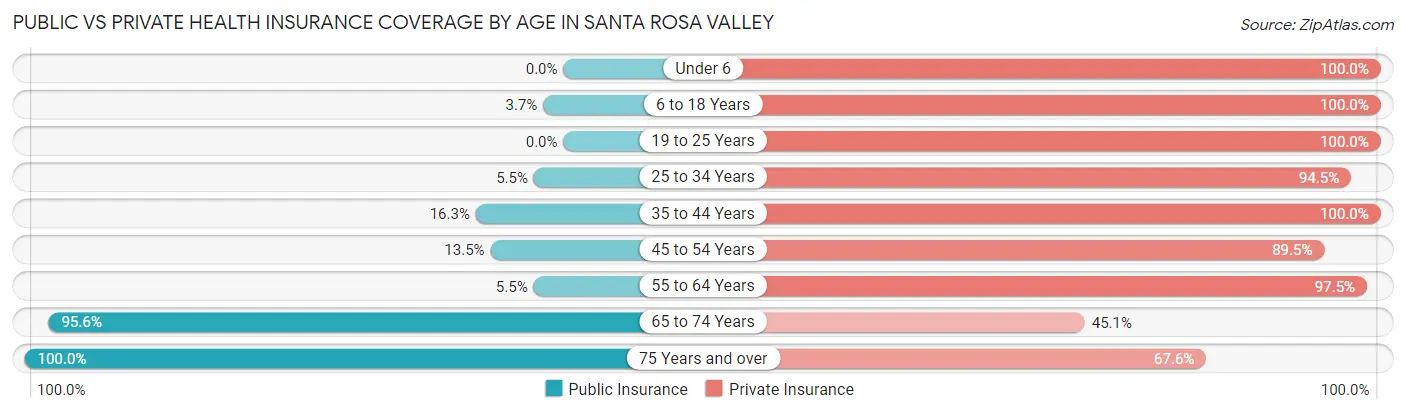
| Age Bracket | Public Insurance | Private Insurance |
| Under 6 | 0 (0.0%) | 16 (100.0%) |
| 6 to 18 Years | 18 (3.7%) | 481 (100.0%) |
| 19 to 25 Years | 0 (0.0%) | 114 (100.0%) |
| 25 to 34 Years | 12 (5.5%) | 207 (94.5%) |
| 35 to 44 Years | 33 (16.3%) | 203 (100.0%) |
| 45 to 54 Years | 44 (13.5%) | 291 (89.5%) |
| 55 to 64 Years | 24 (5.5%) | 422 (97.5%) |
| 65 to 74 Years | 430 (95.6%) | 203 (45.1%) |
| 75 Years and over | 244 (100.0%) | 165 (67.6%) |
| Total | 805 (32.4%) | 2,102 (84.6%) |
Disability Status by Sex by Age in Santa Rosa Valley
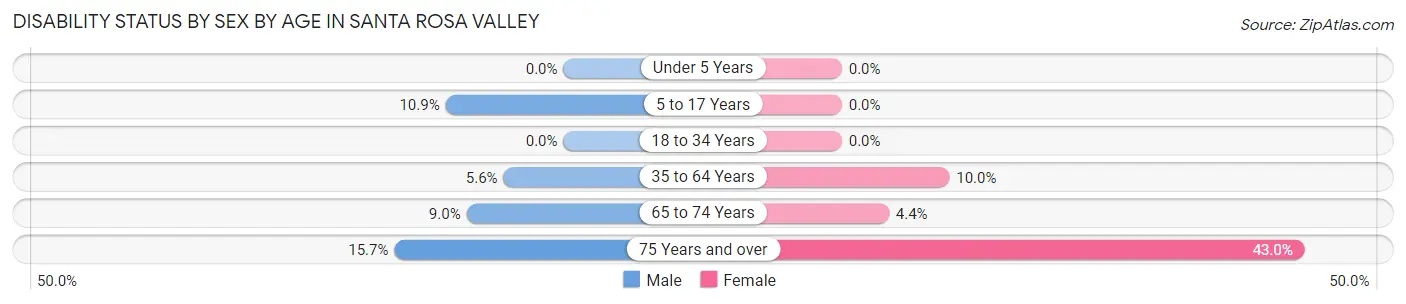
| Age Bracket | Male | Female |
| Under 5 Years | 0 (0.0%) | 0 (0.0%) |
| 5 to 17 Years | 21 (10.9%) | 0 (0.0%) |
| 18 to 34 Years | 0 (0.0%) | 0 (0.0%) |
| 35 to 64 Years | 25 (5.6%) | 51 (10.0%) |
| 65 to 74 Years | 24 (9.0%) | 8 (4.4%) |
| 75 Years and over | 16 (15.7%) | 61 (43.0%) |
Disability Class by Sex by Age in Santa Rosa Valley
Disability Class: Hearing Difficulty
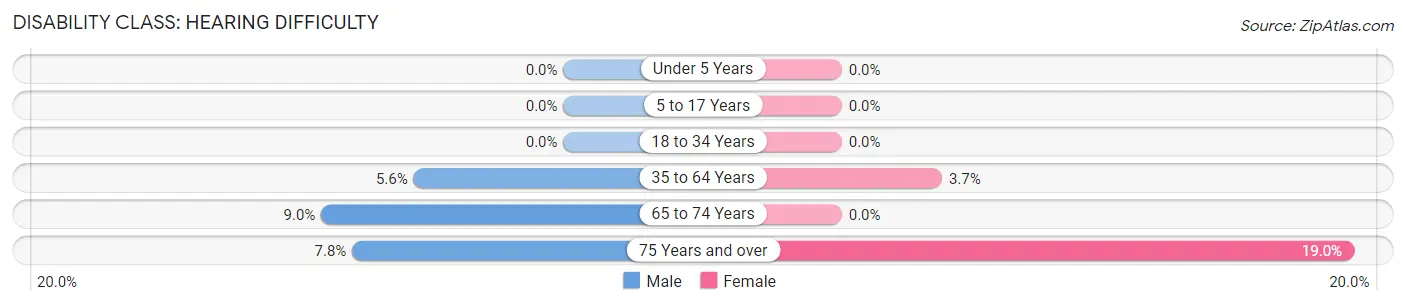
| Age Bracket | Male | Female |
| Under 5 Years | 0 (0.0%) | 0 (0.0%) |
| 5 to 17 Years | 0 (0.0%) | 0 (0.0%) |
| 18 to 34 Years | 0 (0.0%) | 0 (0.0%) |
| 35 to 64 Years | 25 (5.6%) | 19 (3.7%) |
| 65 to 74 Years | 24 (9.0%) | 0 (0.0%) |
| 75 Years and over | 8 (7.8%) | 27 (19.0%) |
Disability Class: Vision Difficulty
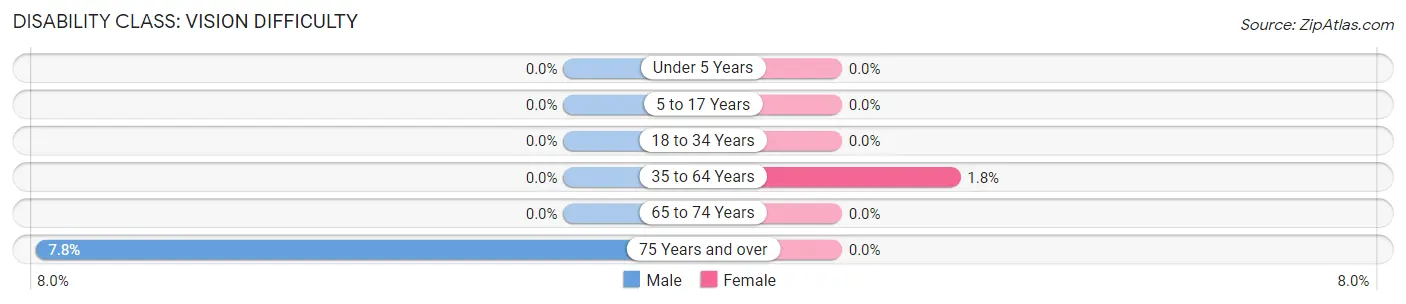
| Age Bracket | Male | Female |
| Under 5 Years | 0 (0.0%) | 0 (0.0%) |
| 5 to 17 Years | 0 (0.0%) | 0 (0.0%) |
| 18 to 34 Years | 0 (0.0%) | 0 (0.0%) |
| 35 to 64 Years | 0 (0.0%) | 9 (1.8%) |
| 65 to 74 Years | 0 (0.0%) | 0 (0.0%) |
| 75 Years and over | 8 (7.8%) | 0 (0.0%) |
Disability Class: Cognitive Difficulty
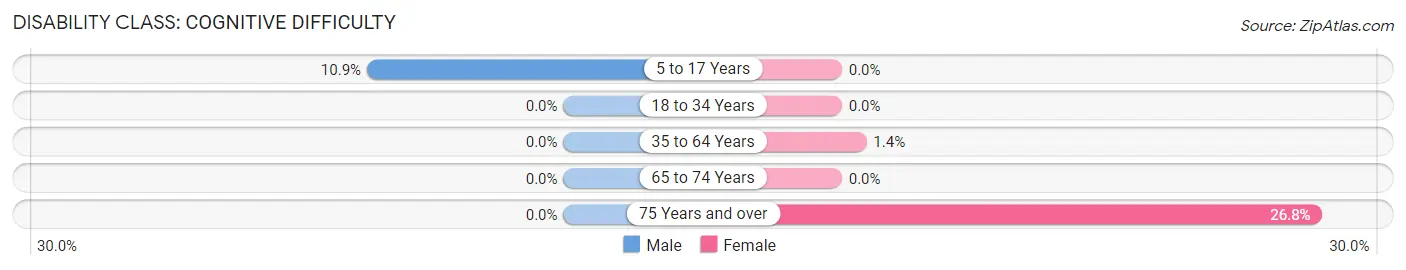
| Age Bracket | Male | Female |
| 5 to 17 Years | 21 (10.9%) | 0 (0.0%) |
| 18 to 34 Years | 0 (0.0%) | 0 (0.0%) |
| 35 to 64 Years | 0 (0.0%) | 7 (1.4%) |
| 65 to 74 Years | 0 (0.0%) | 0 (0.0%) |
| 75 Years and over | 0 (0.0%) | 38 (26.8%) |
Disability Class: Ambulatory Difficulty
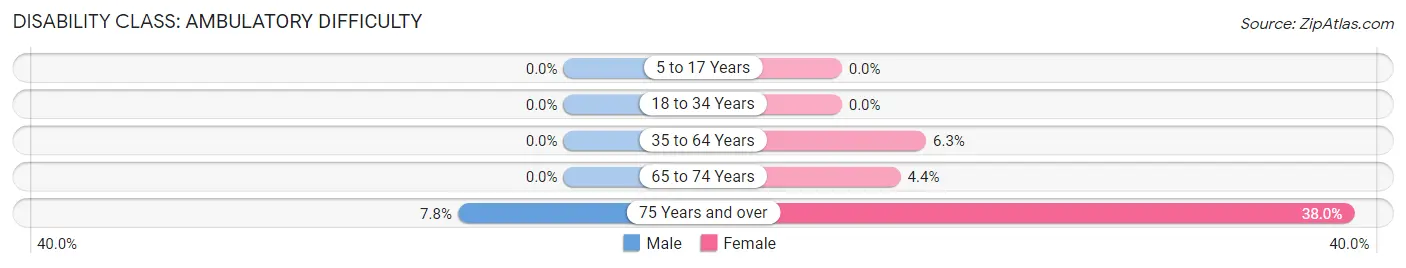
| Age Bracket | Male | Female |
| 5 to 17 Years | 0 (0.0%) | 0 (0.0%) |
| 18 to 34 Years | 0 (0.0%) | 0 (0.0%) |
| 35 to 64 Years | 0 (0.0%) | 32 (6.3%) |
| 65 to 74 Years | 0 (0.0%) | 8 (4.4%) |
| 75 Years and over | 8 (7.8%) | 54 (38.0%) |
Disability Class: Self-Care Difficulty
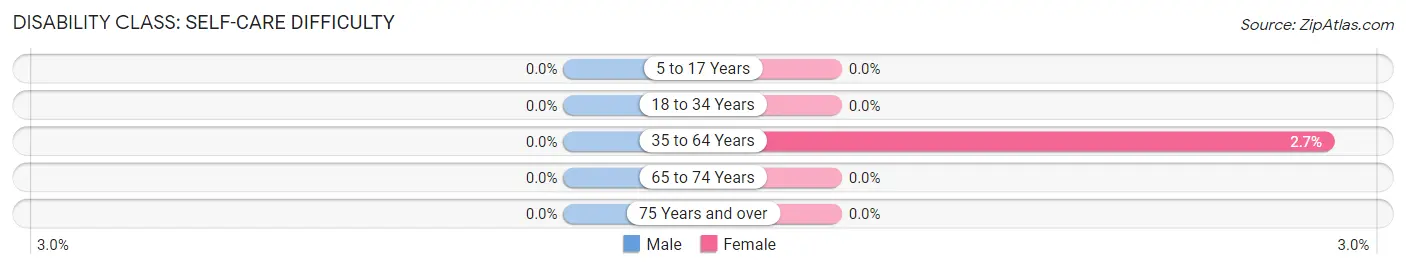
| Age Bracket | Male | Female |
| 5 to 17 Years | 0 (0.0%) | 0 (0.0%) |
| 18 to 34 Years | 0 (0.0%) | 0 (0.0%) |
| 35 to 64 Years | 0 (0.0%) | 14 (2.7%) |
| 65 to 74 Years | 0 (0.0%) | 0 (0.0%) |
| 75 Years and over | 0 (0.0%) | 0 (0.0%) |
Technology Access in Santa Rosa Valley
Computing Device Access in Santa Rosa Valley
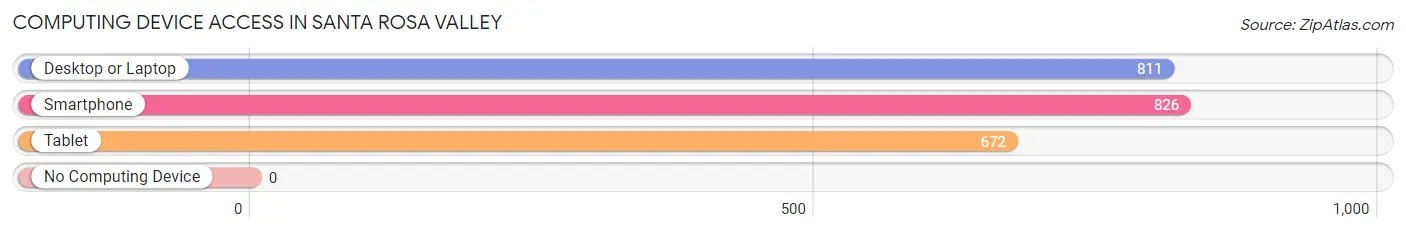
| Device Type | # Households | % Households |
| Desktop or Laptop | 811 | 92.5% |
| Smartphone | 826 | 94.2% |
| Tablet | 672 | 76.6% |
| No Computing Device | 0 | 0.0% |
| Total | 877 | 100.0% |
Internet Access in Santa Rosa Valley
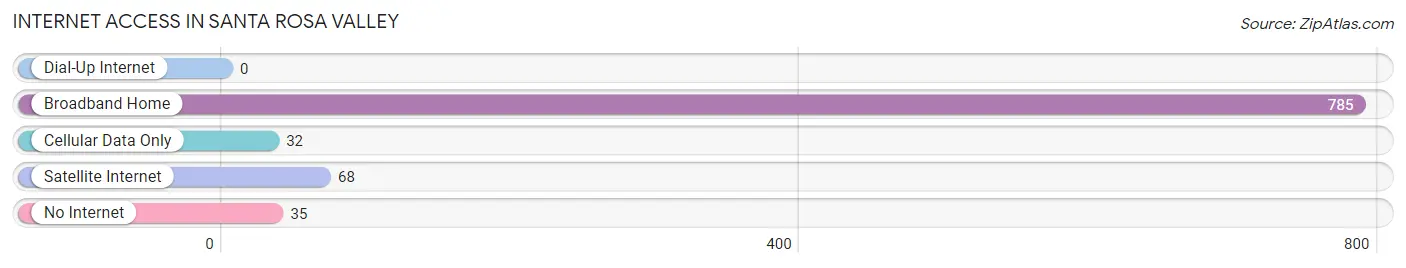
| Internet Type | # Households | % Households |
| Dial-Up Internet | 0 | 0.0% |
| Broadband Home | 785 | 89.5% |
| Cellular Data Only | 32 | 3.6% |
| Satellite Internet | 68 | 7.7% |
| No Internet | 35 | 4.0% |
| Total | 877 | 100.0% |
Santa Rosa Valley Summary
Introduction
Santa Rosa Valley is a small unincorporated community located in Ventura County, California. It is situated in the Santa Rosa Valley, which is a part of the larger Santa Clara River Valley. The community is located in the foothills of the Santa Monica Mountains, and is bordered by the cities of Camarillo and Moorpark. Santa Rosa Valley is a rural community with a population of approximately 4,000 people.
History
The Santa Rosa Valley has a long and rich history. The area was originally inhabited by the Chumash people, who were hunter-gatherers. The Chumash were known for their basket weaving and rock art. The first Europeans to settle in the area were Spanish missionaries, who established the Mission San Buenaventura in 1782. The mission was the ninth of the 21 missions established by the Spanish in California.
The area was later settled by ranchers, who established large cattle ranches in the valley. The area was also home to several Native American villages, including the Chumash village of Hu'wam. The area was also home to the Santa Rosa Valley Oil Field, which was discovered in 1892.
In the early 20th century, the area began to be developed for agriculture. The Santa Rosa Valley was home to several large farms, including the Santa Rosa Valley Fruit Company, which was established in 1912. The company was one of the largest producers of citrus fruits in the area.
Geography
Santa Rosa Valley is located in the Santa Clara River Valley, which is part of the larger Central Valley of California. The valley is bordered by the Santa Monica Mountains to the south and the Topatopa Mountains to the north. The Santa Rosa Valley is approximately 10 miles long and 5 miles wide. The valley is home to several creeks and streams, including the Santa Rosa Creek, which flows through the valley.
The climate in the Santa Rosa Valley is Mediterranean, with hot, dry summers and mild, wet winters. The average annual temperature is around 70 degrees Fahrenheit. The area receives an average of 15 inches of rain per year.
Economy
The economy of Santa Rosa Valley is largely based on agriculture. The area is home to several large farms, including the Santa Rosa Valley Fruit Company, which produces citrus fruits. The area is also home to several wineries, including the Santa Rosa Valley Winery, which produces a variety of wines.
The area is also home to several businesses, including a number of restaurants, retail stores, and professional services. The area is also home to several technology companies, including the Santa Rosa Valley Technology Park, which is home to several high-tech companies.
Demographics
As of the 2010 census, the population of Santa Rosa Valley was 4,039. The population is primarily white (83.3%), with smaller percentages of Hispanic (7.3%), Asian (3.2%), and African American (2.2%) residents. The median household income in the area is $90,000, and the median home value is $541,000.
Conclusion
Santa Rosa Valley is a small unincorporated community located in Ventura County, California. It is situated in the Santa Rosa Valley, which is a part of the larger Santa Clara River Valley. The community is located in the foothills of the Santa Monica Mountains, and is bordered by the cities of Camarillo and Moorpark. Santa Rosa Valley is a rural community with a population of approximately 4,000 people. The economy of the area is largely based on agriculture, with several large farms and wineries located in the area. The population of the area is primarily white, with smaller percentages of Hispanic, Asian, and African American residents.
Common Questions
What is Per Capita Income in Santa Rosa Valley?
Per Capita income in Santa Rosa Valley is $96,141.
What is the Median Family Income in Santa Rosa Valley?
Median Family Income in Santa Rosa Valley is $205,817.
What is the Median Household income in Santa Rosa Valley?
Median Household Income in Santa Rosa Valley is $176,058.
What is Income or Wage Gap in Santa Rosa Valley?
Income or Wage Gap in Santa Rosa Valley is 36.9%.
Women in Santa Rosa Valley earn 63.1 cents for every dollar earned by a man.
What is Inequality or Gini Index in Santa Rosa Valley?
Inequality or Gini Index in Santa Rosa Valley is 0.47.
What is the Total Population of Santa Rosa Valley?
Total Population of Santa Rosa Valley is 2,508.
What is the Total Male Population of Santa Rosa Valley?
Total Male Population of Santa Rosa Valley is 1,245.
What is the Total Female Population of Santa Rosa Valley?
Total Female Population of Santa Rosa Valley is 1,263.
What is the Ratio of Males per 100 Females in Santa Rosa Valley?
There are 98.57 Males per 100 Females in Santa Rosa Valley.
What is the Ratio of Females per 100 Males in Santa Rosa Valley?
There are 101.45 Females per 100 Males in Santa Rosa Valley.
What is the Median Population Age in Santa Rosa Valley?
Median Population Age in Santa Rosa Valley is 52.4 Years.
What is the Average Family Size in Santa Rosa Valley
Average Family Size in Santa Rosa Valley is 3.1 People.
What is the Average Household Size in Santa Rosa Valley
Average Household Size in Santa Rosa Valley is 2.9 People.
How Large is the Labor Force in Santa Rosa Valley?
There are 1,196 People in the Labor Forcein in Santa Rosa Valley.
What is the Percentage of People in the Labor Force in Santa Rosa Valley?
55.4% of People are in the Labor Force in Santa Rosa Valley.
What is the Unemployment Rate in Santa Rosa Valley?
Unemployment Rate in Santa Rosa Valley is 4.7%.