Cities with the Highest Percentage of Households with Income Above $200,000 in Idaho
RELATED REPORTS & OPTIONS
Household Income | $200k+
Idaho
Compare Cities
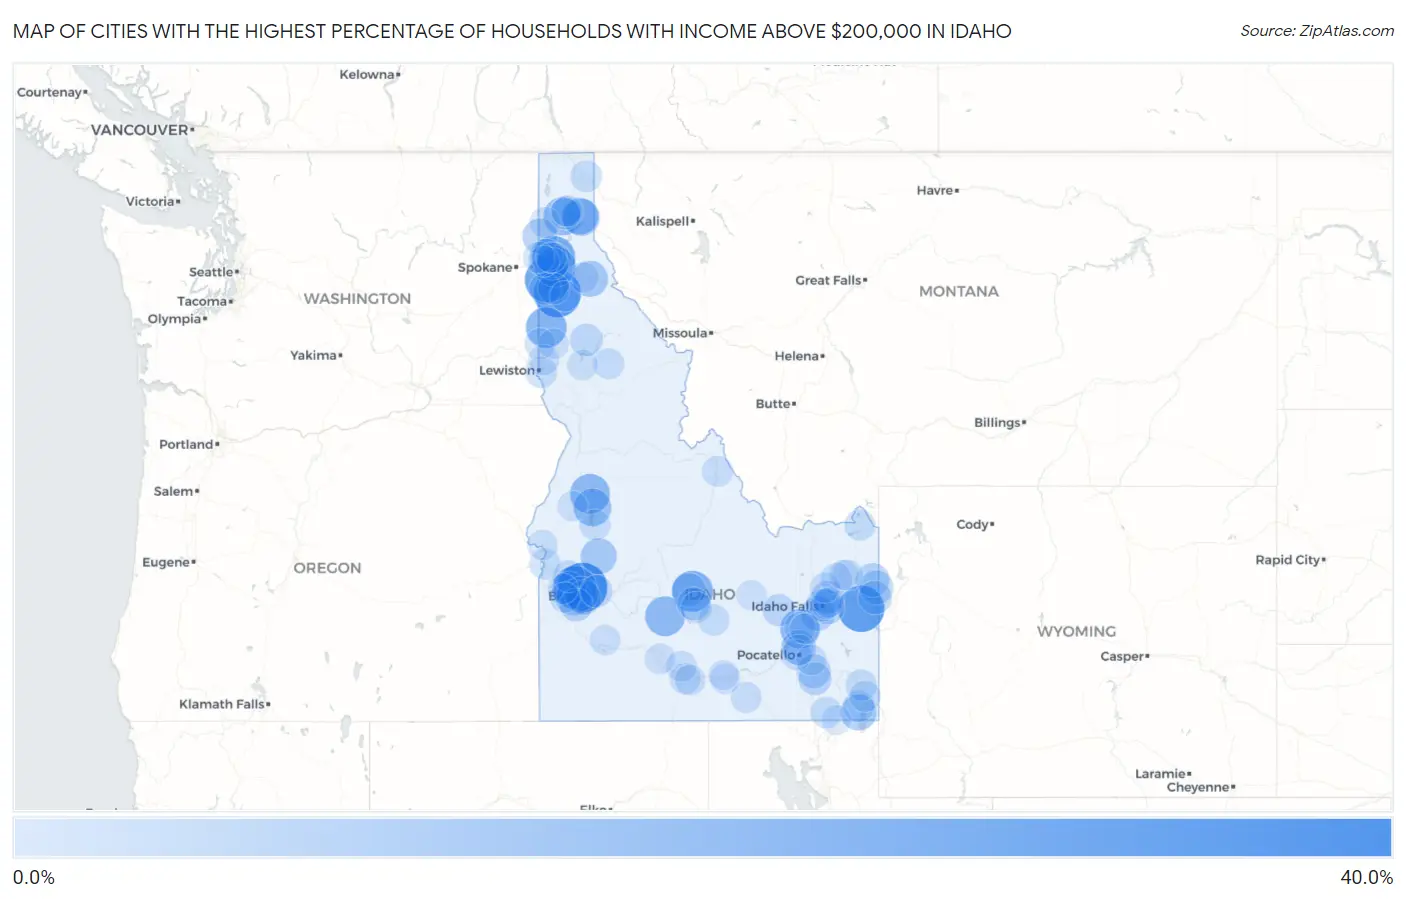
Map of Cities with the Highest Percentage of Households with Income Above $200,000 in Idaho
0.0%
40.0%
Cities with the Highest Percentage of Households with Income Above $200,000 in Idaho
| City | Households with Income > $200k | vs State | vs National | |
| 1. | Hidden Springs | 36.8% | 7.3%(+29.5)#1 | 11.4%(+25.4)#1,034 |
| 2. | Parkline | 32.3% | 7.3%(+25.0)#2 | 11.4%(+20.9)#1,408 |
| 3. | Swan Valley | 31.1% | 7.3%(+23.8)#3 | 11.4%(+19.7)#1,517 |
| 4. | Rockford Bay | 29.1% | 7.3%(+21.8)#4 | 11.4%(+17.7)#1,701 |
| 5. | Eagle | 25.0% | 7.3%(+17.7)#5 | 11.4%(+13.6)#2,158 |
| 6. | Hayden Lake | 24.8% | 7.3%(+17.5)#6 | 11.4%(+13.4)#2,191 |
| 7. | Fernan Lake Village | 21.9% | 7.3%(+14.6)#7 | 11.4%(+10.5)#2,687 |
| 8. | Sun Valley | 21.6% | 7.3%(+14.3)#8 | 11.4%(+10.2)#2,737 |
| 9. | Onaway | 21.0% | 7.3%(+13.7)#9 | 11.4%(+9.60)#2,854 |
| 10. | Fairfield | 19.4% | 7.3%(+12.1)#10 | 11.4%(+8.00)#3,183 |
| 11. | Mccall | 19.1% | 7.3%(+11.8)#11 | 11.4%(+7.70)#3,247 |
| 12. | Riverside | 18.7% | 7.3%(+11.4)#12 | 11.4%(+7.30)#3,356 |
| 13. | Dover | 16.3% | 7.3%(+9.00)#13 | 11.4%(+4.90)#3,914 |
| 14. | Donnelly | 15.8% | 7.3%(+8.50)#14 | 11.4%(+4.40)#4,047 |
| 15. | East Hope | 14.3% | 7.3%(+7.00)#15 | 11.4%(+2.90)#4,559 |
| 16. | Hope | 14.3% | 7.3%(+7.00)#16 | 11.4%(+2.90)#4,567 |
| 17. | Wardner | 12.9% | 7.3%(+5.60)#17 | 11.4%(+1.50)#5,127 |
| 18. | Meridian | 12.8% | 7.3%(+5.50)#18 | 11.4%(+1.40)#5,137 |
| 19. | Crouch | 12.6% | 7.3%(+5.30)#19 | 11.4%(+1.20)#5,264 |
| 20. | St Charles | 12.5% | 7.3%(+5.20)#20 | 11.4%(+1.10)#5,306 |
| 21. | Letha | 12.1% | 7.3%(+4.80)#21 | 11.4%(+0.700)#5,503 |
| 22. | Blanchard | 11.0% | 7.3%(+3.70)#22 | 11.4%(-0.400)#5,996 |
| 23. | Tyhee | 10.8% | 7.3%(+3.50)#23 | 11.4%(-0.600)#6,091 |
| 24. | Star | 10.2% | 7.3%(+2.90)#24 | 11.4%(-1.20)#6,387 |
| 25. | Boise City | 10.1% | 7.3%(+2.80)#25 | 11.4%(-1.30)#6,430 |
| 26. | Dalton Gardens | 10.1% | 7.3%(+2.80)#26 | 11.4%(-1.30)#6,466 |
| 27. | Garden City | 10.0% | 7.3%(+2.70)#27 | 11.4%(-1.40)#6,498 |
| 28. | Shelley | 9.7% | 7.3%(+2.40)#28 | 11.4%(-1.70)#6,716 |
| 29. | Driggs | 9.2% | 7.3%(+1.90)#29 | 11.4%(-2.20)#7,058 |
| 30. | Ammon | 9.0% | 7.3%(+1.70)#30 | 11.4%(-2.40)#7,174 |
| 31. | Avimor | 9.0% | 7.3%(+1.70)#31 | 11.4%(-2.40)#7,195 |
| 32. | Ketchum | 8.8% | 7.3%(+1.50)#32 | 11.4%(-2.60)#7,310 |
| 33. | Mccammon | 8.8% | 7.3%(+1.50)#33 | 11.4%(-2.60)#7,326 |
| 34. | Tetonia | 8.8% | 7.3%(+1.50)#34 | 11.4%(-2.60)#7,336 |
| 35. | Victor | 8.3% | 7.3%(+1.00)#35 | 11.4%(-3.10)#7,680 |
| 36. | Ucon | 7.8% | 7.3%(+0.500)#36 | 11.4%(-3.60)#8,107 |
| 37. | Kuna | 7.7% | 7.3%(+0.400)#37 | 11.4%(-3.70)#8,154 |
| 38. | Arimo | 7.7% | 7.3%(+0.400)#38 | 11.4%(-3.70)#8,213 |
| 39. | Idaho Falls | 7.4% | 7.3%(+0.100)#39 | 11.4%(-4.00)#8,412 |
| 40. | Hailey | 7.2% | 7.3%(-0.100)#40 | 11.4%(-4.20)#8,605 |
| 41. | Elk River | 6.9% | 7.3%(-0.400)#41 | 11.4%(-4.50)#8,960 |
| 42. | Rathdrum | 6.8% | 7.3%(-0.500)#42 | 11.4%(-4.60)#9,000 |
| 43. | Robie Creek | 6.5% | 7.3%(-0.800)#43 | 11.4%(-4.90)#9,375 |
| 44. | Atomic City | 6.3% | 7.3%(-1.000)#44 | 11.4%(-5.10)#9,672 |
| 45. | Coeur D Alene | 5.7% | 7.3%(-1.60)#45 | 11.4%(-5.70)#10,312 |
| 46. | Worley | 5.5% | 7.3%(-1.80)#46 | 11.4%(-5.90)#10,730 |
| 47. | Emmett | 5.4% | 7.3%(-1.90)#47 | 11.4%(-6.00)#10,771 |
| 48. | Bloomington | 5.3% | 7.3%(-2.00)#48 | 11.4%(-6.10)#11,018 |
| 49. | Moyie Springs | 5.2% | 7.3%(-2.10)#49 | 11.4%(-6.20)#11,118 |
| 50. | Kootenai | 5.2% | 7.3%(-2.10)#50 | 11.4%(-6.20)#11,121 |
| 51. | Fruitland | 4.9% | 7.3%(-2.40)#51 | 11.4%(-6.50)#11,535 |
| 52. | Carey | 4.9% | 7.3%(-2.40)#52 | 11.4%(-6.50)#11,590 |
| 53. | Dayton | 4.9% | 7.3%(-2.40)#53 | 11.4%(-6.50)#11,618 |
| 54. | Bellevue | 4.8% | 7.3%(-2.50)#54 | 11.4%(-6.60)#11,712 |
| 55. | Georgetown | 4.8% | 7.3%(-2.50)#55 | 11.4%(-6.60)#11,746 |
| 56. | Hauser | 4.7% | 7.3%(-2.60)#56 | 11.4%(-6.70)#11,921 |
| 57. | Rexburg | 4.6% | 7.3%(-2.70)#57 | 11.4%(-6.80)#11,991 |
| 58. | Lewiston | 4.5% | 7.3%(-2.80)#58 | 11.4%(-6.90)#12,142 |
| 59. | Sandpoint | 4.5% | 7.3%(-2.80)#59 | 11.4%(-6.90)#12,172 |
| 60. | Montpelier | 4.5% | 7.3%(-2.80)#60 | 11.4%(-6.90)#12,217 |
| 61. | Moreland | 4.5% | 7.3%(-2.80)#61 | 11.4%(-6.90)#12,250 |
| 62. | Conkling Park | 4.5% | 7.3%(-2.80)#62 | 11.4%(-6.90)#12,318 |
| 63. | Pierce | 4.3% | 7.3%(-3.00)#63 | 11.4%(-7.10)#12,661 |
| 64. | Island Park | 4.3% | 7.3%(-3.00)#64 | 11.4%(-7.10)#12,698 |
| 65. | Cascade | 4.2% | 7.3%(-3.10)#65 | 11.4%(-7.20)#12,821 |
| 66. | Moscow | 4.1% | 7.3%(-3.20)#66 | 11.4%(-7.30)#12,894 |
| 67. | Salmon | 4.0% | 7.3%(-3.30)#67 | 11.4%(-7.40)#13,142 |
| 68. | Genesee | 4.0% | 7.3%(-3.30)#68 | 11.4%(-7.40)#13,183 |
| 69. | Newdale | 4.0% | 7.3%(-3.30)#69 | 11.4%(-7.40)#13,221 |
| 70. | Twin Falls | 3.9% | 7.3%(-3.40)#70 | 11.4%(-7.50)#13,257 |
| 71. | Post Falls | 3.9% | 7.3%(-3.40)#71 | 11.4%(-7.50)#13,261 |
| 72. | Jerome | 3.9% | 7.3%(-3.40)#72 | 11.4%(-7.50)#13,284 |
| 73. | Priest River | 3.9% | 7.3%(-3.40)#73 | 11.4%(-7.50)#13,355 |
| 74. | Silverton | 3.9% | 7.3%(-3.40)#74 | 11.4%(-7.50)#13,404 |
| 75. | Malta | 3.9% | 7.3%(-3.40)#75 | 11.4%(-7.50)#13,429 |
| 76. | Pocatello | 3.8% | 7.3%(-3.50)#76 | 11.4%(-7.60)#13,453 |
| 77. | Chubbuck | 3.7% | 7.3%(-3.60)#77 | 11.4%(-7.70)#13,687 |
| 78. | Kimberly | 3.7% | 7.3%(-3.60)#78 | 11.4%(-7.70)#13,728 |
| 79. | Orofino | 3.6% | 7.3%(-3.70)#79 | 11.4%(-7.80)#13,946 |
| 80. | Mountain Home Afb | 3.6% | 7.3%(-3.70)#80 | 11.4%(-7.80)#13,948 |
| 81. | Hagerman | 3.5% | 7.3%(-3.80)#81 | 11.4%(-7.90)#14,197 |
| 82. | Middleton | 3.4% | 7.3%(-3.90)#82 | 11.4%(-8.00)#14,309 |
| 83. | Weiser | 3.3% | 7.3%(-4.00)#83 | 11.4%(-8.10)#14,541 |
| 84. | Lincoln | 3.3% | 7.3%(-4.00)#84 | 11.4%(-8.10)#14,562 |
| 85. | Inkom | 3.3% | 7.3%(-4.00)#85 | 11.4%(-8.10)#14,640 |
| 86. | Menan | 3.3% | 7.3%(-4.00)#86 | 11.4%(-8.10)#14,652 |
| 87. | Hayden | 3.2% | 7.3%(-4.10)#87 | 11.4%(-8.20)#14,748 |
| 88. | Heyburn | 3.2% | 7.3%(-4.10)#88 | 11.4%(-8.20)#14,801 |
| 89. | Pinehurst | 3.2% | 7.3%(-4.10)#89 | 11.4%(-8.20)#14,838 |
| 90. | Blackfoot | 3.1% | 7.3%(-4.20)#90 | 11.4%(-8.30)#14,996 |
| 91. | Iona | 3.1% | 7.3%(-4.20)#91 | 11.4%(-8.30)#15,063 |
| 92. | St Maries | 3.1% | 7.3%(-4.20)#92 | 11.4%(-8.30)#15,077 |
| 93. | Troy | 3.1% | 7.3%(-4.20)#93 | 11.4%(-8.30)#15,132 |
| 94. | Nampa | 3.0% | 7.3%(-4.30)#94 | 11.4%(-8.40)#15,231 |
| 95. | Arco | 3.0% | 7.3%(-4.30)#95 | 11.4%(-8.40)#15,405 |
| 96. | Teton | 2.9% | 7.3%(-4.40)#96 | 11.4%(-8.50)#15,663 |
| 97. | Franklin | 2.9% | 7.3%(-4.40)#97 | 11.4%(-8.50)#15,666 |
| 98. | Paul | 2.8% | 7.3%(-4.50)#98 | 11.4%(-8.60)#15,880 |
| 99. | Ponderay | 2.8% | 7.3%(-4.50)#99 | 11.4%(-8.60)#15,891 |
| 100. | Council | 2.8% | 7.3%(-4.50)#100 | 11.4%(-8.60)#15,932 |
Common Questions
What are the Top 10 Cities with the Highest Percentage of Households with Income Above $200,000 in Idaho?
Top 10 Cities with the Highest Percentage of Households with Income Above $200,000 in Idaho are:
#1
36.8%
#2
32.3%
#3
31.1%
#4
29.1%
#5
25.0%
#6
24.8%
#7
21.9%
#8
21.6%
#9
21.0%
#10
19.4%
What city has the Highest Percentage of Households with Income Above $200,000 in Idaho?
Hidden Springs has the Highest Percentage of Households with Income Above $200,000 in Idaho with 36.8%.
What is the Percentage of Households with Income Above $200,000 in the State of Idaho?
Percentage of Households with Income Above $200,000 in Idaho is 7.3%.
What is the Percentage of Households with Income Above $200,000 in the United States?
Percentage of Households with Income Above $200,000 in the United States is 11.4%.