Cities with the Highest Percentage of Households with Income Above $200,000 in Georgia
RELATED REPORTS & OPTIONS
Household Income | $200k+
Georgia
Compare Cities
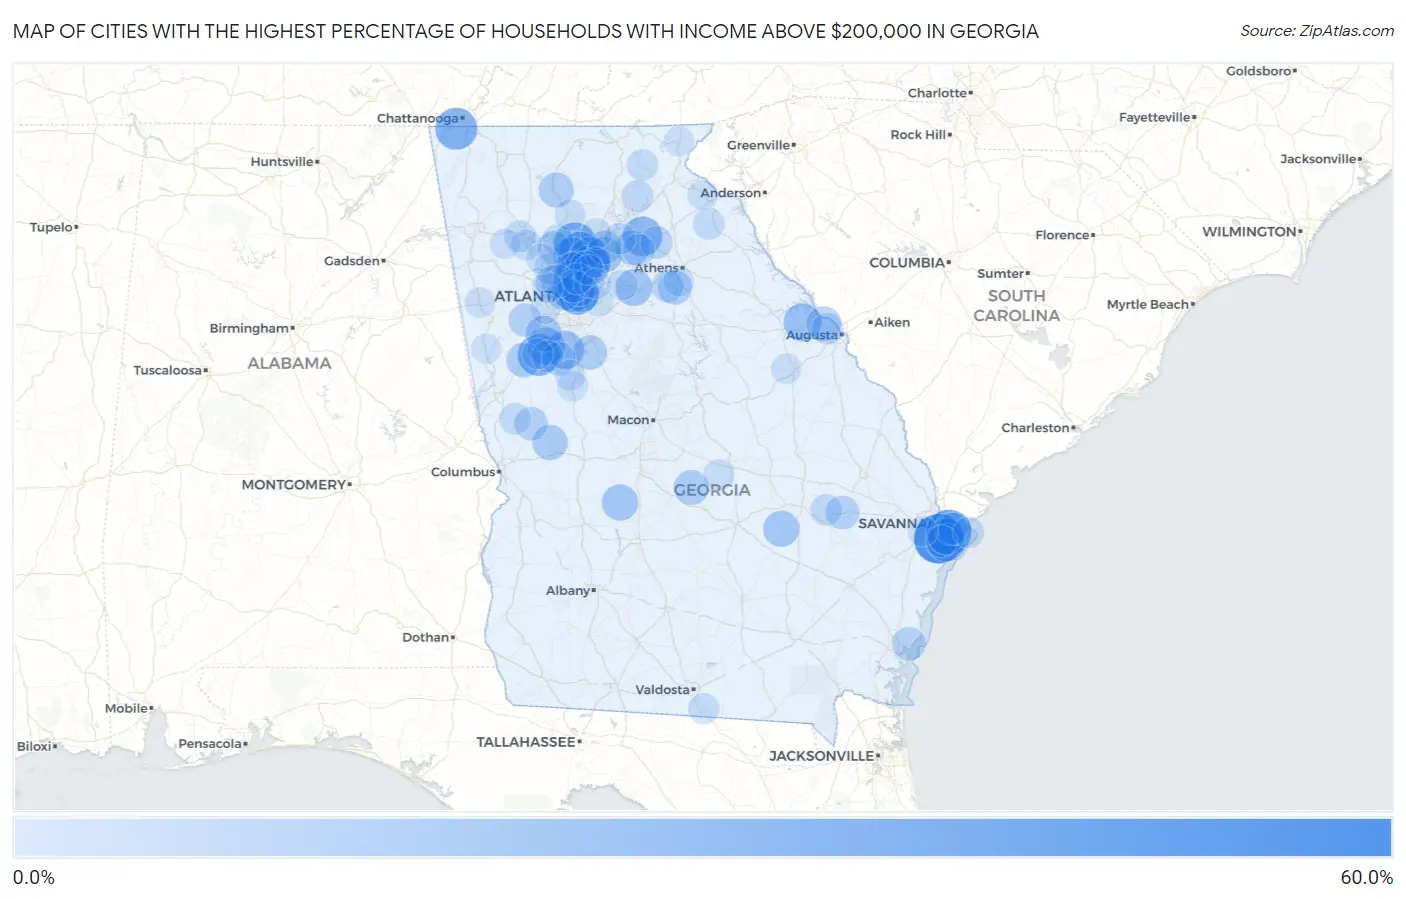
Map of Cities with the Highest Percentage of Households with Income Above $200,000 in Georgia
0.0%
60.0%
Cities with the Highest Percentage of Households with Income Above $200,000 in Georgia
| City | Households with Income > $200k | vs State | vs National | |
| 1. | Dixie | 54.7% | 10.0%(+44.7)#1 | 11.4%(+43.3)#308 |
| 2. | Vernonburg | 53.7% | 10.0%(+43.7)#2 | 11.4%(+42.3)#341 |
| 3. | Dutch Island | 44.3% | 10.0%(+34.3)#3 | 11.4%(+32.9)#641 |
| 4. | Milton | 37.4% | 10.0%(+27.4)#4 | 11.4%(+26.0)#987 |
| 5. | Hortense | 36.5% | 10.0%(+26.5)#5 | 11.4%(+25.1)#1,051 |
| 6. | Lookout Mountain | 35.9% | 10.0%(+25.9)#6 | 11.4%(+24.5)#1,090 |
| 7. | Turin | 35.8% | 10.0%(+25.8)#7 | 11.4%(+24.4)#1,101 |
| 8. | Decatur | 35.7% | 10.0%(+25.7)#8 | 11.4%(+24.3)#1,103 |
| 9. | Alpharetta | 35.3% | 10.0%(+25.3)#9 | 11.4%(+23.9)#1,145 |
| 10. | Druid Hills | 34.9% | 10.0%(+24.9)#10 | 11.4%(+23.5)#1,185 |
| 11. | Johns Creek | 33.0% | 10.0%(+23.0)#11 | 11.4%(+21.6)#1,335 |
| 12. | Berkeley Lake | 30.7% | 10.0%(+20.7)#12 | 11.4%(+19.3)#1,549 |
| 13. | Talmo | 30.6% | 10.0%(+20.6)#13 | 11.4%(+19.2)#1,561 |
| 14. | Brookhaven | 29.6% | 10.0%(+19.6)#14 | 11.4%(+18.2)#1,653 |
| 15. | West Brow | 28.5% | 10.0%(+18.5)#15 | 11.4%(+17.1)#1,776 |
| 16. | Roswell | 27.8% | 10.0%(+17.8)#16 | 11.4%(+16.4)#1,834 |
| 17. | Skidaway Island | 27.4% | 10.0%(+17.4)#17 | 11.4%(+16.0)#1,880 |
| 18. | Woolsey | 27.3% | 10.0%(+17.3)#18 | 11.4%(+15.9)#1,904 |
| 19. | Peachtree City | 26.3% | 10.0%(+16.3)#19 | 11.4%(+14.9)#2,013 |
| 20. | Appling | 26.3% | 10.0%(+16.3)#20 | 11.4%(+14.9)#2,018 |
| 21. | Dunwoody | 26.1% | 10.0%(+16.1)#21 | 11.4%(+14.7)#2,040 |
| 22. | Gardi | 25.0% | 10.0%(+15.0)#22 | 11.4%(+13.6)#2,172 |
| 23. | Between | 24.5% | 10.0%(+14.5)#23 | 11.4%(+13.1)#2,235 |
| 24. | Avondale Estates | 23.6% | 10.0%(+13.6)#24 | 11.4%(+12.2)#2,379 |
| 25. | Dooling | 23.1% | 10.0%(+13.1)#25 | 11.4%(+11.7)#2,476 |
| 26. | Uvalda | 22.6% | 10.0%(+12.6)#26 | 11.4%(+11.2)#2,557 |
| 27. | Tyrone | 22.3% | 10.0%(+12.3)#27 | 11.4%(+10.9)#2,601 |
| 28. | Isle Of Hope | 22.3% | 10.0%(+12.3)#28 | 11.4%(+10.9)#2,602 |
| 29. | Suwanee | 22.1% | 10.0%(+12.1)#29 | 11.4%(+10.7)#2,633 |
| 30. | Sandy Springs | 21.4% | 10.0%(+11.4)#30 | 11.4%(+10.00)#2,762 |
| 31. | Talbotton | 20.8% | 10.0%(+10.8)#31 | 11.4%(+9.40)#2,889 |
| 32. | Braselton | 20.3% | 10.0%(+10.3)#32 | 11.4%(+8.90)#2,972 |
| 33. | Empire | 20.1% | 10.0%(+10.1)#33 | 11.4%(+8.70)#3,025 |
| 34. | Talking Rock | 20.0% | 10.0%(+10.00)#34 | 11.4%(+8.60)#3,058 |
| 35. | Evans | 19.7% | 10.0%(+9.70)#35 | 11.4%(+8.30)#3,114 |
| 36. | North Decatur | 19.6% | 10.0%(+9.60)#36 | 11.4%(+8.20)#3,135 |
| 37. | Moreland | 19.6% | 10.0%(+9.60)#37 | 11.4%(+8.20)#3,144 |
| 38. | Heron Bay | 18.7% | 10.0%(+8.70)#38 | 11.4%(+7.30)#3,349 |
| 39. | Bishop | 18.6% | 10.0%(+8.60)#39 | 11.4%(+7.20)#3,378 |
| 40. | Smyrna | 17.7% | 10.0%(+7.70)#40 | 11.4%(+6.30)#3,568 |
| 41. | Brooks | 17.3% | 10.0%(+7.30)#41 | 11.4%(+5.90)#3,664 |
| 42. | Bellville | 17.2% | 10.0%(+7.20)#42 | 11.4%(+5.80)#3,690 |
| 43. | Sugar Hill | 17.0% | 10.0%(+7.00)#43 | 11.4%(+5.60)#3,721 |
| 44. | St Simons | 17.0% | 10.0%(+7.00)#44 | 11.4%(+5.60)#3,725 |
| 45. | Smarr | 17.0% | 10.0%(+7.00)#45 | 11.4%(+5.60)#3,736 |
| 46. | Bolingbroke | 16.9% | 10.0%(+6.90)#46 | 11.4%(+5.50)#3,748 |
| 47. | Atlanta | 16.7% | 10.0%(+6.70)#47 | 11.4%(+5.30)#3,777 |
| 48. | Vinings | 16.6% | 10.0%(+6.60)#48 | 11.4%(+5.20)#3,820 |
| 49. | Shiloh | 16.6% | 10.0%(+6.60)#49 | 11.4%(+5.20)#3,842 |
| 50. | Chattahoochee Hills | 16.4% | 10.0%(+6.40)#50 | 11.4%(+5.00)#3,887 |
| 51. | Peachtree Corners | 15.6% | 10.0%(+5.60)#51 | 11.4%(+4.20)#4,085 |
| 52. | Fairfield Plantation | 15.4% | 10.0%(+5.40)#52 | 11.4%(+4.00)#4,151 |
| 53. | Jefferson | 15.1% | 10.0%(+5.10)#53 | 11.4%(+3.70)#4,258 |
| 54. | Woodstock | 14.9% | 10.0%(+4.90)#54 | 11.4%(+3.50)#4,311 |
| 55. | Talahi Island | 14.8% | 10.0%(+4.80)#55 | 11.4%(+3.40)#4,373 |
| 56. | North Druid Hills | 14.6% | 10.0%(+4.60)#56 | 11.4%(+3.20)#4,424 |
| 57. | Whitemarsh Island | 14.5% | 10.0%(+4.50)#57 | 11.4%(+3.10)#4,453 |
| 58. | Hoschton | 14.4% | 10.0%(+4.40)#58 | 11.4%(+3.00)#4,504 |
| 59. | North High Shoals | 14.4% | 10.0%(+4.40)#59 | 11.4%(+3.00)#4,515 |
| 60. | Clermont | 13.1% | 10.0%(+3.10)#60 | 11.4%(+1.70)#5,031 |
| 61. | Marietta | 13.0% | 10.0%(+3.00)#61 | 11.4%(+1.60)#5,046 |
| 62. | Martinez | 12.9% | 10.0%(+2.90)#62 | 11.4%(+1.50)#5,092 |
| 63. | Senoia | 12.9% | 10.0%(+2.90)#63 | 11.4%(+1.50)#5,106 |
| 64. | Montgomery | 12.9% | 10.0%(+2.90)#64 | 11.4%(+1.50)#5,109 |
| 65. | Collins | 12.8% | 10.0%(+2.80)#65 | 11.4%(+1.40)#5,180 |
| 66. | Cartersville | 12.5% | 10.0%(+2.50)#66 | 11.4%(+1.10)#5,268 |
| 67. | Franklin Springs | 12.5% | 10.0%(+2.50)#67 | 11.4%(+1.10)#5,291 |
| 68. | Pine Mountain | 12.4% | 10.0%(+2.40)#68 | 11.4%(+1.000)#5,354 |
| 69. | Flowery Branch | 12.2% | 10.0%(+2.20)#69 | 11.4%(+0.800)#5,415 |
| 70. | Helen | 12.0% | 10.0%(+2.00)#70 | 11.4%(+0.600)#5,544 |
| 71. | Holly Springs | 11.7% | 10.0%(+1.70)#71 | 11.4%(+0.300)#5,660 |
| 72. | Chamblee | 11.6% | 10.0%(+1.60)#72 | 11.4%(+0.200)#5,705 |
| 73. | Emerson | 11.5% | 10.0%(+1.50)#73 | 11.4%(+0.100)#5,766 |
| 74. | Tybee Island | 11.4% | 10.0%(+1.40)#74 | 11.4%(=0.000)#5,804 |
| 75. | Lake Park | 11.3% | 10.0%(+1.30)#75 | 11.4%(-0.100)#5,854 |
| 76. | Ball Ground | 11.0% | 10.0%(+1.000)#76 | 11.4%(-0.400)#5,972 |
| 77. | Dexter | 11.0% | 10.0%(+1.000)#77 | 11.4%(-0.400)#5,985 |
| 78. | Sharpsburg | 11.0% | 10.0%(+1.000)#78 | 11.4%(-0.400)#5,997 |
| 79. | Tucker | 10.6% | 10.0%(+0.600)#79 | 11.4%(-0.800)#6,161 |
| 80. | Cumming | 10.6% | 10.0%(+0.600)#80 | 11.4%(-0.800)#6,180 |
| 81. | Williamson | 10.5% | 10.0%(+0.500)#81 | 11.4%(-0.900)#6,247 |
| 82. | Bremen | 10.3% | 10.0%(+0.300)#82 | 11.4%(-1.10)#6,335 |
| 83. | Stapleton | 10.3% | 10.0%(+0.300)#83 | 11.4%(-1.10)#6,363 |
| 84. | Mableton | 10.2% | 10.0%(+0.200)#84 | 11.4%(-1.20)#6,382 |
| 85. | Zebulon | 10.2% | 10.0%(+0.200)#85 | 11.4%(-1.20)#6,417 |
| 86. | Loganville | 10.1% | 10.0%(+0.100)#86 | 11.4%(-1.30)#6,443 |
| 87. | Watkinsville | 10.0% | 10.0%(=0.000)#87 | 11.4%(-1.40)#6,511 |
| 88. | Duluth | 9.8% | 10.0%(-0.200)#88 | 11.4%(-1.60)#6,623 |
| 89. | Ellerslie | 9.8% | 10.0%(-0.200)#89 | 11.4%(-1.60)#6,674 |
| 90. | Euharlee | 9.6% | 10.0%(-0.400)#90 | 11.4%(-1.80)#6,771 |
| 91. | Clayton | 9.5% | 10.0%(-0.500)#91 | 11.4%(-1.90)#6,856 |
| 92. | Centralhatchee | 9.5% | 10.0%(-0.500)#92 | 11.4%(-1.90)#6,873 |
| 93. | Kennesaw | 9.4% | 10.0%(-0.600)#93 | 11.4%(-2.00)#6,894 |
| 94. | Norcross | 9.4% | 10.0%(-0.600)#94 | 11.4%(-2.00)#6,900 |
| 95. | Box Springs | 9.4% | 10.0%(-0.600)#95 | 11.4%(-2.00)#6,955 |
| 96. | Mountain Park | 9.3% | 10.0%(-0.700)#96 | 11.4%(-2.10)#6,979 |
| 97. | Henderson | 9.3% | 10.0%(-0.700)#97 | 11.4%(-2.10)#6,996 |
| 98. | Lithonia | 9.3% | 10.0%(-0.700)#98 | 11.4%(-2.10)#6,997 |
| 99. | Martin | 9.3% | 10.0%(-0.700)#99 | 11.4%(-2.10)#7,019 |
| 100. | South Fulton | 9.2% | 10.0%(-0.800)#100 | 11.4%(-2.20)#7,030 |
Common Questions
What are the Top 10 Cities with the Highest Percentage of Households with Income Above $200,000 in Georgia?
Top 10 Cities with the Highest Percentage of Households with Income Above $200,000 in Georgia are:
#1
53.7%
#2
44.3%
#3
37.4%
#4
35.9%
#5
35.8%
#6
35.7%
#7
35.3%
#8
34.9%
#9
33.0%
#10
30.7%
What city has the Highest Percentage of Households with Income Above $200,000 in Georgia?
Vernonburg has the Highest Percentage of Households with Income Above $200,000 in Georgia with 53.7%.
What is the Percentage of Households with Income Above $200,000 in the State of Georgia?
Percentage of Households with Income Above $200,000 in Georgia is 10.0%.
What is the Percentage of Households with Income Above $200,000 in the United States?
Percentage of Households with Income Above $200,000 in the United States is 11.4%.