Cities with the Highest Percentage of Households with Income Above $200,000 in Nevada
RELATED REPORTS & OPTIONS
Household Income | $200k+
Nevada
Compare Cities
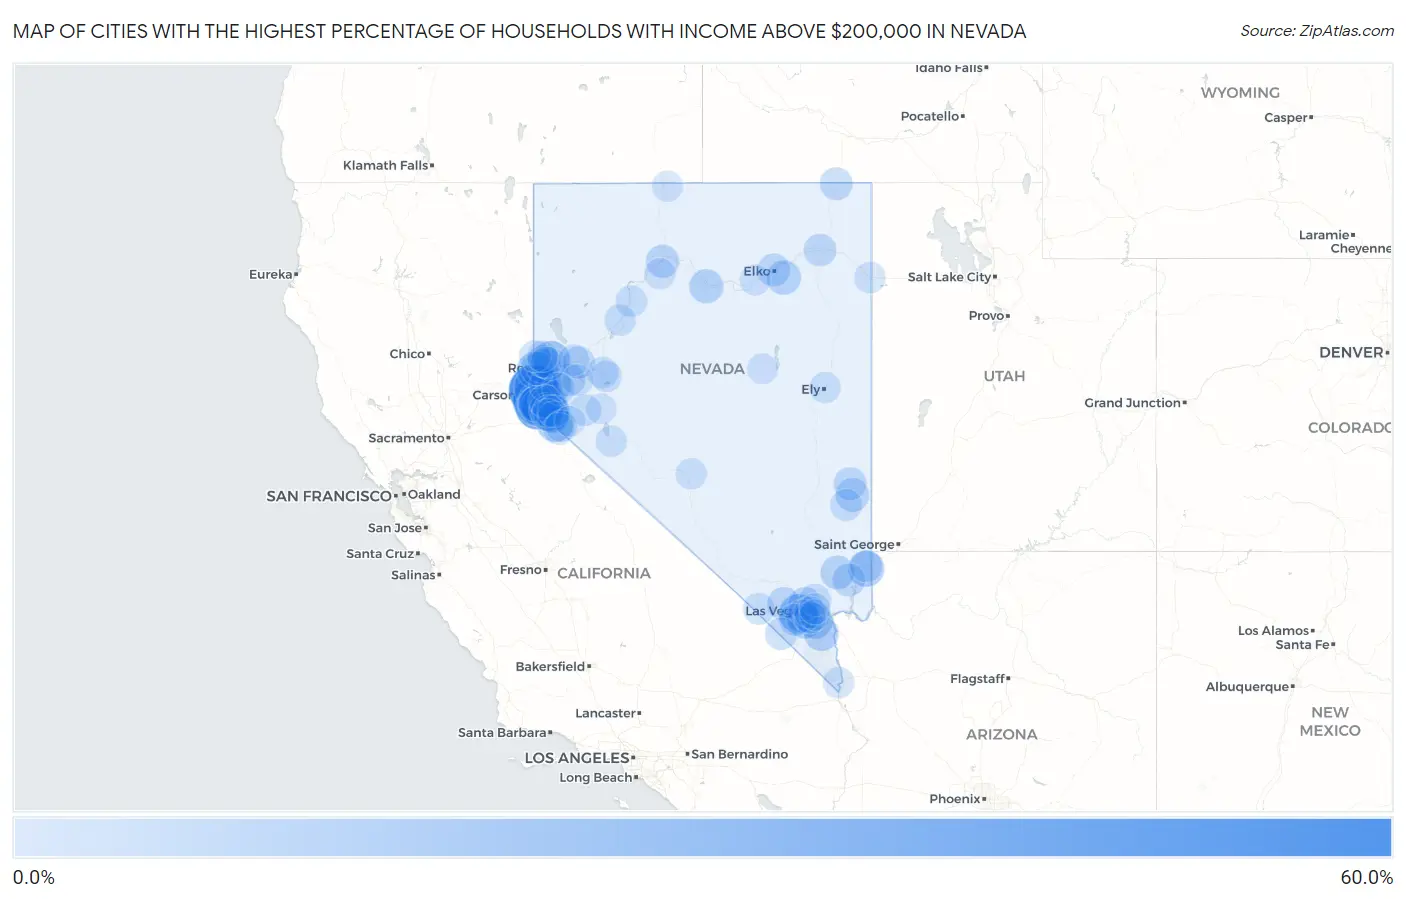
Map of Cities with the Highest Percentage of Households with Income Above $200,000 in Nevada
0.0%
60.0%
Cities with the Highest Percentage of Households with Income Above $200,000 in Nevada
| City | Households with Income > $200k | vs State | vs National | |
| 1. | Crystal Bay | 53.6% | 8.7%(+44.9)#1 | 11.4%(+42.2)#346 |
| 2. | Glenbrook | 52.7% | 8.7%(+44.0)#2 | 11.4%(+41.3)#373 |
| 3. | Incline Village | 38.4% | 8.7%(+29.7)#3 | 11.4%(+27.0)#934 |
| 4. | Round Hill Village | 37.2% | 8.7%(+28.5)#4 | 11.4%(+25.8)#1,004 |
| 5. | Genoa | 31.1% | 8.7%(+22.4)#5 | 11.4%(+19.7)#1,514 |
| 6. | East Valley | 26.8% | 8.7%(+18.1)#6 | 11.4%(+15.4)#1,959 |
| 7. | Zephyr Cove | 26.6% | 8.7%(+17.9)#7 | 11.4%(+15.2)#1,987 |
| 8. | Logan Creek | 26.3% | 8.7%(+17.6)#8 | 11.4%(+14.9)#2,026 |
| 9. | Summerlin South | 24.3% | 8.7%(+15.6)#9 | 11.4%(+12.9)#2,255 |
| 10. | Skyland | 22.0% | 8.7%(+13.3)#10 | 11.4%(+10.6)#2,670 |
| 11. | Kingsbury | 21.9% | 8.7%(+13.2)#11 | 11.4%(+10.5)#2,684 |
| 12. | Spanish Springs | 20.9% | 8.7%(+12.2)#12 | 11.4%(+9.50)#2,863 |
| 13. | Lakeridge | 17.8% | 8.7%(+9.10)#13 | 11.4%(+6.40)#3,565 |
| 14. | Johnson Lane | 17.1% | 8.7%(+8.40)#14 | 11.4%(+5.70)#3,701 |
| 15. | Verdi | 17.1% | 8.7%(+8.40)#15 | 11.4%(+5.70)#3,709 |
| 16. | Double Spring | 16.2% | 8.7%(+7.50)#16 | 11.4%(+4.80)#3,940 |
| 17. | Bunkerville | 15.7% | 8.7%(+7.00)#17 | 11.4%(+4.30)#4,073 |
| 18. | Henderson | 13.1% | 8.7%(+4.40)#18 | 11.4%(+1.70)#5,003 |
| 19. | Virginia City | 13.0% | 8.7%(+4.30)#19 | 11.4%(+1.60)#5,080 |
| 20. | Ruhenstroth | 12.8% | 8.7%(+4.10)#20 | 11.4%(+1.40)#5,170 |
| 21. | Enterprise | 12.0% | 8.7%(+3.30)#21 | 11.4%(+0.600)#5,511 |
| 22. | Boulder City | 11.8% | 8.7%(+3.10)#22 | 11.4%(+0.400)#5,613 |
| 23. | Spring Creek | 11.4% | 8.7%(+2.70)#23 | 11.4%(=0.000)#5,796 |
| 24. | Battle Mountain | 10.6% | 8.7%(+1.90)#24 | 11.4%(-0.800)#6,186 |
| 25. | Minden | 10.2% | 8.7%(+1.50)#25 | 11.4%(-1.20)#6,404 |
| 26. | Moapa Town | 9.8% | 8.7%(+1.10)#26 | 11.4%(-1.60)#6,677 |
| 27. | Reno | 9.5% | 8.7%(+0.800)#27 | 11.4%(-1.90)#6,818 |
| 28. | Washoe Valley | 9.4% | 8.7%(+0.700)#28 | 11.4%(-2.00)#6,921 |
| 29. | Mogul | 8.9% | 8.7%(+0.200)#29 | 11.4%(-2.50)#7,255 |
| 30. | Panaca | 8.9% | 8.7%(+0.200)#30 | 11.4%(-2.50)#7,257 |
| 31. | Mount Charleston | 8.3% | 8.7%(-0.400)#31 | 11.4%(-3.10)#7,709 |
| 32. | Las Vegas | 8.2% | 8.7%(-0.500)#32 | 11.4%(-3.20)#7,736 |
| 33. | Winnemucca | 8.1% | 8.7%(-0.600)#33 | 11.4%(-3.30)#7,832 |
| 34. | Moapa Valley | 7.8% | 8.7%(-0.900)#34 | 11.4%(-3.60)#8,075 |
| 35. | Carson | 7.7% | 8.7%(-1.000)#35 | 11.4%(-3.70)#8,149 |
| 36. | Elko | 7.6% | 8.7%(-1.10)#36 | 11.4%(-3.80)#8,241 |
| 37. | Stagecoach | 7.6% | 8.7%(-1.10)#37 | 11.4%(-3.80)#8,279 |
| 38. | Spring Valley | 7.4% | 8.7%(-1.30)#38 | 11.4%(-4.00)#8,405 |
| 39. | Pioche | 7.3% | 8.7%(-1.40)#39 | 11.4%(-4.10)#8,558 |
| 40. | Sparks | 7.1% | 8.7%(-1.60)#40 | 11.4%(-4.30)#8,670 |
| 41. | Indian Hills | 7.0% | 8.7%(-1.70)#41 | 11.4%(-4.40)#8,794 |
| 42. | Jackpot | 7.0% | 8.7%(-1.70)#42 | 11.4%(-4.40)#8,826 |
| 43. | Wells | 6.6% | 8.7%(-2.10)#43 | 11.4%(-4.80)#9,287 |
| 44. | Golden Valley | 6.3% | 8.7%(-2.40)#44 | 11.4%(-5.10)#9,598 |
| 45. | Fernley | 6.1% | 8.7%(-2.60)#45 | 11.4%(-5.30)#9,791 |
| 46. | Dayton | 5.7% | 8.7%(-3.00)#46 | 11.4%(-5.70)#10,323 |
| 47. | Sandy Valley | 5.7% | 8.7%(-3.00)#47 | 11.4%(-5.70)#10,371 |
| 48. | Gardnerville | 5.6% | 8.7%(-3.10)#48 | 11.4%(-5.80)#10,472 |
| 49. | Carter Springs | 5.4% | 8.7%(-3.30)#49 | 11.4%(-6.00)#10,853 |
| 50. | Blue Diamond | 5.4% | 8.7%(-3.30)#50 | 11.4%(-6.00)#10,861 |
| 51. | North Las Vegas | 5.3% | 8.7%(-3.40)#51 | 11.4%(-6.10)#10,876 |
| 52. | Mesquite | 5.3% | 8.7%(-3.40)#52 | 11.4%(-6.10)#10,892 |
| 53. | Amargosa Valley | 5.3% | 8.7%(-3.40)#53 | 11.4%(-6.10)#10,964 |
| 54. | Gardnerville Ranchos | 5.2% | 8.7%(-3.50)#54 | 11.4%(-6.20)#11,058 |
| 55. | Caliente | 4.9% | 8.7%(-3.80)#55 | 11.4%(-6.50)#11,609 |
| 56. | Paradise | 4.7% | 8.7%(-4.00)#56 | 11.4%(-6.70)#11,804 |
| 57. | Yerington | 4.6% | 8.7%(-4.10)#57 | 11.4%(-6.80)#12,054 |
| 58. | Fish Springs | 4.4% | 8.7%(-4.30)#58 | 11.4%(-7.00)#12,473 |
| 59. | Humboldt River Ranch | 4.4% | 8.7%(-4.30)#59 | 11.4%(-7.00)#12,498 |
| 60. | Topaz Lake | 4.4% | 8.7%(-4.30)#60 | 11.4%(-7.00)#12,499 |
| 61. | Cold Springs | 4.2% | 8.7%(-4.50)#61 | 11.4%(-7.20)#12,740 |
| 62. | Winchester | 4.1% | 8.7%(-4.60)#62 | 11.4%(-7.30)#12,891 |
| 63. | Pahrump | 4.0% | 8.7%(-4.70)#63 | 11.4%(-7.40)#13,071 |
| 64. | Topaz Ranch Estates | 3.8% | 8.7%(-4.90)#64 | 11.4%(-7.60)#13,550 |
| 65. | Fallon | 3.7% | 8.7%(-5.00)#65 | 11.4%(-7.70)#13,702 |
| 66. | Lovelock | 3.7% | 8.7%(-5.00)#66 | 11.4%(-7.70)#13,769 |
| 67. | Fallon Station | 3.6% | 8.7%(-5.10)#67 | 11.4%(-7.80)#13,996 |
| 68. | Sun Valley | 3.5% | 8.7%(-5.20)#68 | 11.4%(-7.90)#14,078 |
| 69. | Wadsworth | 3.5% | 8.7%(-5.20)#69 | 11.4%(-7.90)#14,223 |
| 70. | Whitney | 3.3% | 8.7%(-5.40)#70 | 11.4%(-8.10)#14,495 |
| 71. | Silver Springs | 3.2% | 8.7%(-5.50)#71 | 11.4%(-8.20)#14,787 |
| 72. | West Wendover | 3.2% | 8.7%(-5.50)#72 | 11.4%(-8.20)#14,792 |
| 73. | Hawthorne | 3.2% | 8.7%(-5.50)#73 | 11.4%(-8.20)#14,814 |
| 74. | Laughlin | 3.1% | 8.7%(-5.60)#74 | 11.4%(-8.30)#15,013 |
| 75. | Lemmon Valley | 2.8% | 8.7%(-5.90)#75 | 11.4%(-8.60)#15,813 |
| 76. | Ely | 2.8% | 8.7%(-5.90)#76 | 11.4%(-8.60)#15,823 |
| 77. | Tonopah | 2.8% | 8.7%(-5.90)#77 | 11.4%(-8.60)#15,856 |
| 78. | Grass Valley | 2.8% | 8.7%(-5.90)#78 | 11.4%(-8.60)#15,892 |
| 79. | Sunrise Manor | 2.6% | 8.7%(-6.10)#79 | 11.4%(-8.80)#16,249 |
| 80. | Fort Mcdermitt | 2.4% | 8.7%(-6.30)#80 | 11.4%(-9.00)#17,019 |
| 81. | Carlin | 2.3% | 8.7%(-6.40)#81 | 11.4%(-9.10)#17,154 |
| 82. | Eureka | 2.0% | 8.7%(-6.70)#82 | 11.4%(-9.40)#18,044 |
| 83. | Schurz | 1.6% | 8.7%(-7.10)#83 | 11.4%(-9.80)#19,079 |
| 84. | Smith Valley | 1.4% | 8.7%(-7.30)#84 | 11.4%(-10.00)#19,586 |
1
2Common Questions
What are the Top 10 Cities with the Highest Percentage of Households with Income Above $200,000 in Nevada?
Top 10 Cities with the Highest Percentage of Households with Income Above $200,000 in Nevada are:
#1
53.6%
#2
52.7%
#3
38.4%
#4
37.2%
#5
31.1%
#6
26.8%
#7
26.6%
#8
26.3%
#9
24.3%
#10
22.0%
What city has the Highest Percentage of Households with Income Above $200,000 in Nevada?
Crystal Bay has the Highest Percentage of Households with Income Above $200,000 in Nevada with 53.6%.
What is the Percentage of Households with Income Above $200,000 in the State of Nevada?
Percentage of Households with Income Above $200,000 in Nevada is 8.7%.
What is the Percentage of Households with Income Above $200,000 in the United States?
Percentage of Households with Income Above $200,000 in the United States is 11.4%.