Cities with the Highest Percentage of Households with Income Above $200,000 in Mississippi
RELATED REPORTS & OPTIONS
Household Income | $200k+
Mississippi
Compare Cities
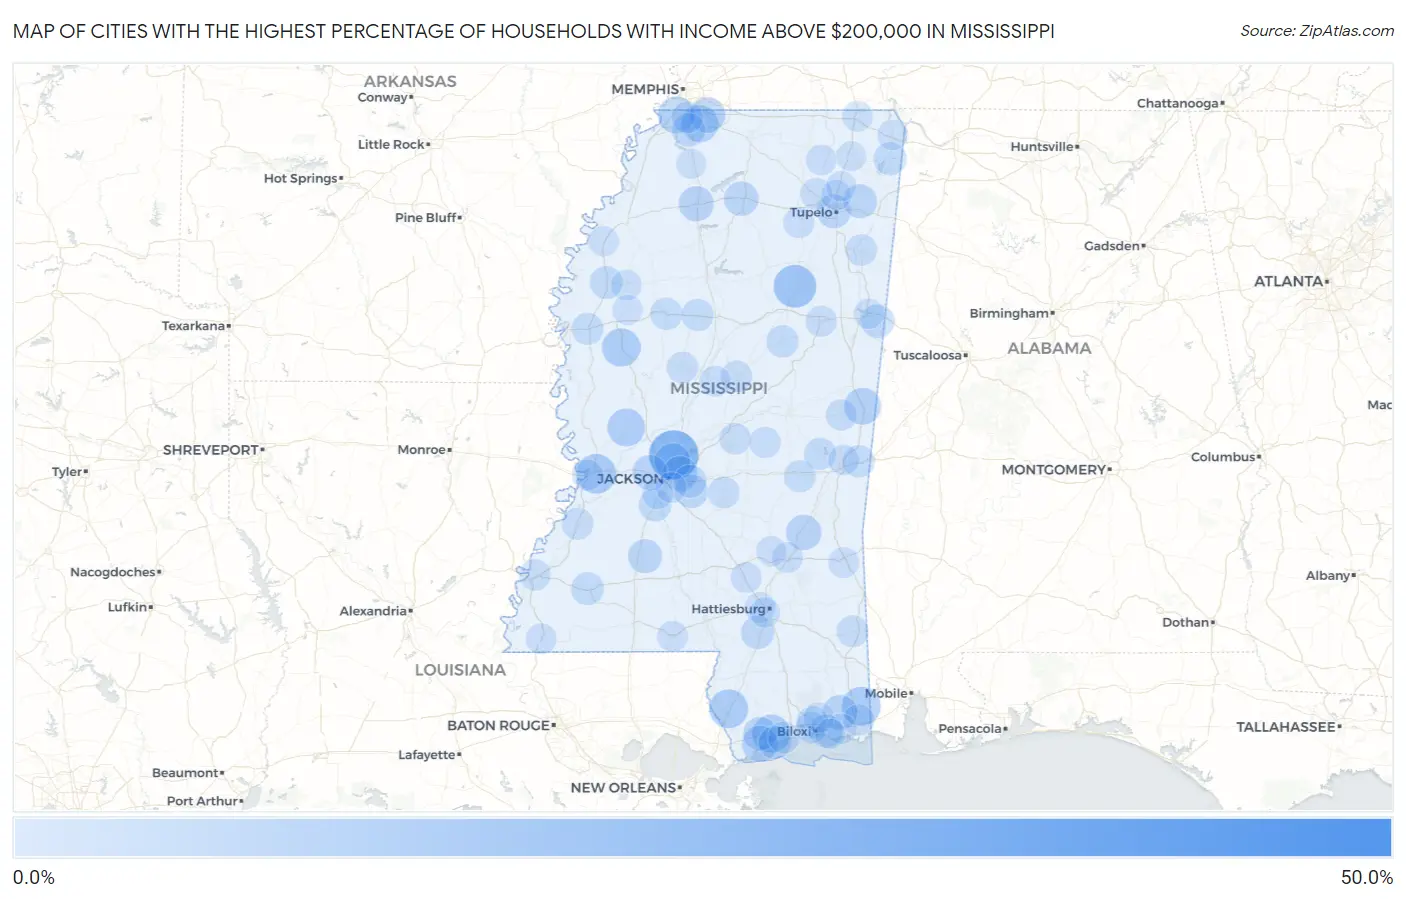
Map of Cities with the Highest Percentage of Households with Income Above $200,000 in Mississippi
0.0%
50.0%
Cities with the Highest Percentage of Households with Income Above $200,000 in Mississippi
| City | Households with Income > $200k | vs State | vs National | |
| 1. | Independence | 47.3% | 4.7%(+42.6)#1 | 11.4%(+35.9)#526 |
| 2. | Red Banks | 45.0% | 4.7%(+40.3)#2 | 11.4%(+33.6)#611 |
| 3. | Bogue Chitto Cdp Kemper And Neshoba Counties | 44.7% | 4.7%(+40.0)#3 | 11.4%(+33.3)#629 |
| 4. | Bolivar | 43.5% | 4.7%(+38.8)#4 | 11.4%(+32.1)#678 |
| 5. | Bond | 30.0% | 4.7%(+25.3)#5 | 11.4%(+18.6)#1,622 |
| 6. | Madison | 26.1% | 4.7%(+21.4)#6 | 11.4%(+14.7)#2,042 |
| 7. | Victoria | 26.0% | 4.7%(+21.3)#7 | 11.4%(+14.6)#2,060 |
| 8. | Elizabeth | 22.0% | 4.7%(+17.3)#8 | 11.4%(+10.6)#2,671 |
| 9. | Oak Grove | 18.2% | 4.7%(+13.5)#9 | 11.4%(+6.80)#3,457 |
| 10. | Mantee | 18.2% | 4.7%(+13.5)#10 | 11.4%(+6.80)#3,461 |
| 11. | Beechwood | 14.6% | 4.7%(+9.90)#11 | 11.4%(+3.20)#4,431 |
| 12. | Hide A Way Lake | 13.8% | 4.7%(+9.10)#12 | 11.4%(+2.40)#4,737 |
| 13. | Big Point | 13.7% | 4.7%(+9.00)#13 | 11.4%(+2.30)#4,800 |
| 14. | Glen Allan | 13.2% | 4.7%(+8.50)#14 | 11.4%(+1.80)#4,998 |
| 15. | Isola | 13.1% | 4.7%(+8.40)#15 | 11.4%(+1.70)#5,035 |
| 16. | Delisle | 12.7% | 4.7%(+8.00)#16 | 11.4%(+1.30)#5,206 |
| 17. | Satartia | 12.5% | 4.7%(+7.80)#17 | 11.4%(+1.10)#5,316 |
| 18. | Bridgetown | 11.5% | 4.7%(+6.80)#18 | 11.4%(+0.100)#5,762 |
| 19. | Lynchburg | 11.4% | 4.7%(+6.70)#19 | 11.4%(=0.000)#5,808 |
| 20. | Scooba | 11.4% | 4.7%(+6.70)#20 | 11.4%(=0.000)#5,814 |
| 21. | Bay St Louis | 10.6% | 4.7%(+5.90)#21 | 11.4%(-0.800)#6,176 |
| 22. | Ridgeland | 10.4% | 4.7%(+5.70)#22 | 11.4%(-1.000)#6,270 |
| 23. | Olive Branch | 10.1% | 4.7%(+5.40)#23 | 11.4%(-1.30)#6,431 |
| 24. | Gluckstadt | 10.1% | 4.7%(+5.40)#24 | 11.4%(-1.30)#6,463 |
| 25. | Flowood | 9.7% | 4.7%(+5.00)#25 | 11.4%(-1.70)#6,708 |
| 26. | Heidelberg | 9.7% | 4.7%(+5.00)#26 | 11.4%(-1.70)#6,743 |
| 27. | Clinton | 9.5% | 4.7%(+4.80)#27 | 11.4%(-1.90)#6,830 |
| 28. | Batesville | 9.5% | 4.7%(+4.80)#28 | 11.4%(-1.90)#6,844 |
| 29. | Vancleave | 9.2% | 4.7%(+4.50)#29 | 11.4%(-2.20)#7,045 |
| 30. | Oxford | 8.7% | 4.7%(+4.00)#30 | 11.4%(-2.70)#7,364 |
| 31. | Agricola | 8.6% | 4.7%(+3.90)#31 | 11.4%(-2.80)#7,482 |
| 32. | Tupelo | 8.3% | 4.7%(+3.60)#32 | 11.4%(-3.10)#7,657 |
| 33. | Beauregard | 8.3% | 4.7%(+3.60)#33 | 11.4%(-3.10)#7,707 |
| 34. | Mantachie | 8.1% | 4.7%(+3.40)#34 | 11.4%(-3.30)#7,864 |
| 35. | Diamondhead | 7.9% | 4.7%(+3.20)#35 | 11.4%(-3.50)#8,000 |
| 36. | New Hope | 7.8% | 4.7%(+3.10)#36 | 11.4%(-3.60)#8,090 |
| 37. | Hernando | 7.6% | 4.7%(+2.90)#37 | 11.4%(-3.80)#8,244 |
| 38. | Robinhood | 7.6% | 4.7%(+2.90)#38 | 11.4%(-3.80)#8,287 |
| 39. | Ocean Springs | 7.4% | 4.7%(+2.70)#39 | 11.4%(-4.00)#8,420 |
| 40. | Purvis | 7.3% | 4.7%(+2.60)#40 | 11.4%(-4.10)#8,548 |
| 41. | Pass Christian | 7.1% | 4.7%(+2.40)#41 | 11.4%(-4.30)#8,713 |
| 42. | Tishomingo | 7.1% | 4.7%(+2.40)#42 | 11.4%(-4.30)#8,741 |
| 43. | Brandon | 7.0% | 4.7%(+2.30)#43 | 11.4%(-4.40)#8,771 |
| 44. | Cleveland | 7.0% | 4.7%(+2.30)#44 | 11.4%(-4.40)#8,784 |
| 45. | Terry | 7.0% | 4.7%(+2.30)#45 | 11.4%(-4.40)#8,816 |
| 46. | Meadville | 6.8% | 4.7%(+2.10)#46 | 11.4%(-4.60)#9,064 |
| 47. | Ackerman | 6.3% | 4.7%(+1.60)#47 | 11.4%(-5.10)#9,587 |
| 48. | Greenwood | 6.2% | 4.7%(+1.50)#48 | 11.4%(-5.20)#9,686 |
| 49. | Carrollton | 6.2% | 4.7%(+1.50)#49 | 11.4%(-5.20)#9,758 |
| 50. | D Iberville | 6.1% | 4.7%(+1.40)#50 | 11.4%(-5.30)#9,799 |
| 51. | Leland | 6.0% | 4.7%(+1.30)#51 | 11.4%(-5.40)#9,946 |
| 52. | Collinsville | 6.0% | 4.7%(+1.30)#52 | 11.4%(-5.40)#9,967 |
| 53. | Toomsuba | 6.0% | 4.7%(+1.30)#53 | 11.4%(-5.40)#9,996 |
| 54. | Hickory | 5.8% | 4.7%(+1.10)#54 | 11.4%(-5.60)#10,277 |
| 55. | Leakesville | 5.7% | 4.7%(+1.00)#55 | 11.4%(-5.70)#10,344 |
| 56. | Polkville | 5.7% | 4.7%(+1.00)#56 | 11.4%(-5.70)#10,398 |
| 57. | Port Gibson | 5.6% | 4.7%(+0.900)#57 | 11.4%(-5.80)#10,531 |
| 58. | Blue Springs | 5.6% | 4.7%(+0.900)#58 | 11.4%(-5.80)#10,574 |
| 59. | Biloxi | 5.5% | 4.7%(+0.800)#59 | 11.4%(-5.90)#10,605 |
| 60. | Long Beach | 5.5% | 4.7%(+0.800)#60 | 11.4%(-5.90)#10,623 |
| 61. | Lexington | 5.5% | 4.7%(+0.800)#61 | 11.4%(-5.90)#10,697 |
| 62. | Kosciusko | 5.4% | 4.7%(+0.700)#62 | 11.4%(-6.00)#10,773 |
| 63. | Southaven | 5.3% | 4.7%(+0.600)#63 | 11.4%(-6.10)#10,881 |
| 64. | Amory | 5.3% | 4.7%(+0.600)#64 | 11.4%(-6.10)#10,913 |
| 65. | Morgantown | 5.3% | 4.7%(+0.600)#65 | 11.4%(-6.10)#10,980 |
| 66. | Bovina | 5.3% | 4.7%(+0.600)#66 | 11.4%(-6.10)#11,010 |
| 67. | Lena | 5.3% | 4.7%(+0.600)#67 | 11.4%(-6.10)#11,025 |
| 68. | Sebastopol | 5.1% | 4.7%(+0.400)#68 | 11.4%(-6.30)#11,312 |
| 69. | Starkville | 5.0% | 4.7%(+0.300)#69 | 11.4%(-6.40)#11,356 |
| 70. | De Kalb | 5.0% | 4.7%(+0.300)#70 | 11.4%(-6.40)#11,452 |
| 71. | Helena | 5.0% | 4.7%(+0.300)#71 | 11.4%(-6.40)#11,458 |
| 72. | Eudora | 4.9% | 4.7%(+0.200)#72 | 11.4%(-6.50)#11,622 |
| 73. | Vicksburg | 4.8% | 4.7%(+0.100)#73 | 11.4%(-6.60)#11,664 |
| 74. | Algoma | 4.8% | 4.7%(+0.100)#74 | 11.4%(-6.60)#11,743 |
| 75. | Seminary | 4.7% | 4.7%(=0.000)#75 | 11.4%(-6.70)#11,954 |
| 76. | Sallis | 4.7% | 4.7%(=0.000)#76 | 11.4%(-6.70)#11,967 |
| 77. | Byram | 4.6% | 4.7%(-0.100)#77 | 11.4%(-6.80)#12,008 |
| 78. | Laurel | 4.5% | 4.7%(-0.200)#78 | 11.4%(-6.90)#12,153 |
| 79. | Corinth | 4.5% | 4.7%(-0.200)#79 | 11.4%(-6.90)#12,158 |
| 80. | Richland | 4.5% | 4.7%(-0.200)#80 | 11.4%(-6.90)#12,178 |
| 81. | Tylertown | 4.5% | 4.7%(-0.200)#81 | 11.4%(-6.90)#12,226 |
| 82. | Dumas | 4.5% | 4.7%(-0.200)#82 | 11.4%(-6.90)#12,297 |
| 83. | Waynesboro | 4.4% | 4.7%(-0.300)#83 | 11.4%(-7.00)#12,395 |
| 84. | Marion | 4.4% | 4.7%(-0.300)#84 | 11.4%(-7.00)#12,413 |
| 85. | Woodville | 4.4% | 4.7%(-0.300)#85 | 11.4%(-7.00)#12,447 |
| 86. | Arnold Line | 4.3% | 4.7%(-0.400)#86 | 11.4%(-7.10)#12,594 |
| 87. | Latimer | 4.2% | 4.7%(-0.500)#87 | 11.4%(-7.20)#12,751 |
| 88. | Ruleville | 4.2% | 4.7%(-0.500)#88 | 11.4%(-7.20)#12,783 |
| 89. | Saltillo | 4.1% | 4.7%(-0.600)#89 | 11.4%(-7.30)#12,932 |
| 90. | Soso | 4.1% | 4.7%(-0.600)#90 | 11.4%(-7.30)#13,032 |
| 91. | Duncan | 4.1% | 4.7%(-0.600)#91 | 11.4%(-7.30)#13,041 |
| 92. | Columbus | 4.0% | 4.7%(-0.700)#92 | 11.4%(-7.40)#13,079 |
| 93. | Gautier | 4.0% | 4.7%(-0.700)#93 | 11.4%(-7.40)#13,087 |
| 94. | Iuka | 4.0% | 4.7%(-0.700)#94 | 11.4%(-7.40)#13,143 |
| 95. | Hattiesburg | 3.9% | 4.7%(-0.800)#95 | 11.4%(-7.50)#13,258 |
| 96. | Booneville | 3.9% | 4.7%(-0.800)#96 | 11.4%(-7.50)#13,300 |
| 97. | Senatobia | 3.9% | 4.7%(-0.800)#97 | 11.4%(-7.50)#13,303 |
| 98. | Gulf Park Estates | 3.9% | 4.7%(-0.800)#98 | 11.4%(-7.50)#13,311 |
| 99. | Guntown | 3.9% | 4.7%(-0.800)#99 | 11.4%(-7.50)#13,351 |
| 100. | Sunflower | 3.9% | 4.7%(-0.800)#100 | 11.4%(-7.50)#13,382 |
Common Questions
What are the Top 10 Cities with the Highest Percentage of Households with Income Above $200,000 in Mississippi?
Top 10 Cities with the Highest Percentage of Households with Income Above $200,000 in Mississippi are:
#1
26.1%
#2
18.2%
#3
14.6%
#4
13.8%
#5
13.7%
#6
13.1%
#7
12.7%
#8
12.5%
#9
11.5%
#10
11.4%
What city has the Highest Percentage of Households with Income Above $200,000 in Mississippi?
Madison has the Highest Percentage of Households with Income Above $200,000 in Mississippi with 26.1%.
What is the Percentage of Households with Income Above $200,000 in the State of Mississippi?
Percentage of Households with Income Above $200,000 in Mississippi is 4.7%.
What is the Percentage of Households with Income Above $200,000 in the United States?
Percentage of Households with Income Above $200,000 in the United States is 11.4%.