Cities with the Highest Percentage of Households with Income Above $200,000 in South Carolina
RELATED REPORTS & OPTIONS
Household Income | $200k+
South Carolina
Compare Cities
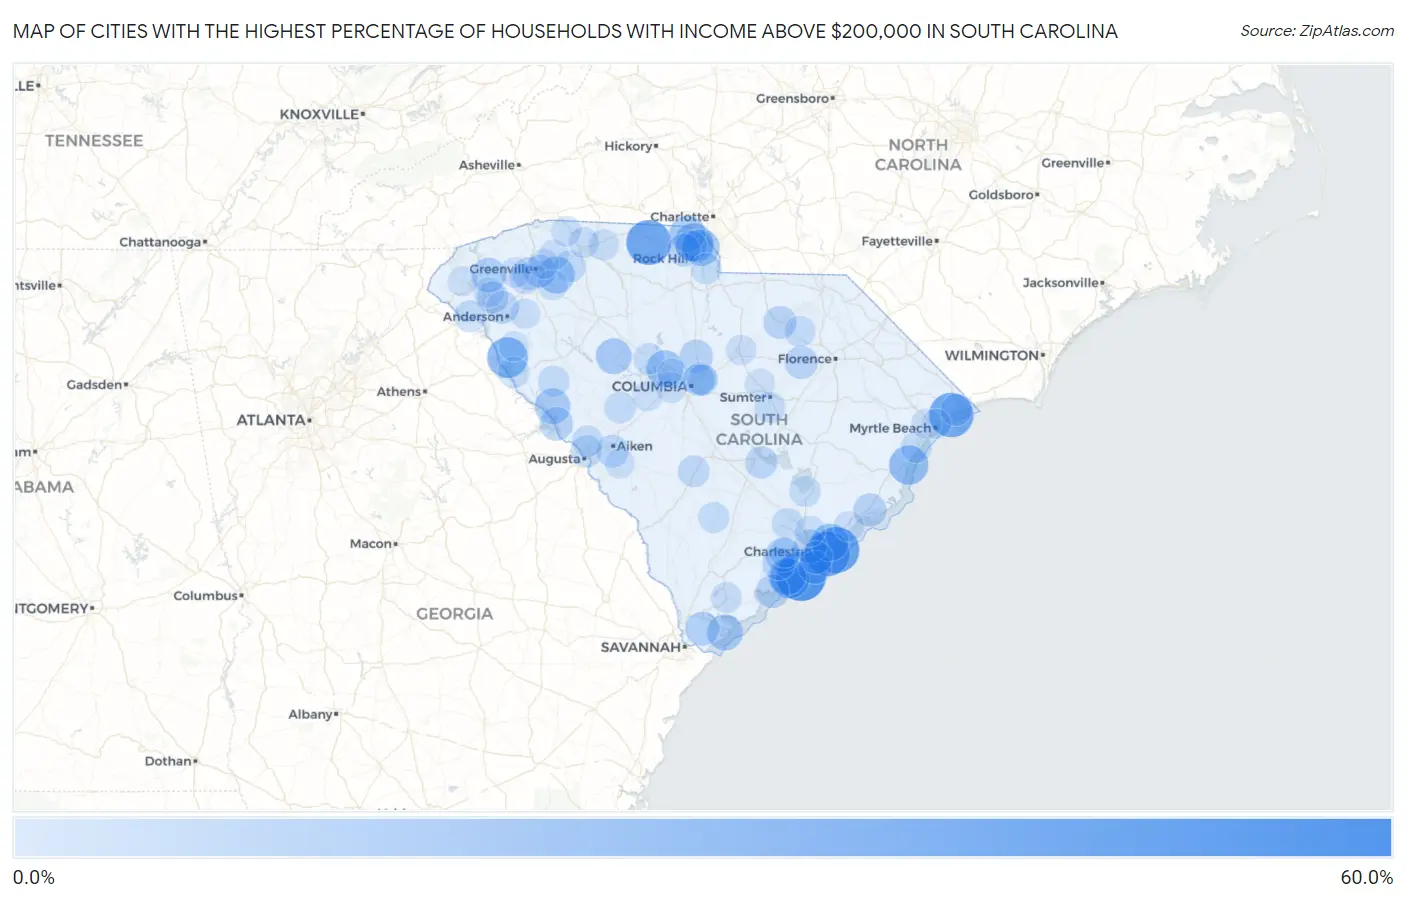
Map of Cities with the Highest Percentage of Households with Income Above $200,000 in South Carolina
0.0%
60.0%
Cities with the Highest Percentage of Households with Income Above $200,000 in South Carolina
| City | Households with Income > $200k | vs State | vs National | |
| 1. | Debordieu Colony | 56.1% | 7.4%(+48.7)#1 | 11.4%(+44.7)#271 |
| 2. | Kiawah Island | 53.4% | 7.4%(+46.0)#2 | 11.4%(+42.0)#349 |
| 3. | Isle Of Palms | 44.8% | 7.4%(+37.4)#3 | 11.4%(+33.4)#618 |
| 4. | Sullivan S Island | 42.1% | 7.4%(+34.7)#4 | 11.4%(+30.7)#731 |
| 5. | Smyrna | 41.7% | 7.4%(+34.3)#5 | 11.4%(+30.3)#750 |
| 6. | Briarcliffe Acres | 41.0% | 7.4%(+33.6)#6 | 11.4%(+29.6)#783 |
| 7. | Pimlico | 38.5% | 7.4%(+31.1)#7 | 11.4%(+27.1)#928 |
| 8. | Lowndesville | 31.8% | 7.4%(+24.4)#8 | 11.4%(+20.4)#1,454 |
| 9. | The Cliffs Valley | 29.2% | 7.4%(+21.8)#9 | 11.4%(+17.8)#1,691 |
| 10. | Seabrook Island | 28.3% | 7.4%(+20.9)#10 | 11.4%(+16.9)#1,795 |
| 11. | Pawleys Island | 28.1% | 7.4%(+20.7)#11 | 11.4%(+16.7)#1,808 |
| 12. | Baxter | 27.9% | 7.4%(+20.5)#12 | 11.4%(+16.5)#1,829 |
| 13. | Tega Cay | 25.8% | 7.4%(+18.4)#13 | 11.4%(+14.4)#2,075 |
| 14. | Mount Pleasant | 24.4% | 7.4%(+17.0)#14 | 11.4%(+13.0)#2,240 |
| 15. | Helena | 23.9% | 7.4%(+16.5)#15 | 11.4%(+12.5)#2,338 |
| 16. | Rockville | 23.6% | 7.4%(+16.2)#16 | 11.4%(+12.2)#2,388 |
| 17. | Five Forks | 22.7% | 7.4%(+15.3)#17 | 11.4%(+11.3)#2,518 |
| 18. | Lake Murray Of Richland | 22.7% | 7.4%(+15.3)#18 | 11.4%(+11.3)#2,523 |
| 19. | Daufuskie Island | 22.6% | 7.4%(+15.2)#19 | 11.4%(+11.2)#2,554 |
| 20. | Fort Mill | 22.0% | 7.4%(+14.6)#20 | 11.4%(+10.6)#2,652 |
| 21. | Lake Wylie | 20.7% | 7.4%(+13.3)#21 | 11.4%(+9.30)#2,898 |
| 22. | Hilton Head Island | 20.2% | 7.4%(+12.8)#22 | 11.4%(+8.80)#2,997 |
| 23. | Silverstreet | 20.0% | 7.4%(+12.6)#23 | 11.4%(+8.60)#3,055 |
| 24. | Plum Branch | 19.4% | 7.4%(+12.0)#24 | 11.4%(+8.00)#3,185 |
| 25. | Six Mile | 16.8% | 7.4%(+9.40)#25 | 11.4%(+5.40)#3,768 |
| 26. | Hollywood | 16.1% | 7.4%(+8.70)#26 | 11.4%(+4.70)#3,949 |
| 27. | Bluffton | 15.7% | 7.4%(+8.30)#27 | 11.4%(+4.30)#4,057 |
| 28. | Glenn Springs | 15.7% | 7.4%(+8.30)#28 | 11.4%(+4.30)#4,079 |
| 29. | Keowee Key | 15.6% | 7.4%(+8.20)#29 | 11.4%(+4.20)#4,101 |
| 30. | Modoc | 14.9% | 7.4%(+7.50)#30 | 11.4%(+3.50)#4,338 |
| 31. | Charleston | 14.7% | 7.4%(+7.30)#31 | 11.4%(+3.30)#4,379 |
| 32. | Edisto Beach | 14.7% | 7.4%(+7.30)#32 | 11.4%(+3.30)#4,402 |
| 33. | Blythewood | 14.4% | 7.4%(+7.00)#33 | 11.4%(+3.00)#4,497 |
| 34. | Riverview | 13.9% | 7.4%(+6.50)#34 | 11.4%(+2.50)#4,702 |
| 35. | Mcclellanville | 13.9% | 7.4%(+6.50)#35 | 11.4%(+2.50)#4,714 |
| 36. | Newport | 13.6% | 7.4%(+6.20)#36 | 11.4%(+2.20)#4,825 |
| 37. | Lamar | 13.6% | 7.4%(+6.20)#37 | 11.4%(+2.20)#4,833 |
| 38. | Mcbee | 13.6% | 7.4%(+6.20)#38 | 11.4%(+2.20)#4,835 |
| 39. | Folly Beach | 13.3% | 7.4%(+5.90)#39 | 11.4%(+1.90)#4,945 |
| 40. | Welcome | 13.2% | 7.4%(+5.80)#40 | 11.4%(+1.80)#4,974 |
| 41. | Meggett | 13.0% | 7.4%(+5.60)#41 | 11.4%(+1.60)#5,076 |
| 42. | James Island | 12.8% | 7.4%(+5.40)#42 | 11.4%(+1.40)#5,155 |
| 43. | Arcadia Lakes | 12.8% | 7.4%(+5.40)#43 | 11.4%(+1.40)#5,179 |
| 44. | Greenville | 12.5% | 7.4%(+5.10)#44 | 11.4%(+1.10)#5,265 |
| 45. | Northlake | 12.4% | 7.4%(+5.00)#45 | 11.4%(+1.000)#5,342 |
| 46. | Aiken | 12.0% | 7.4%(+4.60)#46 | 11.4%(+0.600)#5,515 |
| 47. | Fripp Island | 12.0% | 7.4%(+4.60)#47 | 11.4%(+0.600)#5,542 |
| 48. | Vance | 11.8% | 7.4%(+4.40)#48 | 11.4%(+0.400)#5,647 |
| 49. | Pendleton | 11.2% | 7.4%(+3.80)#49 | 11.4%(-0.200)#5,879 |
| 50. | North Augusta | 11.1% | 7.4%(+3.70)#50 | 11.4%(-0.300)#5,902 |
| 51. | Fair Play | 11.0% | 7.4%(+3.60)#51 | 11.4%(-0.400)#5,993 |
| 52. | Forest Acres | 10.6% | 7.4%(+3.20)#52 | 11.4%(-0.800)#6,174 |
| 53. | North Myrtle Beach | 10.5% | 7.4%(+3.10)#53 | 11.4%(-0.900)#6,222 |
| 54. | Cope | 10.5% | 7.4%(+3.10)#54 | 11.4%(-0.900)#6,262 |
| 55. | Reidville | 10.3% | 7.4%(+2.90)#55 | 11.4%(-1.10)#6,352 |
| 56. | Ridge Spring | 10.1% | 7.4%(+2.70)#56 | 11.4%(-1.30)#6,479 |
| 57. | India Hook | 9.8% | 7.4%(+2.40)#57 | 11.4%(-1.60)#6,645 |
| 58. | Calhoun Falls | 9.8% | 7.4%(+2.40)#58 | 11.4%(-1.60)#6,663 |
| 59. | Dunbar | 9.8% | 7.4%(+2.40)#59 | 11.4%(-1.60)#6,673 |
| 60. | Murphys Estates | 9.7% | 7.4%(+2.30)#60 | 11.4%(-1.70)#6,734 |
| 61. | Summerville | 9.6% | 7.4%(+2.20)#61 | 11.4%(-1.80)#6,754 |
| 62. | Bradley | 9.6% | 7.4%(+2.20)#62 | 11.4%(-1.80)#6,816 |
| 63. | Litchfield Beach | 9.4% | 7.4%(+2.00)#63 | 11.4%(-2.00)#6,906 |
| 64. | Murrells Inlet | 9.3% | 7.4%(+1.90)#64 | 11.4%(-2.10)#6,983 |
| 65. | Pinopolis | 9.3% | 7.4%(+1.90)#65 | 11.4%(-2.10)#7,009 |
| 66. | Little Mountain | 9.1% | 7.4%(+1.70)#66 | 11.4%(-2.30)#7,148 |
| 67. | Columbia | 9.0% | 7.4%(+1.60)#67 | 11.4%(-2.40)#7,165 |
| 68. | Williams | 9.0% | 7.4%(+1.60)#68 | 11.4%(-2.40)#7,216 |
| 69. | North Hartsville | 8.9% | 7.4%(+1.50)#69 | 11.4%(-2.50)#7,244 |
| 70. | Lakewood | 8.9% | 7.4%(+1.50)#70 | 11.4%(-2.50)#7,245 |
| 71. | Catawba | 8.7% | 7.4%(+1.30)#71 | 11.4%(-2.70)#7,397 |
| 72. | Beaufort | 8.6% | 7.4%(+1.20)#72 | 11.4%(-2.80)#7,441 |
| 73. | Cowpens | 8.5% | 7.4%(+1.10)#73 | 11.4%(-2.90)#7,536 |
| 74. | Powdersville | 8.3% | 7.4%(+0.900)#74 | 11.4%(-3.10)#7,668 |
| 75. | Grover | 8.3% | 7.4%(+0.900)#75 | 11.4%(-3.10)#7,712 |
| 76. | Boiling Springs | 8.2% | 7.4%(+0.800)#76 | 11.4%(-3.20)#7,748 |
| 77. | Greer | 8.1% | 7.4%(+0.700)#77 | 11.4%(-3.30)#7,821 |
| 78. | Lexington | 8.1% | 7.4%(+0.700)#78 | 11.4%(-3.30)#7,823 |
| 79. | Hanahan | 8.0% | 7.4%(+0.600)#79 | 11.4%(-3.40)#7,912 |
| 80. | North Santee | 7.7% | 7.4%(+0.300)#80 | 11.4%(-3.70)#8,208 |
| 81. | Simpsonville | 7.6% | 7.4%(+0.200)#81 | 11.4%(-3.80)#8,240 |
| 82. | Campobello | 7.6% | 7.4%(+0.200)#82 | 11.4%(-3.80)#8,294 |
| 83. | Irmo | 7.5% | 7.4%(+0.100)#83 | 11.4%(-3.90)#8,332 |
| 84. | Awendaw | 7.4% | 7.4%(=0.000)#84 | 11.4%(-4.00)#8,453 |
| 85. | Camden | 7.3% | 7.4%(-0.100)#85 | 11.4%(-4.10)#8,520 |
| 86. | Buford | 7.3% | 7.4%(-0.100)#86 | 11.4%(-4.10)#8,571 |
| 87. | Ravenel | 7.2% | 7.4%(-0.200)#87 | 11.4%(-4.20)#8,627 |
| 88. | Easley | 7.1% | 7.4%(-0.300)#88 | 11.4%(-4.30)#8,686 |
| 89. | Clemson | 7.1% | 7.4%(-0.300)#89 | 11.4%(-4.30)#8,692 |
| 90. | Belton | 7.1% | 7.4%(-0.300)#90 | 11.4%(-4.30)#8,715 |
| 91. | Summit | 7.0% | 7.4%(-0.400)#91 | 11.4%(-4.40)#8,841 |
| 92. | Forestbrook | 6.9% | 7.4%(-0.500)#92 | 11.4%(-4.50)#8,887 |
| 93. | Dalzell | 6.9% | 7.4%(-0.500)#93 | 11.4%(-4.50)#8,900 |
| 94. | Lake Secession | 6.9% | 7.4%(-0.500)#94 | 11.4%(-4.50)#8,927 |
| 95. | Seabrook | 6.9% | 7.4%(-0.500)#95 | 11.4%(-4.50)#8,931 |
| 96. | West Union | 6.8% | 7.4%(-0.600)#96 | 11.4%(-4.60)#9,071 |
| 97. | Myrtle Beach | 6.7% | 7.4%(-0.700)#97 | 11.4%(-4.70)#9,098 |
| 98. | Carolina Forest | 6.7% | 7.4%(-0.700)#98 | 11.4%(-4.70)#9,107 |
| 99. | Wade Hampton | 6.7% | 7.4%(-0.700)#99 | 11.4%(-4.70)#9,108 |
| 100. | New Ellenton | 6.6% | 7.4%(-0.800)#100 | 11.4%(-4.80)#9,270 |
Common Questions
What are the Top 10 Cities with the Highest Percentage of Households with Income Above $200,000 in South Carolina?
Top 10 Cities with the Highest Percentage of Households with Income Above $200,000 in South Carolina are:
#1
53.4%
#2
44.8%
#3
42.1%
#4
41.7%
#5
41.0%
#6
31.8%
#7
28.3%
#8
28.1%
#9
25.8%
#10
24.4%
What city has the Highest Percentage of Households with Income Above $200,000 in South Carolina?
Kiawah Island has the Highest Percentage of Households with Income Above $200,000 in South Carolina with 53.4%.
What is the Percentage of Households with Income Above $200,000 in the State of South Carolina?
Percentage of Households with Income Above $200,000 in South Carolina is 7.4%.
What is the Percentage of Households with Income Above $200,000 in the United States?
Percentage of Households with Income Above $200,000 in the United States is 11.4%.