Cities with the Highest Percentage of Households with Income Above $200,000 in South Dakota
RELATED REPORTS & OPTIONS
Household Income | $200k+
South Dakota
Compare Cities
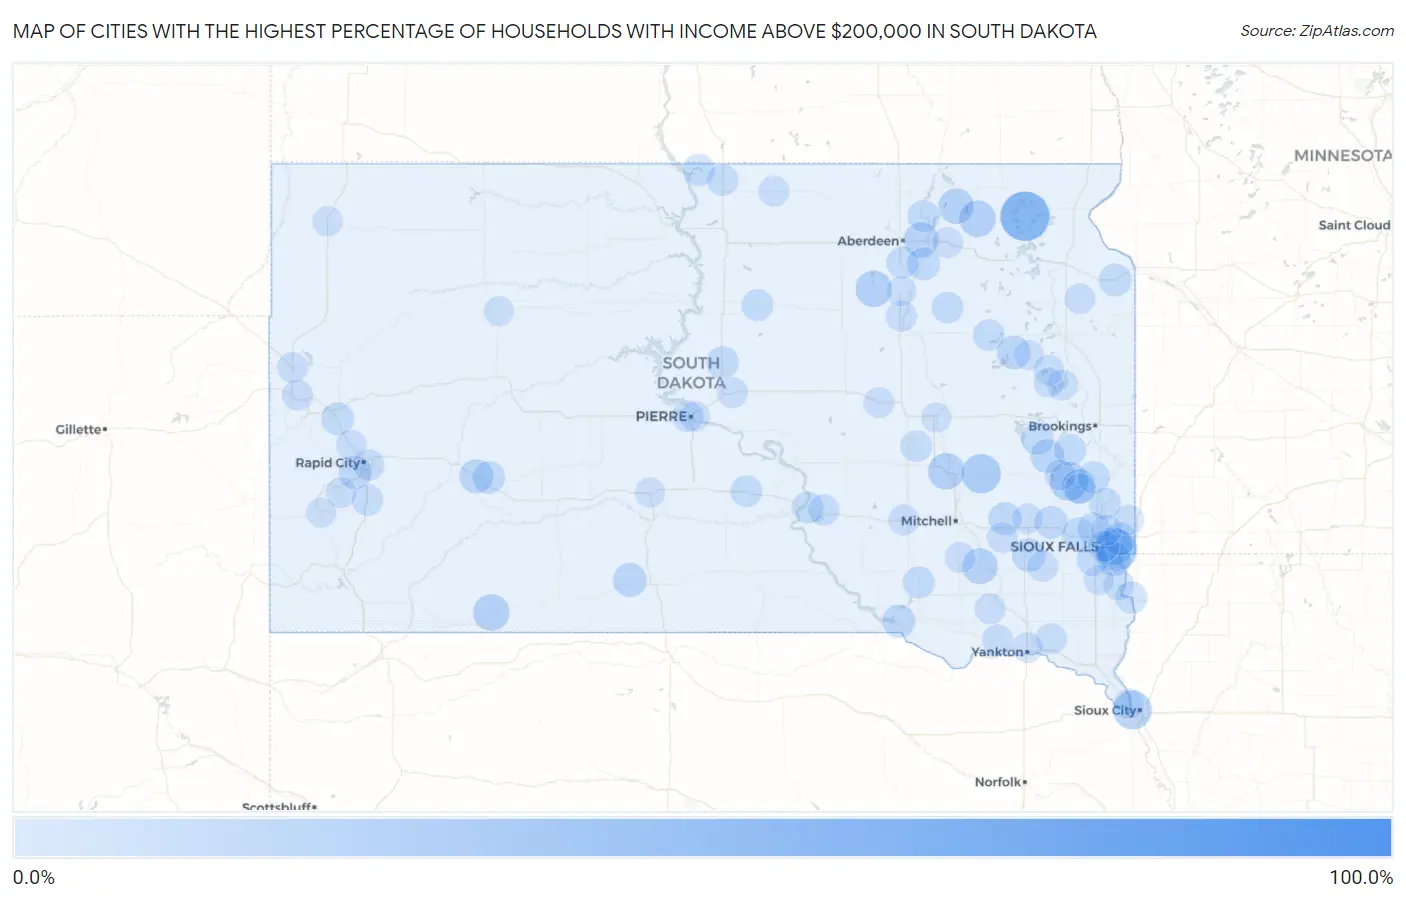
Map of Cities with the Highest Percentage of Households with Income Above $200,000 in South Dakota
0.0%
100.0%
Cities with the Highest Percentage of Households with Income Above $200,000 in South Dakota
| City | Households with Income > $200k | vs State | vs National | |
| 1. | Orland Colony | 100.0% | 6.5%(+93.5)#1 | 11.4%(+88.6)#12 |
| 2. | Glendale Colony | 76.5% | 6.5%(+70.0)#2 | 11.4%(+65.1)#41 |
| 3. | Eden | 53.0% | 6.5%(+46.5)#3 | 11.4%(+41.6)#367 |
| 4. | Angostura | 34.7% | 6.5%(+28.2)#4 | 11.4%(+23.3)#1,197 |
| 5. | Mountain Plains | 34.3% | 6.5%(+27.8)#5 | 11.4%(+22.9)#1,226 |
| 6. | Anderson | 32.8% | 6.5%(+26.3)#6 | 11.4%(+21.4)#1,359 |
| 7. | Prairiewood | 28.0% | 6.5%(+21.5)#7 | 11.4%(+16.6)#1,819 |
| 8. | Fedora | 26.7% | 6.5%(+20.2)#8 | 11.4%(+15.3)#1,974 |
| 9. | Lake Madison | 25.7% | 6.5%(+19.2)#9 | 11.4%(+14.3)#2,096 |
| 10. | Dakota Dunes | 25.6% | 6.5%(+19.1)#10 | 11.4%(+14.2)#2,105 |
| 11. | Pine Lakes Addition | 22.7% | 6.5%(+16.2)#11 | 11.4%(+11.3)#2,537 |
| 12. | Langford | 20.0% | 6.5%(+13.5)#12 | 11.4%(+8.60)#3,050 |
| 13. | Batesland | 20.0% | 6.5%(+13.5)#13 | 11.4%(+8.60)#3,059 |
| 14. | Chelsea | 20.0% | 6.5%(+13.5)#14 | 11.4%(+8.60)#3,062 |
| 15. | Forestburg | 20.0% | 6.5%(+13.5)#15 | 11.4%(+8.60)#3,064 |
| 16. | Milltown | 18.2% | 6.5%(+11.7)#16 | 11.4%(+6.80)#3,467 |
| 17. | Claremont | 17.9% | 6.5%(+11.4)#17 | 11.4%(+6.50)#3,539 |
| 18. | Bath | 16.7% | 6.5%(+10.2)#18 | 11.4%(+5.30)#3,803 |
| 19. | Shindler | 14.8% | 6.5%(+8.30)#19 | 11.4%(+3.40)#4,376 |
| 20. | Brant Lake | 14.7% | 6.5%(+8.20)#20 | 11.4%(+3.30)#4,412 |
| 21. | Kenel | 14.5% | 6.5%(+8.00)#21 | 11.4%(+3.10)#4,474 |
| 22. | Soldier Creek | 13.8% | 6.5%(+7.30)#22 | 11.4%(+2.40)#4,755 |
| 23. | Wall | 13.6% | 6.5%(+7.10)#23 | 11.4%(+2.20)#4,837 |
| 24. | Naples | 13.3% | 6.5%(+6.80)#24 | 11.4%(+1.90)#4,956 |
| 25. | Ramona | 13.2% | 6.5%(+6.70)#25 | 11.4%(+1.80)#4,997 |
| 26. | Dolton | 12.5% | 6.5%(+6.00)#26 | 11.4%(+1.10)#5,315 |
| 27. | Pickstown | 12.0% | 6.5%(+5.50)#27 | 11.4%(+0.600)#5,551 |
| 28. | Colonial Pine Hills | 11.6% | 6.5%(+5.10)#28 | 11.4%(+0.200)#5,719 |
| 29. | Montrose | 11.6% | 6.5%(+5.10)#29 | 11.4%(+0.200)#5,729 |
| 30. | Mina | 11.5% | 6.5%(+5.00)#30 | 11.4%(+0.100)#5,774 |
| 31. | Spencer | 11.5% | 6.5%(+5.00)#31 | 11.4%(+0.100)#5,784 |
| 32. | Stratford | 11.1% | 6.5%(+4.60)#32 | 11.4%(-0.300)#5,950 |
| 33. | Hartford | 11.0% | 6.5%(+4.50)#33 | 11.4%(-0.400)#5,969 |
| 34. | Crooks | 10.9% | 6.5%(+4.40)#34 | 11.4%(-0.500)#6,039 |
| 35. | Milbank | 10.7% | 6.5%(+4.20)#35 | 11.4%(-0.700)#6,129 |
| 36. | Brandon | 10.6% | 6.5%(+4.10)#36 | 11.4%(-0.800)#6,173 |
| 37. | Blucksberg Mountain | 10.5% | 6.5%(+4.00)#37 | 11.4%(-0.900)#6,249 |
| 38. | Quinn | 10.5% | 6.5%(+4.00)#38 | 11.4%(-0.900)#6,261 |
| 39. | Oldham | 10.1% | 6.5%(+3.60)#39 | 11.4%(-1.30)#6,486 |
| 40. | Onida | 10.0% | 6.5%(+3.50)#40 | 11.4%(-1.40)#6,526 |
| 41. | Pollock | 9.4% | 6.5%(+2.90)#41 | 11.4%(-2.00)#6,957 |
| 42. | Warner | 9.3% | 6.5%(+2.80)#42 | 11.4%(-2.10)#7,015 |
| 43. | Colman | 9.2% | 6.5%(+2.70)#43 | 11.4%(-2.20)#7,072 |
| 44. | Fairview | 9.1% | 6.5%(+2.60)#44 | 11.4%(-2.30)#7,156 |
| 45. | Nunda | 9.1% | 6.5%(+2.60)#45 | 11.4%(-2.30)#7,163 |
| 46. | Columbia | 8.9% | 6.5%(+2.40)#46 | 11.4%(-2.50)#7,277 |
| 47. | Dell Rapids | 8.8% | 6.5%(+2.30)#47 | 11.4%(-2.60)#7,309 |
| 48. | Armour | 8.6% | 6.5%(+2.10)#48 | 11.4%(-2.80)#7,477 |
| 49. | Tea | 8.4% | 6.5%(+1.90)#49 | 11.4%(-3.00)#7,593 |
| 50. | Kennebec | 8.4% | 6.5%(+1.90)#50 | 11.4%(-3.00)#7,639 |
| 51. | Chamberlain | 8.3% | 6.5%(+1.80)#51 | 11.4%(-3.10)#7,684 |
| 52. | Clark | 8.3% | 6.5%(+1.80)#52 | 11.4%(-3.10)#7,697 |
| 53. | Lebanon | 8.3% | 6.5%(+1.80)#53 | 11.4%(-3.10)#7,728 |
| 54. | Turton | 8.3% | 6.5%(+1.80)#54 | 11.4%(-3.10)#7,731 |
| 55. | Alpena | 8.2% | 6.5%(+1.70)#55 | 11.4%(-3.20)#7,801 |
| 56. | Herreid | 7.9% | 6.5%(+1.40)#56 | 11.4%(-3.50)#8,044 |
| 57. | Fort Pierre | 7.6% | 6.5%(+1.10)#57 | 11.4%(-3.80)#8,273 |
| 58. | Sioux Falls | 7.5% | 6.5%(+1.000)#58 | 11.4%(-3.90)#8,313 |
| 59. | Hermosa | 7.4% | 6.5%(+0.900)#59 | 11.4%(-4.00)#8,484 |
| 60. | Rapid City | 7.3% | 6.5%(+0.800)#60 | 11.4%(-4.10)#8,508 |
| 61. | Boulder Canyon | 7.3% | 6.5%(+0.800)#61 | 11.4%(-4.10)#8,570 |
| 62. | Pukwana | 6.9% | 6.5%(+0.400)#62 | 11.4%(-4.50)#8,954 |
| 63. | Volin | 6.8% | 6.5%(+0.300)#63 | 11.4%(-4.60)#9,086 |
| 64. | Tabor | 6.7% | 6.5%(+0.200)#64 | 11.4%(-4.70)#9,185 |
| 65. | Scotland | 6.5% | 6.5%(=0.000)#65 | 11.4%(-4.90)#9,392 |
| 66. | Spearfish | 6.4% | 6.5%(-0.100)#66 | 11.4%(-5.00)#9,447 |
| 67. | Eureka | 6.3% | 6.5%(-0.200)#67 | 11.4%(-5.10)#9,605 |
| 68. | Emery | 6.3% | 6.5%(-0.200)#68 | 11.4%(-5.10)#9,633 |
| 69. | Lake Poinsett | 6.3% | 6.5%(-0.200)#69 | 11.4%(-5.10)#9,637 |
| 70. | Renner Corner | 6.3% | 6.5%(-0.200)#70 | 11.4%(-5.10)#9,649 |
| 71. | Ashton | 6.3% | 6.5%(-0.200)#71 | 11.4%(-5.10)#9,656 |
| 72. | Belle Fourche | 6.2% | 6.5%(-0.300)#72 | 11.4%(-5.20)#9,706 |
| 73. | Plankinton | 6.1% | 6.5%(-0.400)#73 | 11.4%(-5.30)#9,872 |
| 74. | Summerset | 6.0% | 6.5%(-0.500)#74 | 11.4%(-5.40)#9,954 |
| 75. | Marion | 5.9% | 6.5%(-0.600)#75 | 11.4%(-5.50)#10,124 |
| 76. | Madison | 5.8% | 6.5%(-0.700)#76 | 11.4%(-5.60)#10,192 |
| 77. | Groton | 5.8% | 6.5%(-0.700)#77 | 11.4%(-5.60)#10,230 |
| 78. | Keystone | 5.8% | 6.5%(-0.700)#78 | 11.4%(-5.60)#10,280 |
| 79. | Brant Lake South | 5.8% | 6.5%(-0.700)#79 | 11.4%(-5.60)#10,295 |
| 80. | Yankton | 5.7% | 6.5%(-0.800)#80 | 11.4%(-5.70)#10,322 |
| 81. | South Shore | 5.7% | 6.5%(-0.800)#81 | 11.4%(-5.70)#10,421 |
| 82. | Dimock | 5.7% | 6.5%(-0.800)#82 | 11.4%(-5.70)#10,431 |
| 83. | Blunt | 5.6% | 6.5%(-0.900)#83 | 11.4%(-5.80)#10,582 |
| 84. | Wessington | 5.6% | 6.5%(-0.900)#84 | 11.4%(-5.80)#10,583 |
| 85. | Canton | 5.5% | 6.5%(-1.00)#85 | 11.4%(-5.90)#10,664 |
| 86. | Salem | 5.3% | 6.5%(-1.20)#86 | 11.4%(-6.10)#10,971 |
| 87. | Hayti | 5.2% | 6.5%(-1.30)#87 | 11.4%(-6.20)#11,154 |
| 88. | Garretson | 5.0% | 6.5%(-1.50)#88 | 11.4%(-6.40)#11,439 |
| 89. | Murdo | 5.0% | 6.5%(-1.50)#89 | 11.4%(-6.40)#11,459 |
| 90. | Pierre | 4.9% | 6.5%(-1.60)#90 | 11.4%(-6.50)#11,521 |
| 91. | Hazel | 4.9% | 6.5%(-1.60)#91 | 11.4%(-6.50)#11,646 |
| 92. | North Sioux City | 4.8% | 6.5%(-1.70)#92 | 11.4%(-6.60)#11,703 |
| 93. | Lake Norden | 4.7% | 6.5%(-1.80)#93 | 11.4%(-6.70)#11,929 |
| 94. | Buffalo | 4.7% | 6.5%(-1.80)#94 | 11.4%(-6.70)#11,955 |
| 95. | Enemy Swim | 4.6% | 6.5%(-1.90)#95 | 11.4%(-6.80)#12,122 |
| 96. | Custer | 4.5% | 6.5%(-2.00)#96 | 11.4%(-6.90)#12,233 |
| 97. | Mellette | 4.5% | 6.5%(-2.00)#97 | 11.4%(-6.90)#12,310 |
| 98. | Huron | 4.3% | 6.5%(-2.20)#98 | 11.4%(-7.10)#12,532 |
| 99. | Worthing | 4.3% | 6.5%(-2.20)#99 | 11.4%(-7.10)#12,626 |
| 100. | Faith | 4.3% | 6.5%(-2.20)#100 | 11.4%(-7.10)#12,674 |
Common Questions
What are the Top 10 Cities with the Highest Percentage of Households with Income Above $200,000 in South Dakota?
Top 10 Cities with the Highest Percentage of Households with Income Above $200,000 in South Dakota are:
#1
53.0%
#2
32.8%
#3
26.7%
#4
25.7%
#5
25.6%
#6
22.7%
#7
20.0%
#8
20.0%
#9
20.0%
#10
20.0%
What city has the Highest Percentage of Households with Income Above $200,000 in South Dakota?
Eden has the Highest Percentage of Households with Income Above $200,000 in South Dakota with 53.0%.
What is the Percentage of Households with Income Above $200,000 in the State of South Dakota?
Percentage of Households with Income Above $200,000 in South Dakota is 6.5%.
What is the Percentage of Households with Income Above $200,000 in the United States?
Percentage of Households with Income Above $200,000 in the United States is 11.4%.