Glen Ellen, CA Map & Demographics
Glen Ellen Map
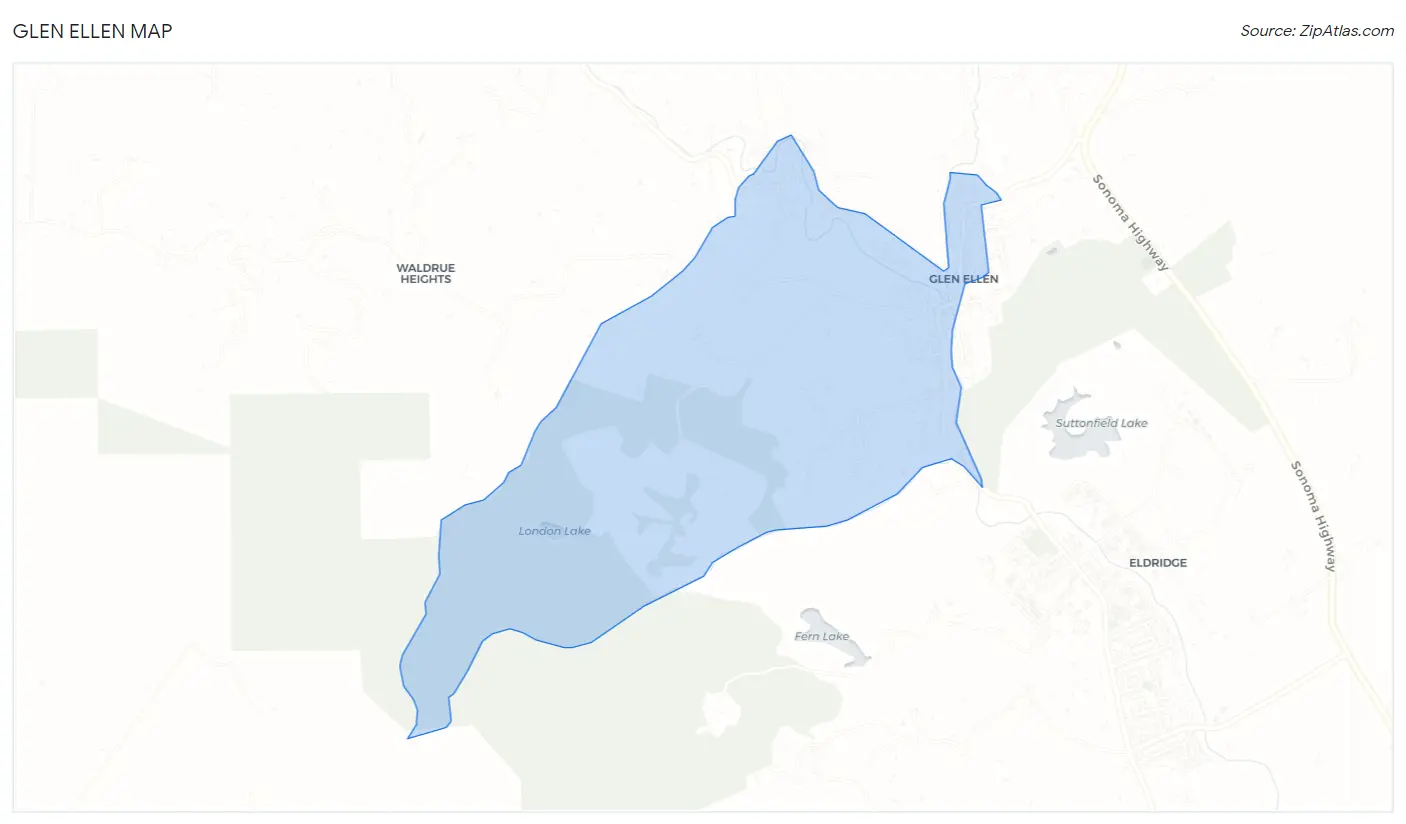
Glen Ellen Overview
$205,652
PER CAPITA INCOME
$202,557
AVG FAMILY INCOME
$250,001
AVG HOUSEHOLD INCOME
0.38
INEQUALITY / GINI INDEX
998
TOTAL POPULATION
586
MALE POPULATION
412
FEMALE POPULATION
142.23
MALES / 100 FEMALES
70.31
FEMALES / 100 MALES
57.8
MEDIAN AGE
2.7
AVG FAMILY SIZE
1.9
AVG HOUSEHOLD SIZE
527
LABOR FORCE [ PEOPLE ]
55.8%
PERCENT IN LABOR FORCE
4.6%
UNEMPLOYMENT RATE
Glen Ellen Zip Codes
Glen Ellen Area Codes
Income in Glen Ellen
Income Overview in Glen Ellen
Per Capita Income in Glen Ellen is $205,652, while median incomes of families and households are $202,557 and $250,001 respectively.
| Characteristic | Number | Measure |
| Per Capita Income | 998 | $205,652 |
| Median Family Income | 127 | $202,557 |
| Mean Family Income | 127 | $236,864 |
| Median Household Income | 526 | $250,001 |
| Mean Household Income | 526 | $390,283 |
| Income Deficit | 127 | $0 |
| Wage / Income Gap (%) | 998 | 0.00% |
| Wage / Income Gap ($) | 998 | 100.00¢ per $1 |
| Gini / Inequality Index | 998 | 0.38 |
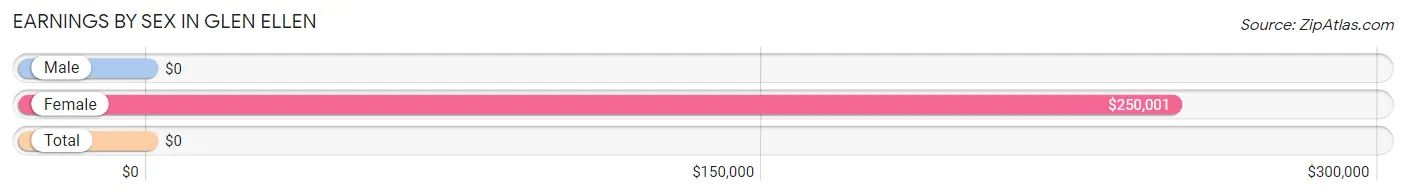
Earnings by Sex in Glen Ellen
| Sex | Number | Average Earnings |
| Male | 250 (42.2%) | $0 |
| Female | 343 (57.8%) | $250,001 |
| Total | 593 (100.0%) | $0 |
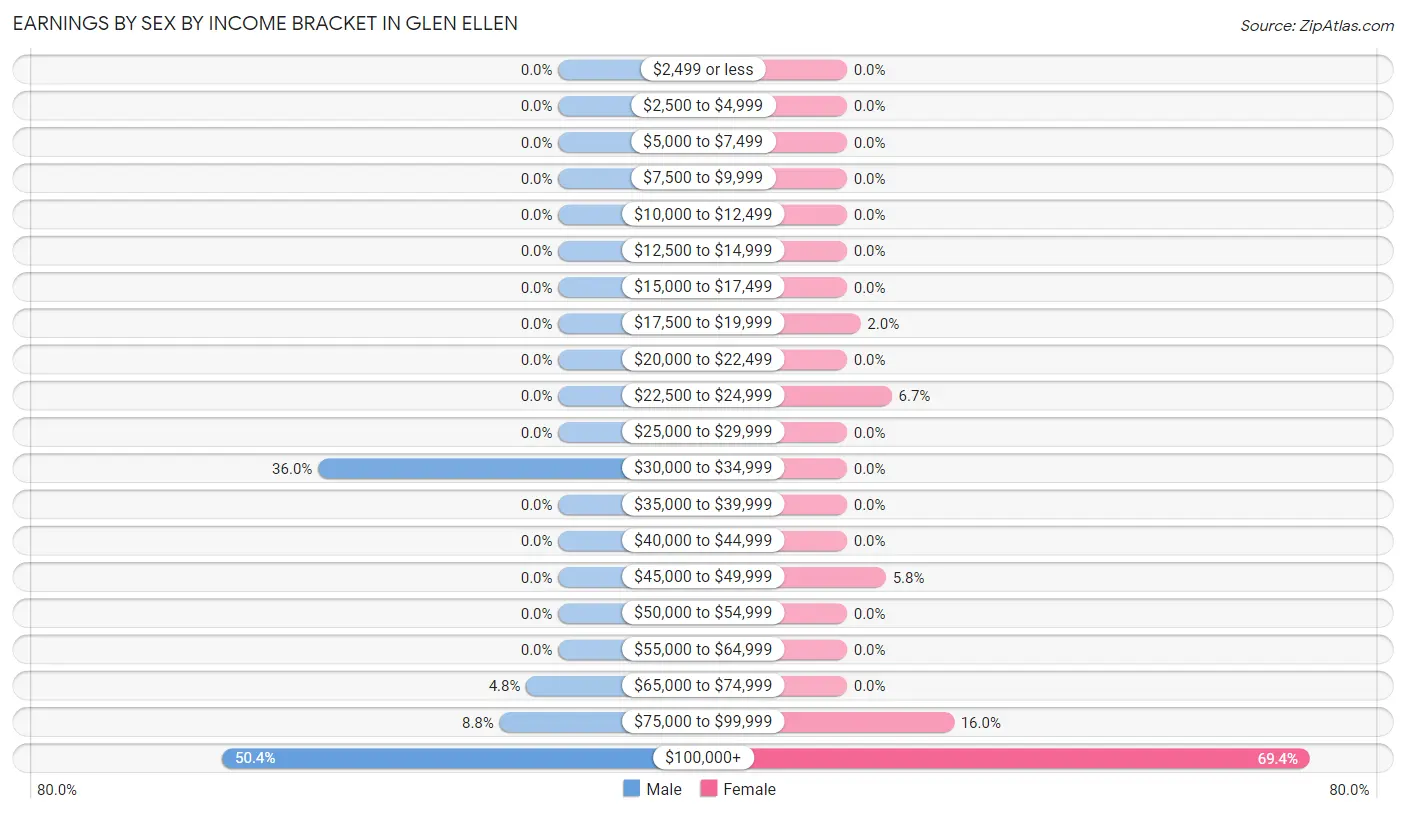
Earnings by Sex by Income Bracket in Glen Ellen
The most common earnings brackets in Glen Ellen are $100,000+ for men (126 | 50.4%) and $100,000+ for women (238 | 69.4%).
| Income | Male | Female |
| $2,499 or less | 0 (0.0%) | 0 (0.0%) |
| $2,500 to $4,999 | 0 (0.0%) | 0 (0.0%) |
| $5,000 to $7,499 | 0 (0.0%) | 0 (0.0%) |
| $7,500 to $9,999 | 0 (0.0%) | 0 (0.0%) |
| $10,000 to $12,499 | 0 (0.0%) | 0 (0.0%) |
| $12,500 to $14,999 | 0 (0.0%) | 0 (0.0%) |
| $15,000 to $17,499 | 0 (0.0%) | 0 (0.0%) |
| $17,500 to $19,999 | 0 (0.0%) | 7 (2.0%) |
| $20,000 to $22,499 | 0 (0.0%) | 0 (0.0%) |
| $22,500 to $24,999 | 0 (0.0%) | 23 (6.7%) |
| $25,000 to $29,999 | 0 (0.0%) | 0 (0.0%) |
| $30,000 to $34,999 | 90 (36.0%) | 0 (0.0%) |
| $35,000 to $39,999 | 0 (0.0%) | 0 (0.0%) |
| $40,000 to $44,999 | 0 (0.0%) | 0 (0.0%) |
| $45,000 to $49,999 | 0 (0.0%) | 20 (5.8%) |
| $50,000 to $54,999 | 0 (0.0%) | 0 (0.0%) |
| $55,000 to $64,999 | 0 (0.0%) | 0 (0.0%) |
| $65,000 to $74,999 | 12 (4.8%) | 0 (0.0%) |
| $75,000 to $99,999 | 22 (8.8%) | 55 (16.0%) |
| $100,000+ | 126 (50.4%) | 238 (69.4%) |
| Total | 250 (100.0%) | 343 (100.0%) |
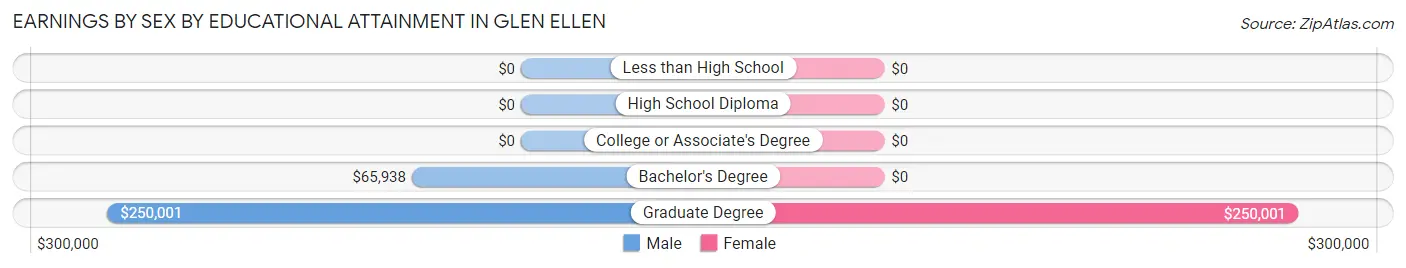
Earnings by Sex by Educational Attainment in Glen Ellen
| Educational Attainment | Male Income | Female Income |
| Less than High School | - | - |
| High School Diploma | - | - |
| College or Associate's Degree | - | - |
| Bachelor's Degree | $65,938 | $0 |
| Graduate Degree | $250,001 | $250,001 |
| Total | - | - |
Family Income in Glen Ellen
Family Income Brackets in Glen Ellen
According to the Glen Ellen family income data, there are 64 families falling into the $200,000+ income range, which is the most common income bracket and makes up 50.4% of all families.
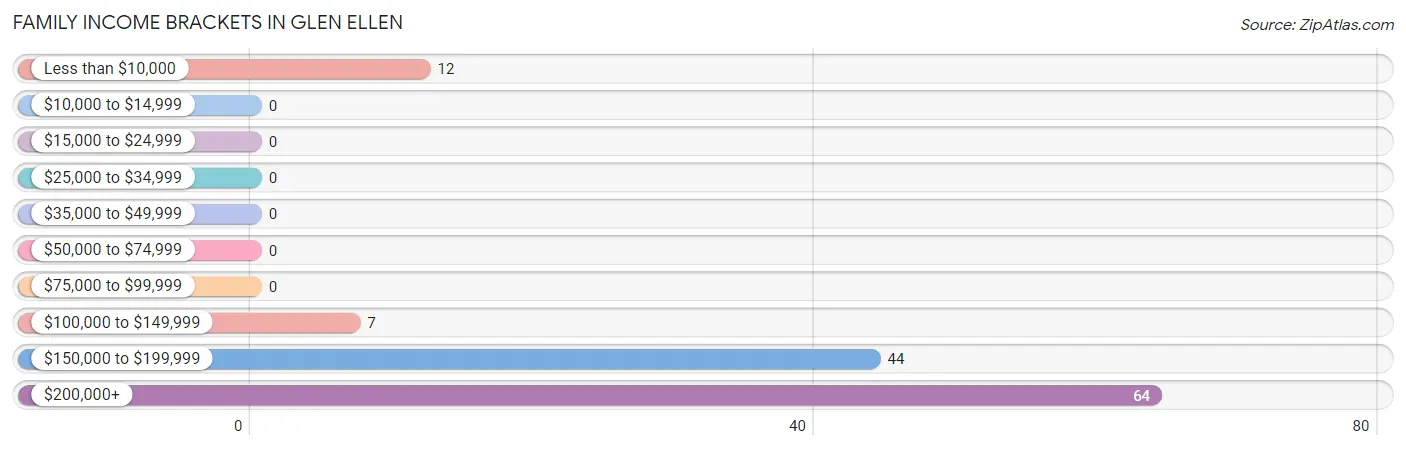
| Income Bracket | # Families | % Families |
| Less than $10,000 | 12 | 9.4% |
| $10,000 to $14,999 | 0 | 0.0% |
| $15,000 to $24,999 | 0 | 0.0% |
| $25,000 to $34,999 | 0 | 0.0% |
| $35,000 to $49,999 | 0 | 0.0% |
| $50,000 to $74,999 | 0 | 0.0% |
| $75,000 to $99,999 | 0 | 0.0% |
| $100,000 to $149,999 | 7 | 5.5% |
| $150,000 to $199,999 | 44 | 34.6% |
| $200,000+ | 64 | 50.4% |
Family Income by Famaliy Size in Glen Ellen
2-person families (93 | 73.2%) account for the highest median family income in Glen Ellen with $189,648 per family, while 2-person families (93 | 73.2%) have the highest median income of $94,824 per family member.
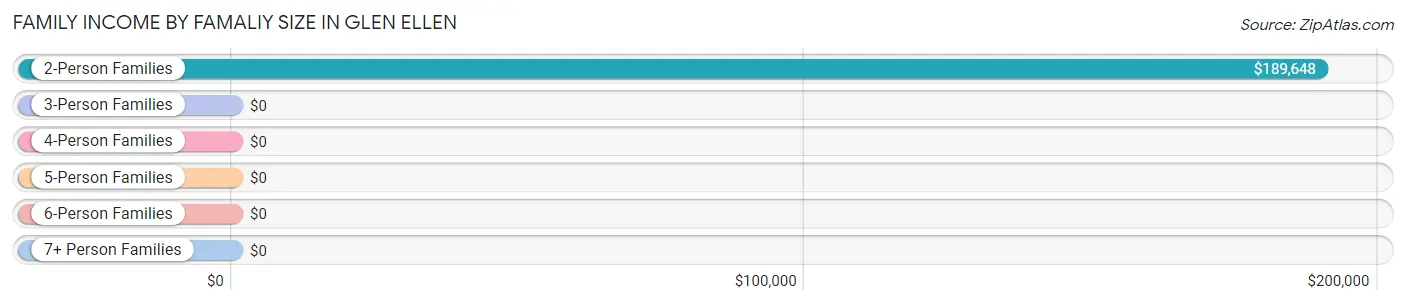
| Income Bracket | # Families | Median Income |
| 2-Person Families | 93 (73.2%) | $189,648 |
| 3-Person Families | 0 (0.0%) | $0 |
| 4-Person Families | 12 (9.5%) | $0 |
| 5-Person Families | 22 (17.3%) | $0 |
| 6-Person Families | 0 (0.0%) | $0 |
| 7+ Person Families | 0 (0.0%) | $0 |
| Total | 127 (100.0%) | $202,557 |
Family Income by Number of Earners in Glen Ellen
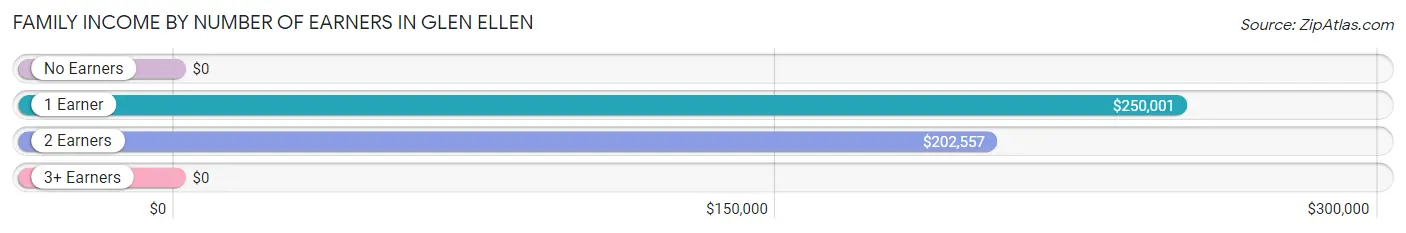
| Number of Earners | # Families | Median Income |
| No Earners | 12 (9.5%) | $0 |
| 1 Earner | 26 (20.5%) | $250,001 |
| 2 Earners | 89 (70.1%) | $202,557 |
| 3+ Earners | 0 (0.0%) | $0 |
| Total | 127 (100.0%) | $202,557 |
Household Income in Glen Ellen
Household Income Brackets in Glen Ellen
With 296 households falling in the category, the $200,000+ income range is the most frequent in Glen Ellen, accounting for 56.3% of all households.
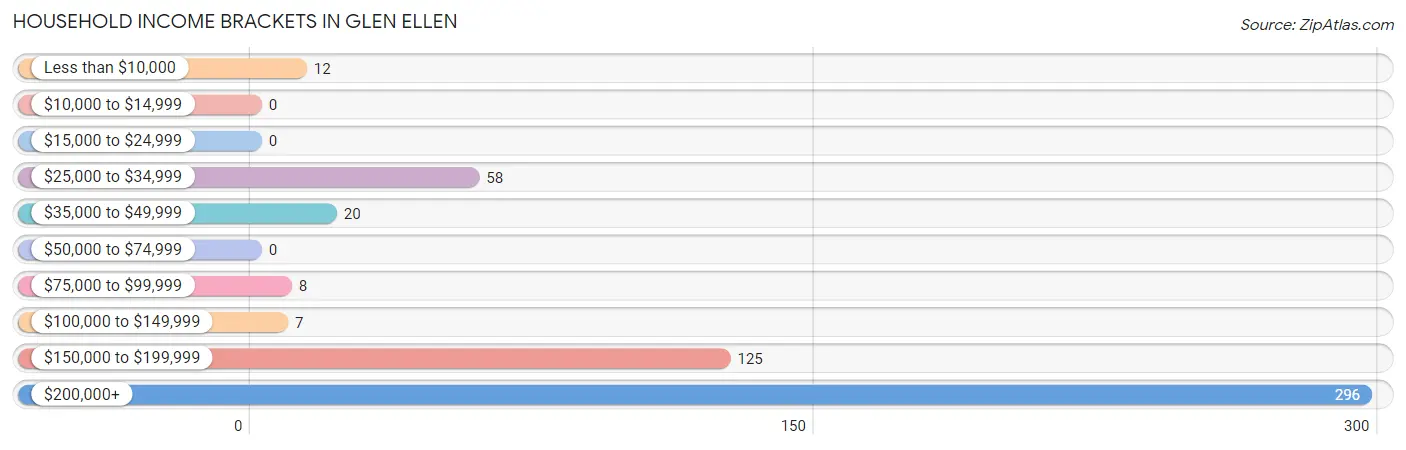
| Income Bracket | # Households | % Households |
| Less than $10,000 | 12 | 2.3% |
| $10,000 to $14,999 | 0 | 0.0% |
| $15,000 to $24,999 | 0 | 0.0% |
| $25,000 to $34,999 | 58 | 11.0% |
| $35,000 to $49,999 | 20 | 3.8% |
| $50,000 to $74,999 | 0 | 0.0% |
| $75,000 to $99,999 | 8 | 1.5% |
| $100,000 to $149,999 | 7 | 1.3% |
| $150,000 to $199,999 | 125 | 23.8% |
| $200,000+ | 296 | 56.3% |
Household Income by Householder Age in Glen Ellen
The median household income in Glen Ellen is $250,001, with the highest median household income of $250,001 found in the 45 to 64 years age bracket for the primary householder. A total of 402 households (76.4%) fall into this category.
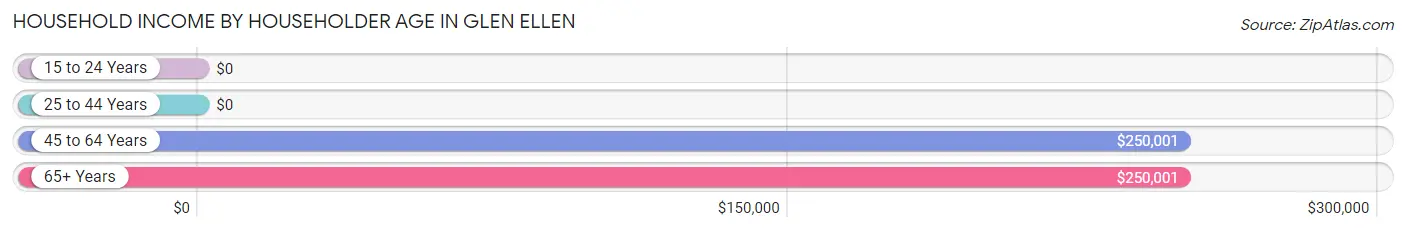
| Income Bracket | # Households | Median Income |
| 15 to 24 Years | 0 (0.0%) | $0 |
| 25 to 44 Years | 80 (15.2%) | $0 |
| 45 to 64 Years | 402 (76.4%) | $250,001 |
| 65+ Years | 44 (8.4%) | $250,001 |
| Total | 526 (100.0%) | $250,001 |
Poverty in Glen Ellen
Income Below Poverty by Sex and Age in Glen Ellen
With 46.1% poverty level for males and 2.9% for females among the residents of Glen Ellen, 55 to 64 year old males and 55 to 64 year old females are the most vulnerable to poverty, with 270 males (81.6%) and 12 females (4.3%) in their respective age groups living below the poverty level.
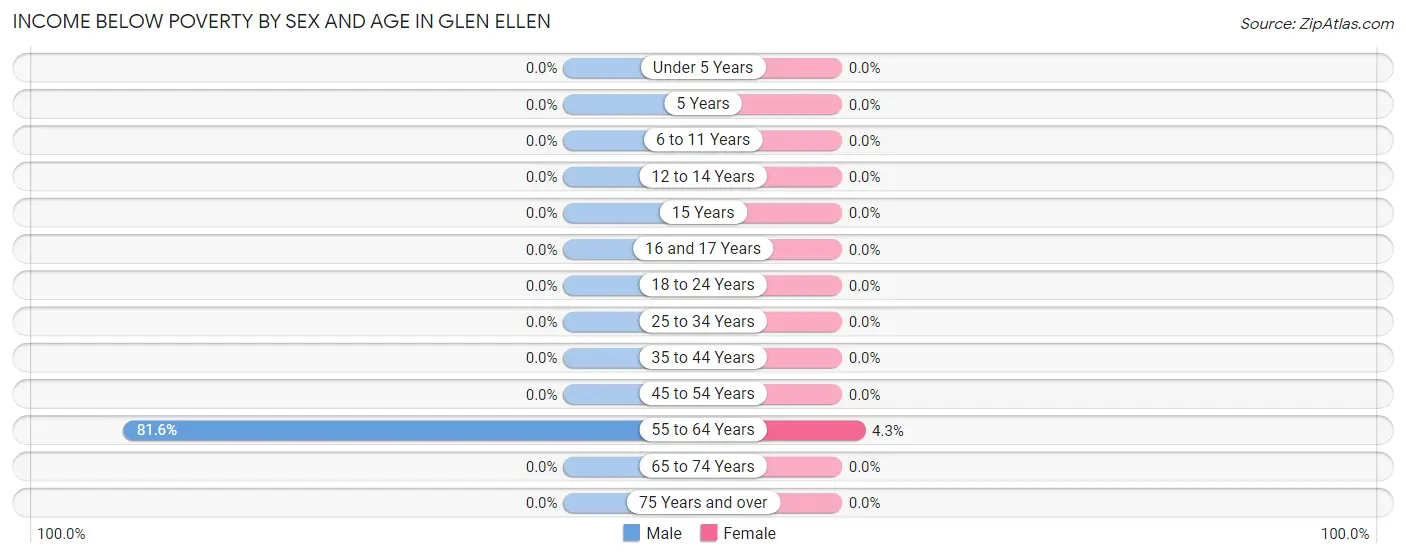
| Age Bracket | Male | Female |
| Under 5 Years | 0 (0.0%) | 0 (0.0%) |
| 5 Years | 0 (0.0%) | 0 (0.0%) |
| 6 to 11 Years | 0 (0.0%) | 0 (0.0%) |
| 12 to 14 Years | 0 (0.0%) | 0 (0.0%) |
| 15 Years | 0 (0.0%) | 0 (0.0%) |
| 16 and 17 Years | 0 (0.0%) | 0 (0.0%) |
| 18 to 24 Years | 0 (0.0%) | 0 (0.0%) |
| 25 to 34 Years | 0 (0.0%) | 0 (0.0%) |
| 35 to 44 Years | 0 (0.0%) | 0 (0.0%) |
| 45 to 54 Years | 0 (0.0%) | 0 (0.0%) |
| 55 to 64 Years | 270 (81.6%) | 12 (4.3%) |
| 65 to 74 Years | 0 (0.0%) | 0 (0.0%) |
| 75 Years and over | 0 (0.0%) | 0 (0.0%) |
| Total | 270 (46.1%) | 12 (2.9%) |
Income Above Poverty by Sex and Age in Glen Ellen
According to the poverty statistics in Glen Ellen, males aged under 5 years and females aged 12 to 14 years are the age groups that are most secure financially, with 100.0% of males and 100.0% of females in these age groups living above the poverty line.
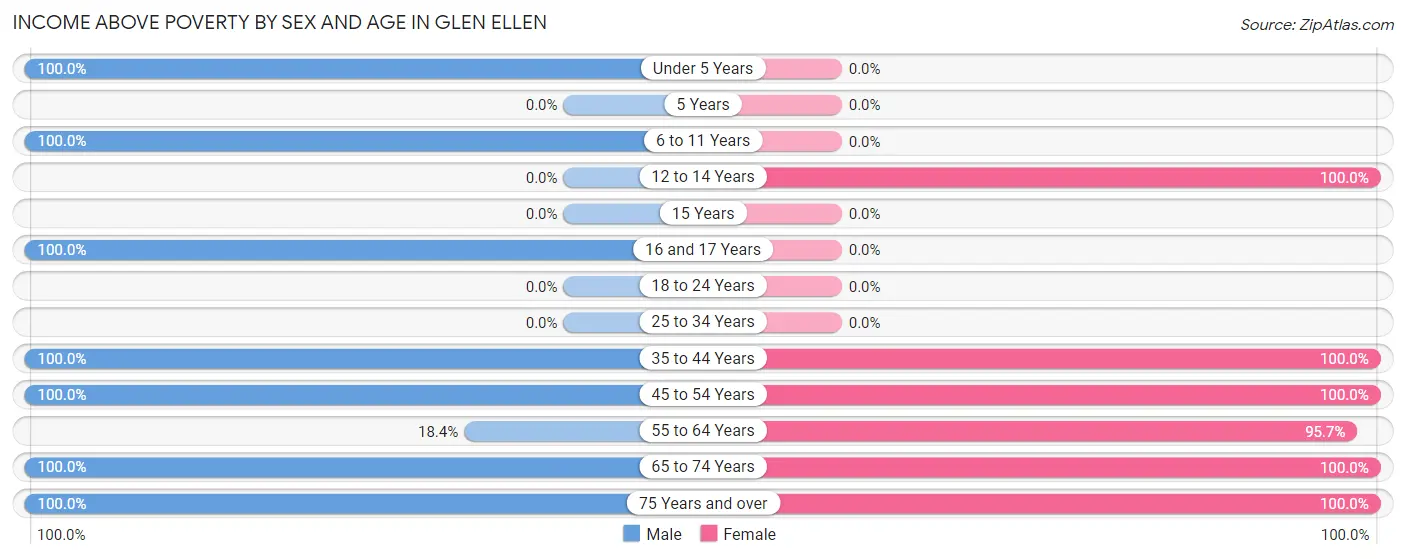
| Age Bracket | Male | Female |
| Under 5 Years | 20 (100.0%) | 0 (0.0%) |
| 5 Years | 0 (0.0%) | 0 (0.0%) |
| 6 to 11 Years | 22 (100.0%) | 0 (0.0%) |
| 12 to 14 Years | 0 (0.0%) | 12 (100.0%) |
| 15 Years | 0 (0.0%) | 0 (0.0%) |
| 16 and 17 Years | 11 (100.0%) | 0 (0.0%) |
| 18 to 24 Years | 0 (0.0%) | 0 (0.0%) |
| 25 to 34 Years | 0 (0.0%) | 0 (0.0%) |
| 35 to 44 Years | 80 (100.0%) | 22 (100.0%) |
| 45 to 54 Years | 72 (100.0%) | 33 (100.0%) |
| 55 to 64 Years | 61 (18.4%) | 265 (95.7%) |
| 65 to 74 Years | 37 (100.0%) | 60 (100.0%) |
| 75 Years and over | 13 (100.0%) | 8 (100.0%) |
| Total | 316 (53.9%) | 400 (97.1%) |
Income Below Poverty Among Married-Couple Families in Glen Ellen
The poverty statistics for married-couple families in Glen Ellen show that 9.5% or 12 of the total 127 families live below the poverty line. Families with no children have the highest poverty rate of 12.9%, comprising of 12 families. On the other hand, families with 1 or 2 children have the lowest poverty rate of 0.0%, which includes 0 families.
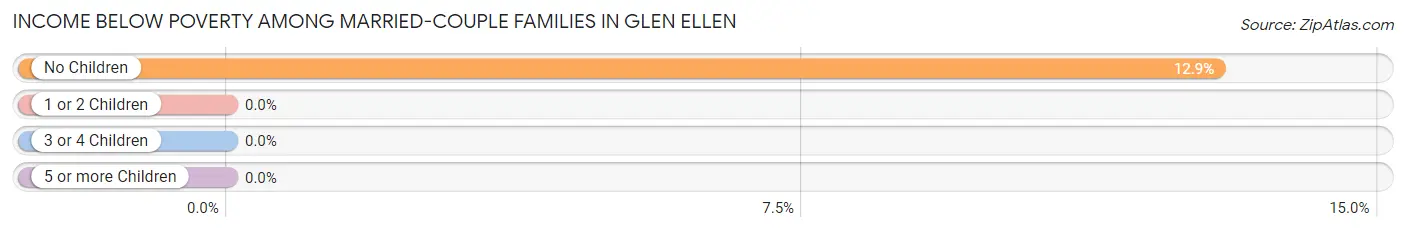
| Children | Above Poverty | Below Poverty |
| No Children | 81 (87.1%) | 12 (12.9%) |
| 1 or 2 Children | 34 (100.0%) | 0 (0.0%) |
| 3 or 4 Children | 0 (0.0%) | 0 (0.0%) |
| 5 or more Children | 0 (0.0%) | 0 (0.0%) |
| Total | 115 (90.5%) | 12 (9.5%) |
Income Below Poverty Among Single-Parent Households in Glen Ellen
| Children | Single Father | Single Mother |
| No Children | 0 (0.0%) | 0 (0.0%) |
| 1 or 2 Children | 0 (0.0%) | 0 (0.0%) |
| 3 or 4 Children | 0 (0.0%) | 0 (0.0%) |
| 5 or more Children | 0 (0.0%) | 0 (0.0%) |
| Total | 0 (0.0%) | 0 (0.0%) |
Income Below Poverty Among Married-Couple vs Single-Parent Households in Glen Ellen
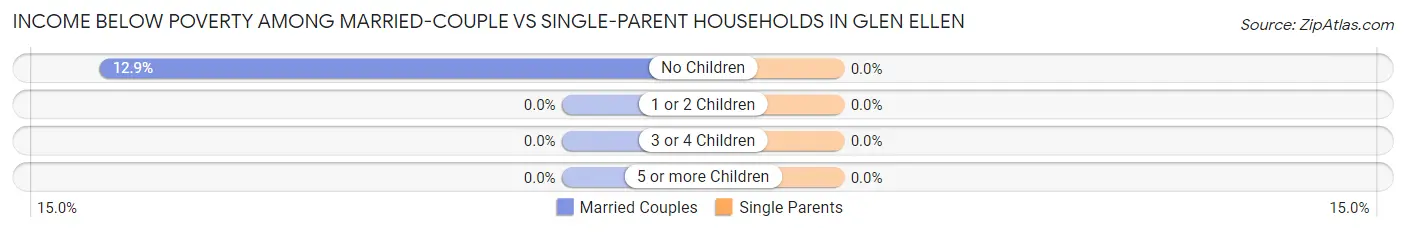
| Children | Married-Couple Families | Single-Parent Households |
| No Children | 12 (12.9%) | 0 (0.0%) |
| 1 or 2 Children | 0 (0.0%) | 0 (0.0%) |
| 3 or 4 Children | 0 (0.0%) | 0 (0.0%) |
| 5 or more Children | 0 (0.0%) | 0 (0.0%) |
| Total | 12 (9.5%) | 0 (0.0%) |
Race in Glen Ellen
The most populous races in Glen Ellen are White / Caucasian (887 | 88.9%), Hispanic or Latino (65 | 6.5%), and Some other Race (58 | 5.8%).
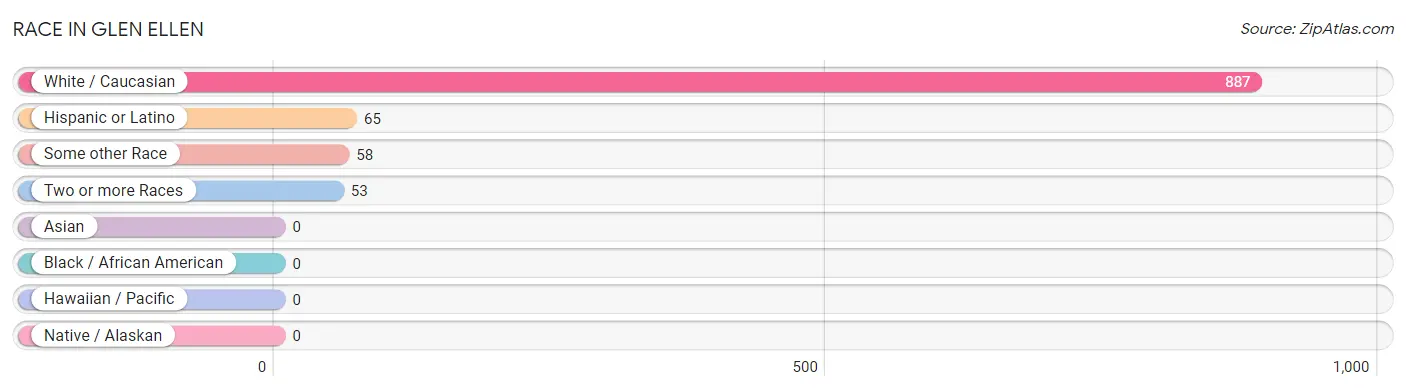
| Race | # Population | % Population |
| Asian | 0 | 0.0% |
| Black / African American | 0 | 0.0% |
| Hawaiian / Pacific | 0 | 0.0% |
| Hispanic or Latino | 65 | 6.5% |
| Native / Alaskan | 0 | 0.0% |
| White / Caucasian | 887 | 88.9% |
| Two or more Races | 53 | 5.3% |
| Some other Race | 58 | 5.8% |
| Total | 998 | 100.0% |
Ancestry in Glen Ellen
The most populous ancestries reported in Glen Ellen are Eastern European (302 | 30.3%), English (297 | 29.8%), Irish (288 | 28.9%), French (89 | 8.9%), and Mexican (65 | 6.5%), together accounting for 104.3% of all Glen Ellen residents.
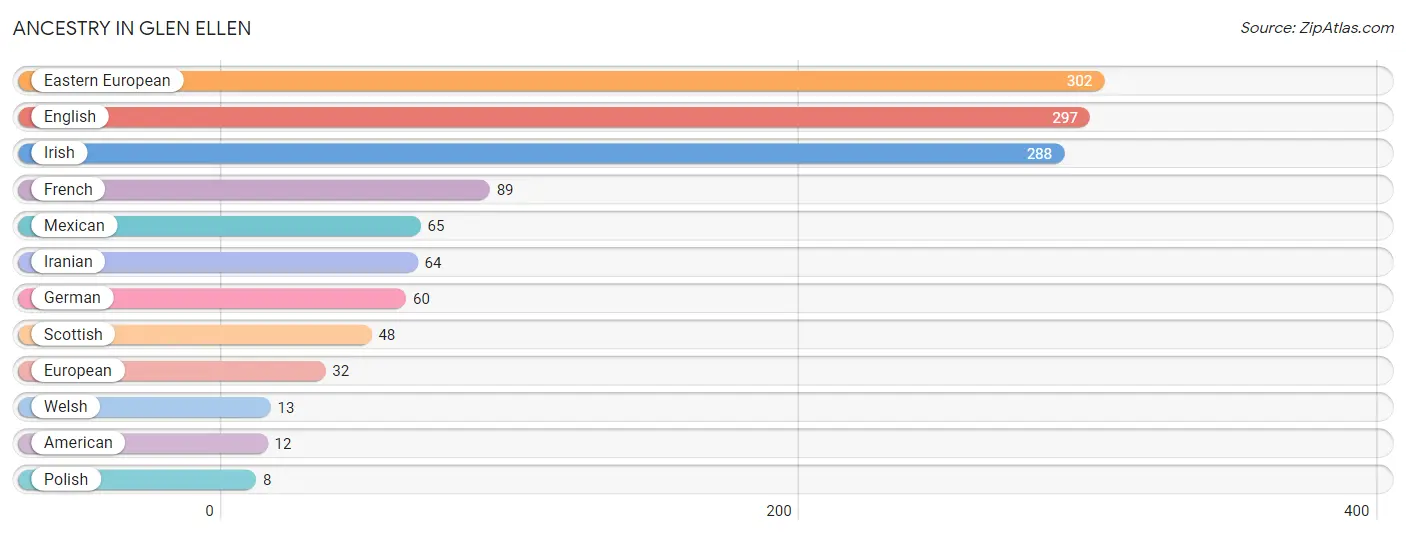
| Ancestry | # Population | % Population |
| American | 12 | 1.2% |
| Eastern European | 302 | 30.3% |
| English | 297 | 29.8% |
| European | 32 | 3.2% |
| French | 89 | 8.9% |
| German | 60 | 6.0% |
| Iranian | 64 | 6.4% |
| Irish | 288 | 28.9% |
| Mexican | 65 | 6.5% |
| Polish | 8 | 0.8% |
| Scottish | 48 | 4.8% |
| Welsh | 13 | 1.3% | View All 12 Rows |
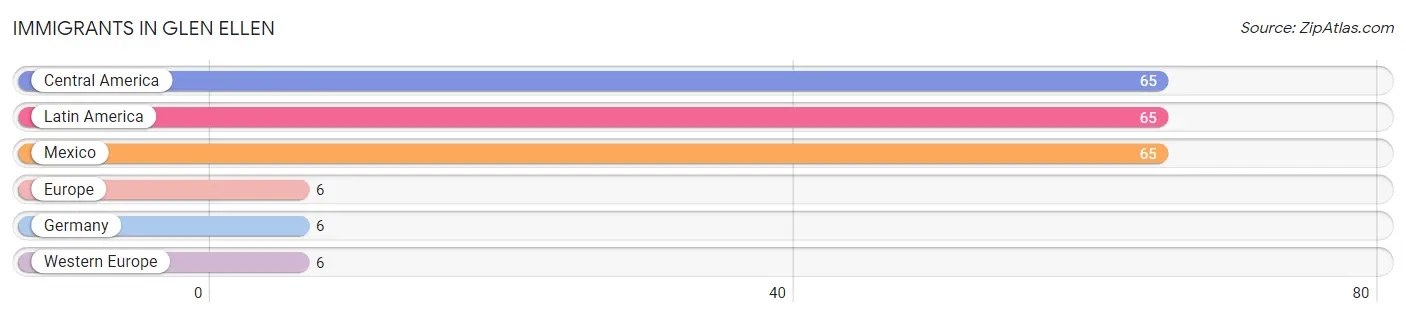
Immigrants in Glen Ellen
The most numerous immigrant groups reported in Glen Ellen came from Central America (65 | 6.5%), Latin America (65 | 6.5%), Mexico (65 | 6.5%), Europe (6 | 0.6%), and Germany (6 | 0.6%), together accounting for 20.7% of all Glen Ellen residents.
| Immigration Origin | # Population | % Population |
| Central America | 65 | 6.5% |
| Europe | 6 | 0.6% |
| Germany | 6 | 0.6% |
| Latin America | 65 | 6.5% |
| Mexico | 65 | 6.5% |
| Western Europe | 6 | 0.6% | View All 6 Rows |
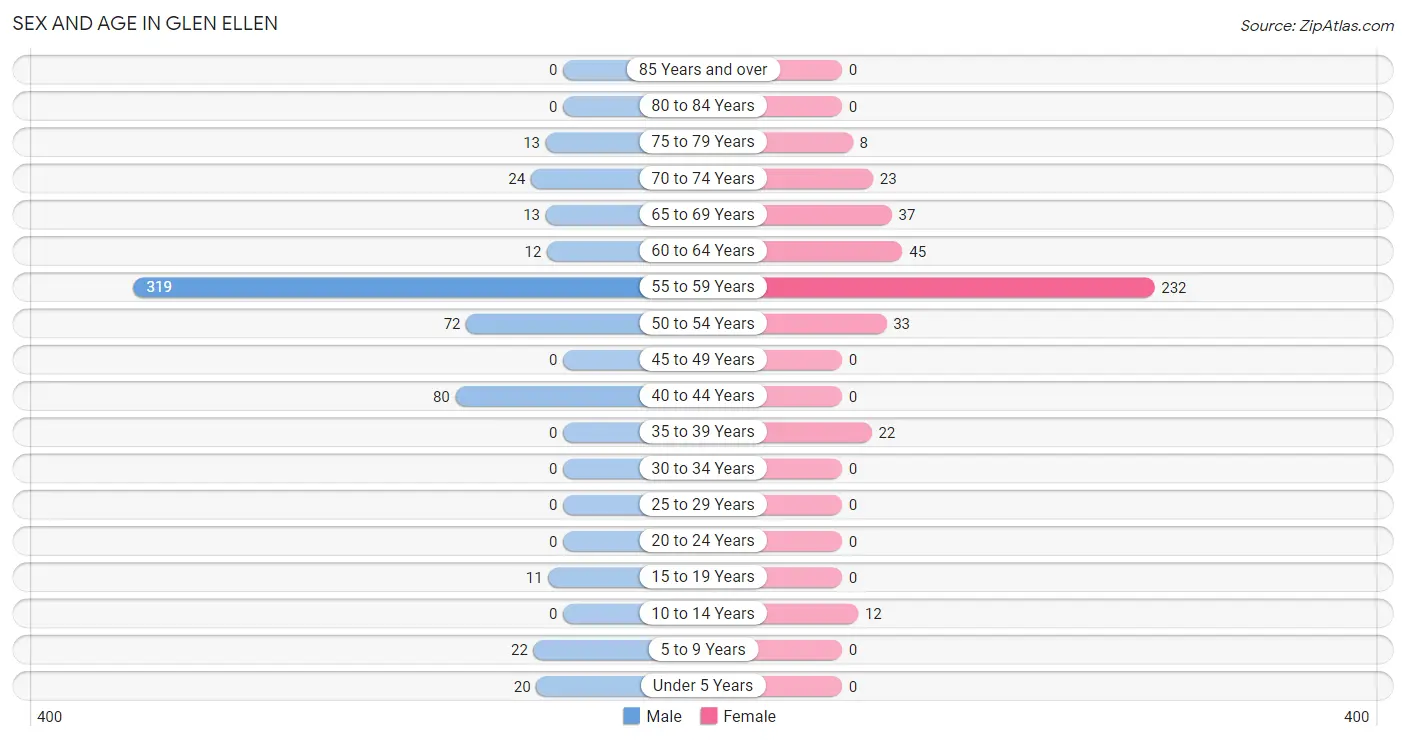
Sex and Age in Glen Ellen
Sex and Age in Glen Ellen
The most populous age groups in Glen Ellen are 55 to 59 Years (319 | 54.4%) for men and 55 to 59 Years (232 | 56.3%) for women.
| Age Bracket | Male | Female |
| Under 5 Years | 20 (3.4%) | 0 (0.0%) |
| 5 to 9 Years | 22 (3.7%) | 0 (0.0%) |
| 10 to 14 Years | 0 (0.0%) | 12 (2.9%) |
| 15 to 19 Years | 11 (1.9%) | 0 (0.0%) |
| 20 to 24 Years | 0 (0.0%) | 0 (0.0%) |
| 25 to 29 Years | 0 (0.0%) | 0 (0.0%) |
| 30 to 34 Years | 0 (0.0%) | 0 (0.0%) |
| 35 to 39 Years | 0 (0.0%) | 22 (5.3%) |
| 40 to 44 Years | 80 (13.7%) | 0 (0.0%) |
| 45 to 49 Years | 0 (0.0%) | 0 (0.0%) |
| 50 to 54 Years | 72 (12.3%) | 33 (8.0%) |
| 55 to 59 Years | 319 (54.4%) | 232 (56.3%) |
| 60 to 64 Years | 12 (2.1%) | 45 (10.9%) |
| 65 to 69 Years | 13 (2.2%) | 37 (9.0%) |
| 70 to 74 Years | 24 (4.1%) | 23 (5.6%) |
| 75 to 79 Years | 13 (2.2%) | 8 (1.9%) |
| 80 to 84 Years | 0 (0.0%) | 0 (0.0%) |
| 85 Years and over | 0 (0.0%) | 0 (0.0%) |
| Total | 586 (100.0%) | 412 (100.0%) |
Families and Households in Glen Ellen
Median Family Size in Glen Ellen
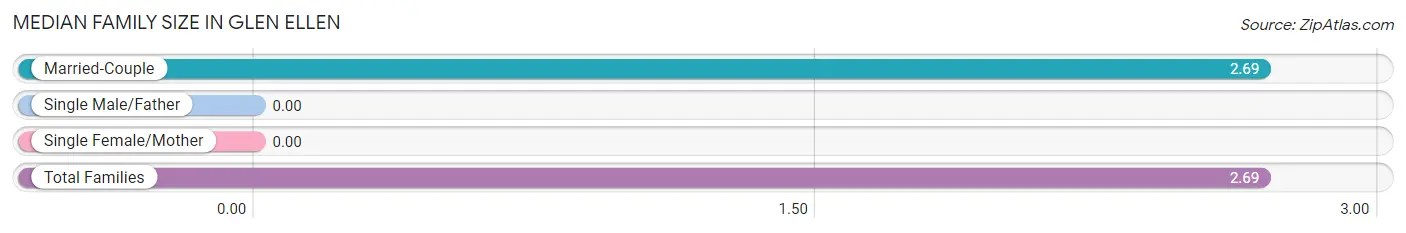
| Family Type | # Families | Family Size |
| Married-Couple | 127 (100.0%) | 2.69 |
| Single Male/Father | 0 (0.0%) | - |
| Single Female/Mother | 0 (0.0%) | - |
| Total Families | 127 (100.0%) | 2.69 |
Median Household Size in Glen Ellen
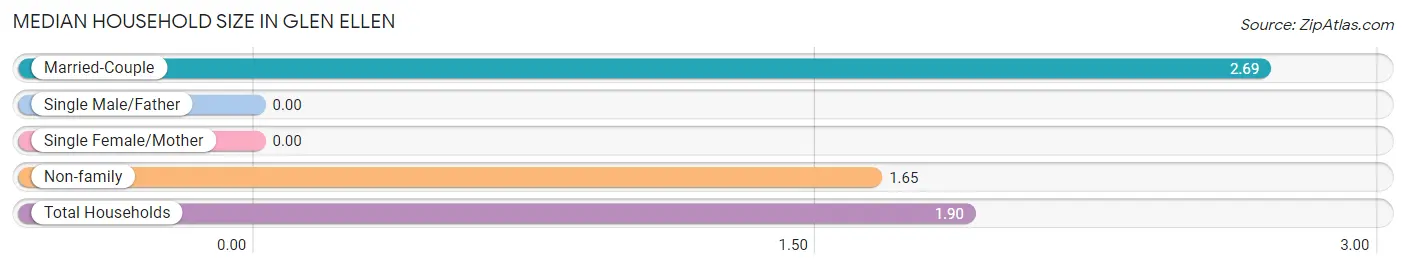
| Household Type | # Households | Household Size |
| Married-Couple | 127 (24.1%) | 2.69 |
| Single Male/Father | 0 (0.0%) | - |
| Single Female/Mother | 0 (0.0%) | - |
| Non-family | 399 (75.9%) | 1.65 |
| Total Households | 526 (100.0%) | 1.90 |
Household Size by Marriage Status in Glen Ellen
Out of a total of 526 households in Glen Ellen, 127 (24.1%) are family households, while 399 (75.9%) are nonfamily households. The most numerous type of family households are 2-person households, comprising 93, and the most common type of nonfamily households are 2-person households, comprising 232.
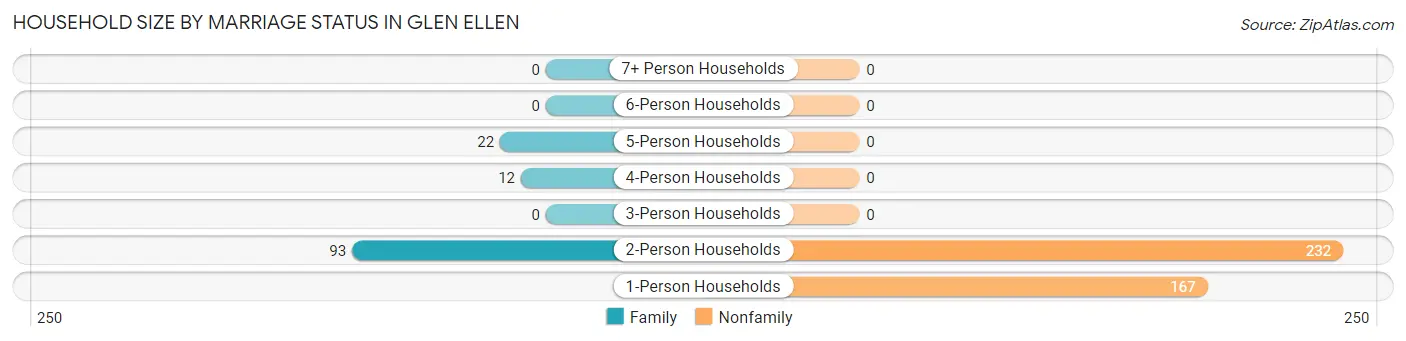
| Household Size | Family Households | Nonfamily Households |
| 1-Person Households | - | 167 (31.8%) |
| 2-Person Households | 93 (17.7%) | 232 (44.1%) |
| 3-Person Households | 0 (0.0%) | 0 (0.0%) |
| 4-Person Households | 12 (2.3%) | 0 (0.0%) |
| 5-Person Households | 22 (4.2%) | 0 (0.0%) |
| 6-Person Households | 0 (0.0%) | 0 (0.0%) |
| 7+ Person Households | 0 (0.0%) | 0 (0.0%) |
| Total | 127 (24.1%) | 399 (75.9%) |
Female Fertility in Glen Ellen
Fertility by Age in Glen Ellen
| Age Bracket | Women with Births | Births / 1,000 Women |
| 15 to 19 years | 0 (0.0%) | 0.0 |
| 20 to 34 years | 0 (0.0%) | 0.0 |
| 35 to 50 years | 0 (0.0%) | 0.0 |
| Total | 0 (0.0%) | 0.0 |
Fertility by Age by Marriage Status in Glen Ellen
| Age Bracket | Married | Unmarried |
| 15 to 19 years | 0 (0.0%) | 0 (0.0%) |
| 20 to 34 years | 0 (0.0%) | 0 (0.0%) |
| 35 to 50 years | 0 (0.0%) | 0 (0.0%) |
| Total | 0 (0.0%) | 0 (0.0%) |
Fertility by Education in Glen Ellen
| Educational Attainment | Women with Births | Births / 1,000 Women |
| Less than High School | 0 (0.0%) | 0.0 |
| High School Diploma | 0 (0.0%) | 0.0 |
| College or Associate's Degree | 0 (0.0%) | 0.0 |
| Bachelor's Degree | 0 (0.0%) | 0.0 |
| Graduate Degree | 0 (0.0%) | 0.0 |
| Total | 0 (0.0%) | 0.0 |
Fertility by Education by Marriage Status in Glen Ellen
| Educational Attainment | Married | Unmarried |
| Less than High School | 0 (0.0%) | 0 (0.0%) |
| High School Diploma | 0 (0.0%) | 0 (0.0%) |
| College or Associate's Degree | 0 (0.0%) | 0 (0.0%) |
| Bachelor's Degree | 0 (0.0%) | 0 (0.0%) |
| Graduate Degree | 0 (0.0%) | 0 (0.0%) |
| Total | 0 (0.0%) | 0 (0.0%) |
Employment Characteristics in Glen Ellen
Employment by Class of Employer in Glen Ellen
Among the 503 employed individuals in Glen Ellen, private company employees (339 | 67.4%), self-employed (incorporated) (54 | 10.7%), and self-employed (not incorporated) (33 | 6.6%) make up the most common classes of employment.
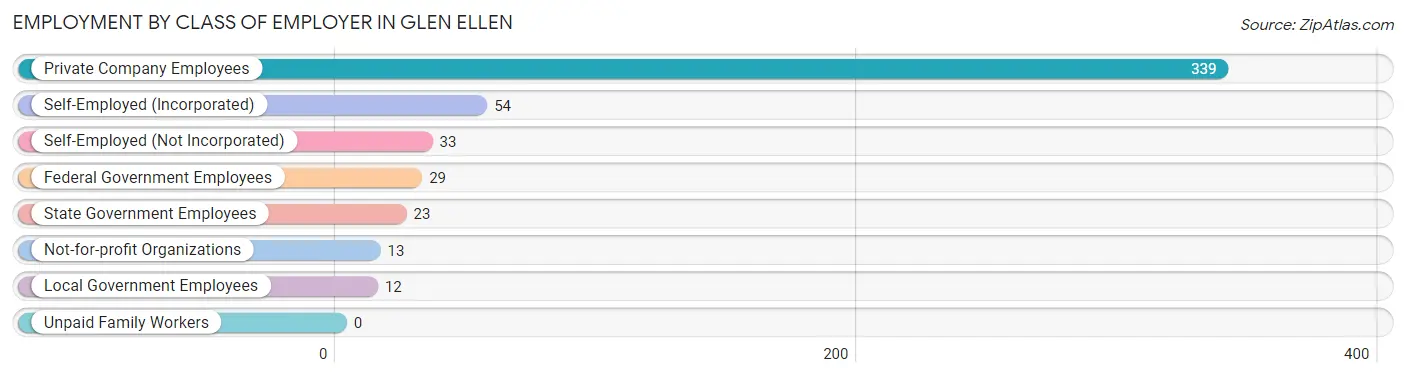
| Employer Class | # Employees | % Employees |
| Private Company Employees | 339 | 67.4% |
| Self-Employed (Incorporated) | 54 | 10.7% |
| Self-Employed (Not Incorporated) | 33 | 6.6% |
| Not-for-profit Organizations | 13 | 2.6% |
| Local Government Employees | 12 | 2.4% |
| State Government Employees | 23 | 4.6% |
| Federal Government Employees | 29 | 5.8% |
| Unpaid Family Workers | 0 | 0.0% |
| Total | 503 | 100.0% |
Employment Status by Age in Glen Ellen
According to the labor force statistics for Glen Ellen, out of the total population over 16 years of age (944), 55.8% or 527 individuals are in the labor force, with 4.6% or 24 of them unemployed. The age group with the highest labor force participation rate is 35 to 44 years, with 100.0% or 102 individuals in the labor force. Within the labor force, the 60 to 64 years age range has the highest percentage of unemployed individuals, with 54.5% or 24 of them being unemployed.
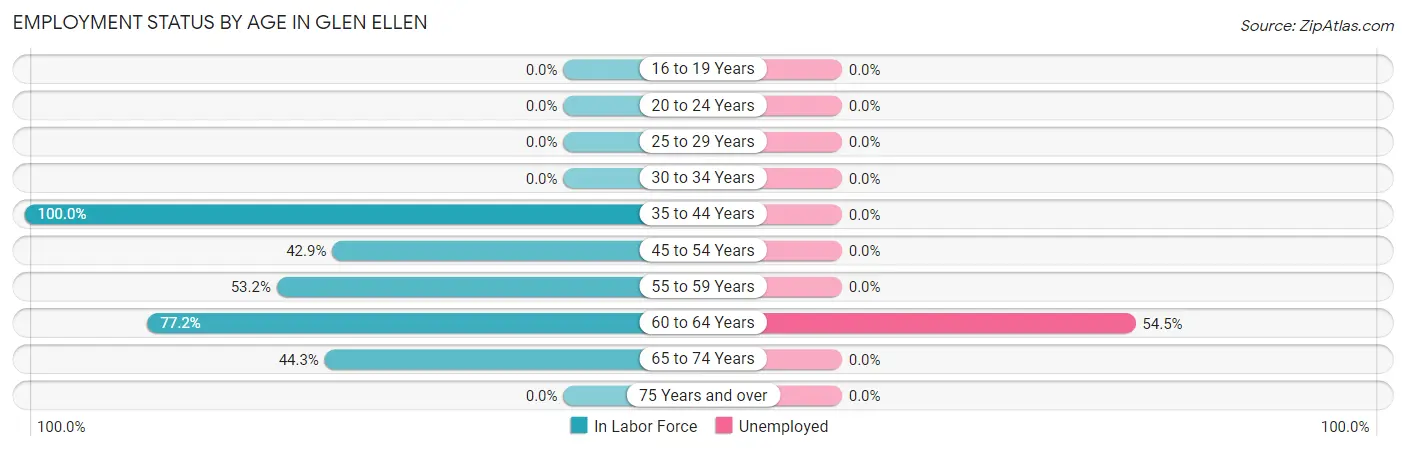
| Age Bracket | In Labor Force | Unemployed |
| 16 to 19 Years | 0 (0.0%) | 0 (0.0%) |
| 20 to 24 Years | 0 (0.0%) | 0 (0.0%) |
| 25 to 29 Years | 0 (0.0%) | 0 (0.0%) |
| 30 to 34 Years | 0 (0.0%) | 0 (0.0%) |
| 35 to 44 Years | 102 (100.0%) | 0 (0.0%) |
| 45 to 54 Years | 45 (42.9%) | 0 (0.0%) |
| 55 to 59 Years | 293 (53.2%) | 0 (0.0%) |
| 60 to 64 Years | 44 (77.2%) | 24 (54.5%) |
| 65 to 74 Years | 43 (44.3%) | 0 (0.0%) |
| 75 Years and over | 0 (0.0%) | 0 (0.0%) |
| Total | 527 (55.8%) | 24 (4.6%) |
Employment Status by Educational Attainment in Glen Ellen
According to labor force statistics for Glen Ellen, 59.4% of individuals (484) out of the total population between 25 and 64 years of age (815) are in the labor force, with 5.0% or 24 of them being unemployed. The group with the highest labor force participation rate are those with the educational attainment of college / associate degree, with 100.0% or 32 individuals in the labor force. Within the labor force, individuals with college / associate degree education have the highest percentage of unemployment, with 37.5% or 12 of them being unemployed.
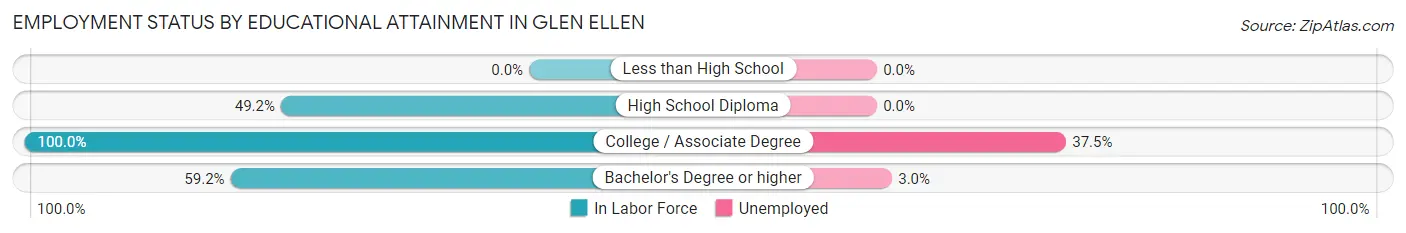
| Educational Attainment | In Labor Force | Unemployed |
| Less than High School | 0 (0.0%) | 0 (0.0%) |
| High School Diploma | 58 (49.2%) | 0 (0.0%) |
| College / Associate Degree | 32 (100.0%) | 12 (37.5%) |
| Bachelor's Degree or higher | 394 (59.2%) | 20 (3.0%) |
| Total | 484 (59.4%) | 41 (5.0%) |
Employment Occupations by Sex in Glen Ellen
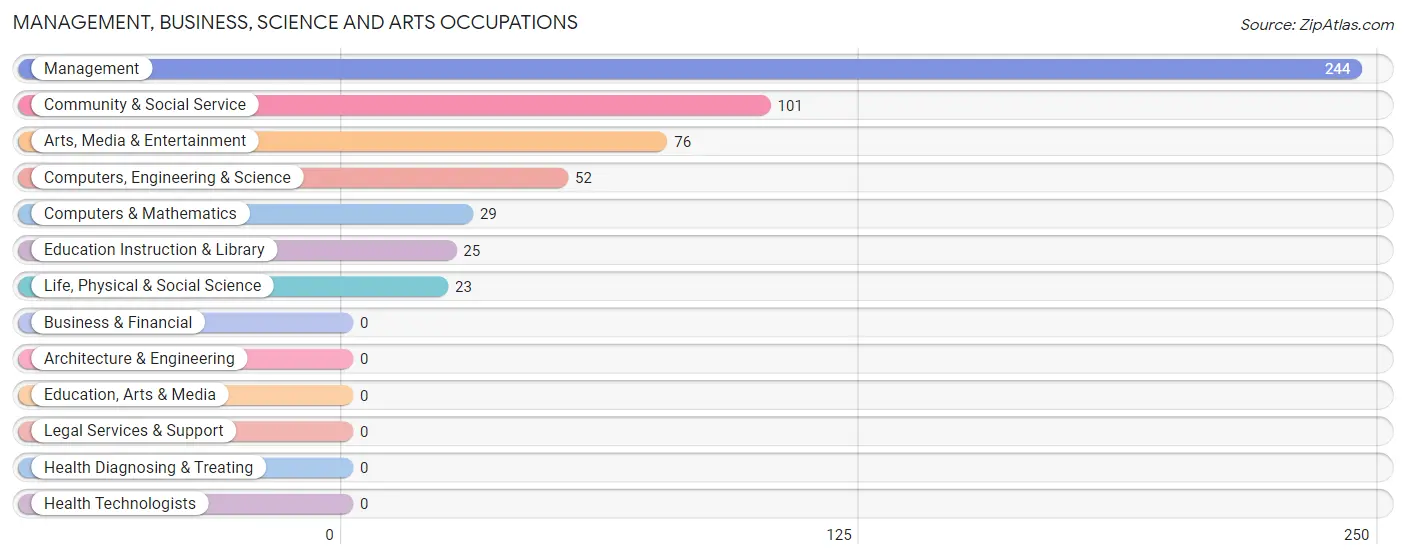
Management, Business, Science and Arts Occupations
The most common Management, Business, Science and Arts occupations in Glen Ellen are Management (244 | 48.5%), Community & Social Service (101 | 20.1%), Arts, Media & Entertainment (76 | 15.1%), Computers, Engineering & Science (52 | 10.3%), and Computers & Mathematics (29 | 5.8%).
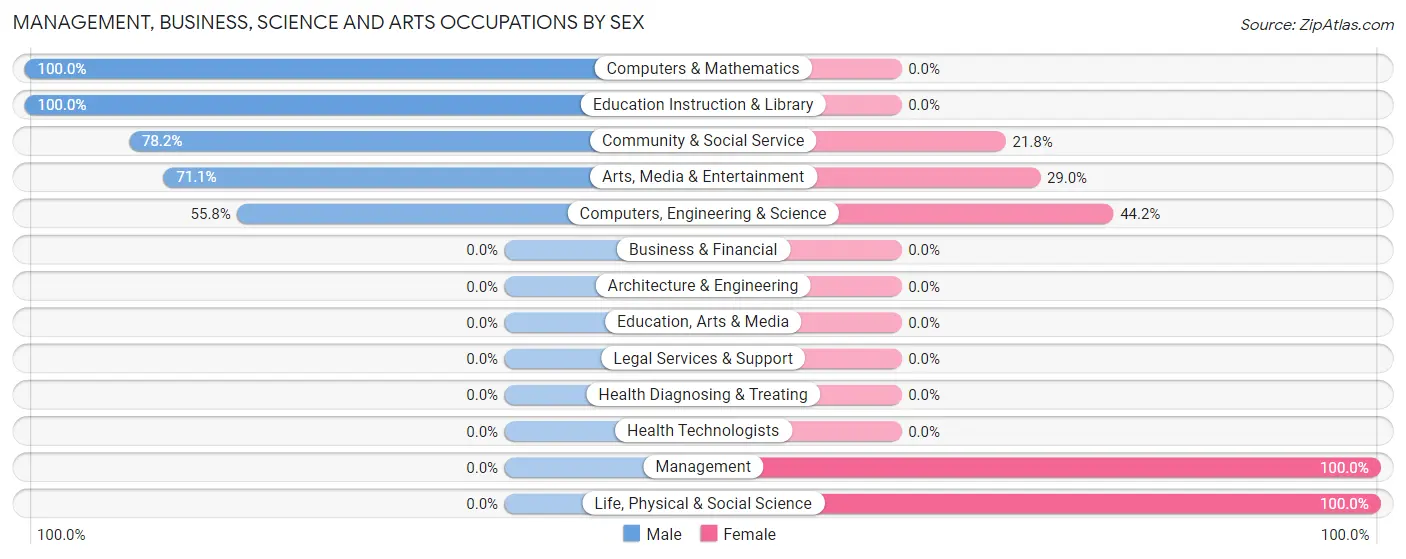
Management, Business, Science and Arts Occupations by Sex
Within the Management, Business, Science and Arts occupations in Glen Ellen, the most male-oriented occupations are Computers & Mathematics (100.0%), Education Instruction & Library (100.0%), and Community & Social Service (78.2%), while the most female-oriented occupations are Management (100.0%), Life, Physical & Social Science (100.0%), and Computers, Engineering & Science (44.2%).
| Occupation | Male | Female |
| Management | 0 (0.0%) | 244 (100.0%) |
| Business & Financial | 0 (0.0%) | 0 (0.0%) |
| Computers, Engineering & Science | 29 (55.8%) | 23 (44.2%) |
| Computers & Mathematics | 29 (100.0%) | 0 (0.0%) |
| Architecture & Engineering | 0 (0.0%) | 0 (0.0%) |
| Life, Physical & Social Science | 0 (0.0%) | 23 (100.0%) |
| Community & Social Service | 79 (78.2%) | 22 (21.8%) |
| Education, Arts & Media | 0 (0.0%) | 0 (0.0%) |
| Legal Services & Support | 0 (0.0%) | 0 (0.0%) |
| Education Instruction & Library | 25 (100.0%) | 0 (0.0%) |
| Arts, Media & Entertainment | 54 (71.1%) | 22 (28.9%) |
| Health Diagnosing & Treating | 0 (0.0%) | 0 (0.0%) |
| Health Technologists | 0 (0.0%) | 0 (0.0%) |
| Total (Category) | 108 (27.2%) | 289 (72.8%) |
| Total (Overall) | 166 (33.0%) | 337 (67.0%) |
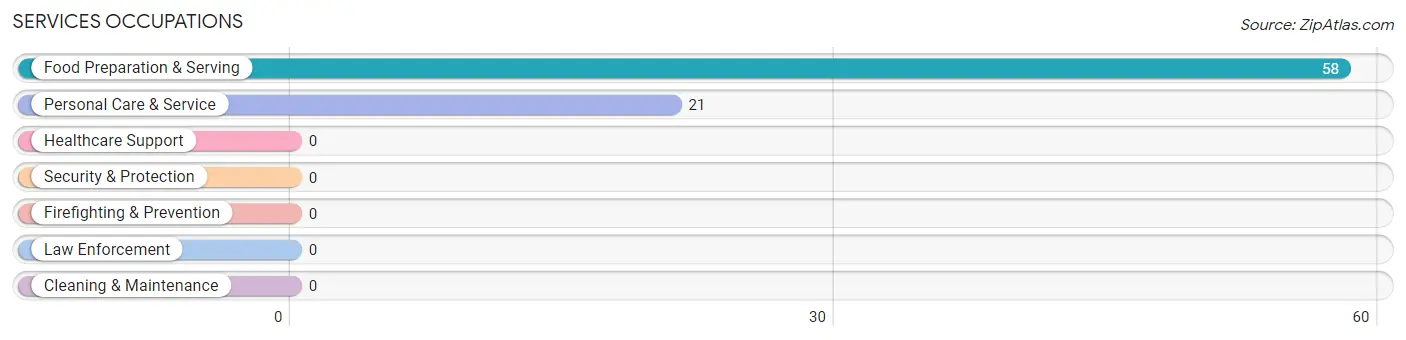
Services Occupations
The most common Services occupations in Glen Ellen are Food Preparation & Serving (58 | 11.5%), and Personal Care & Service (21 | 4.2%).
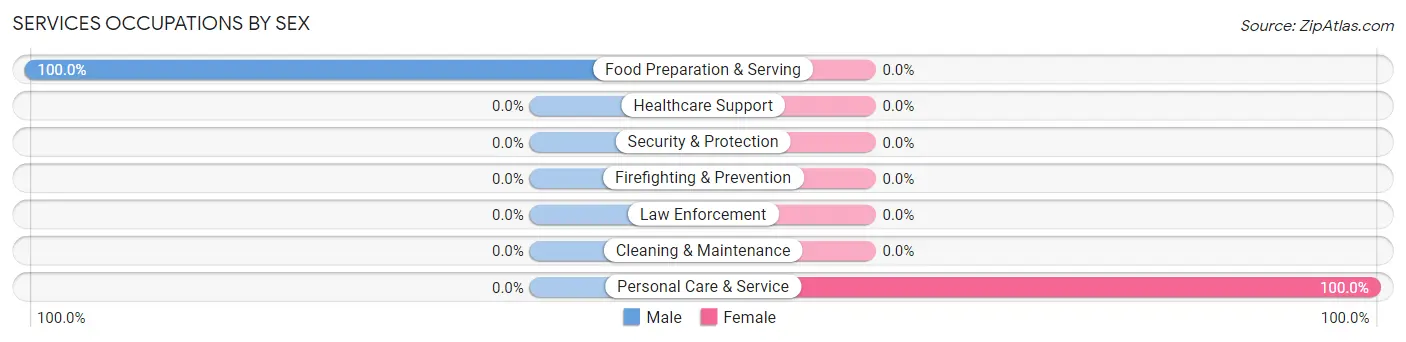
Services Occupations by Sex
| Occupation | Male | Female |
| Healthcare Support | 0 (0.0%) | 0 (0.0%) |
| Security & Protection | 0 (0.0%) | 0 (0.0%) |
| Firefighting & Prevention | 0 (0.0%) | 0 (0.0%) |
| Law Enforcement | 0 (0.0%) | 0 (0.0%) |
| Food Preparation & Serving | 58 (100.0%) | 0 (0.0%) |
| Cleaning & Maintenance | 0 (0.0%) | 0 (0.0%) |
| Personal Care & Service | 0 (0.0%) | 21 (100.0%) |
| Total (Category) | 58 (73.4%) | 21 (26.6%) |
| Total (Overall) | 166 (33.0%) | 337 (67.0%) |
Sales and Office Occupations
The most common Sales and Office occupations in Glen Ellen are , and Sales & Related (20 | 4.0%).
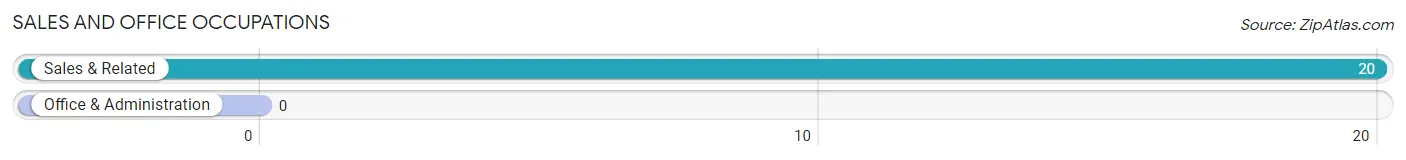
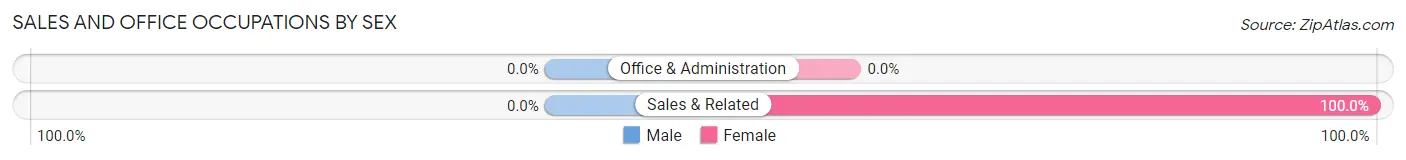
Sales and Office Occupations by Sex
| Occupation | Male | Female |
| Sales & Related | 0 (0.0%) | 20 (100.0%) |
| Office & Administration | 0 (0.0%) | 0 (0.0%) |
| Total (Category) | 0 (0.0%) | 20 (100.0%) |
| Total (Overall) | 166 (33.0%) | 337 (67.0%) |
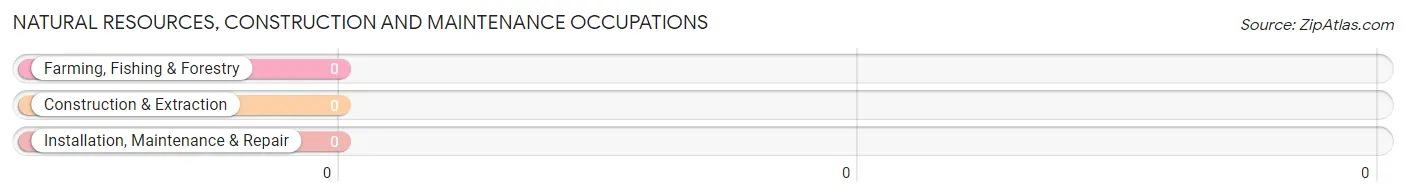
Natural Resources, Construction and Maintenance Occupations
Natural Resources, Construction and Maintenance Occupations by Sex
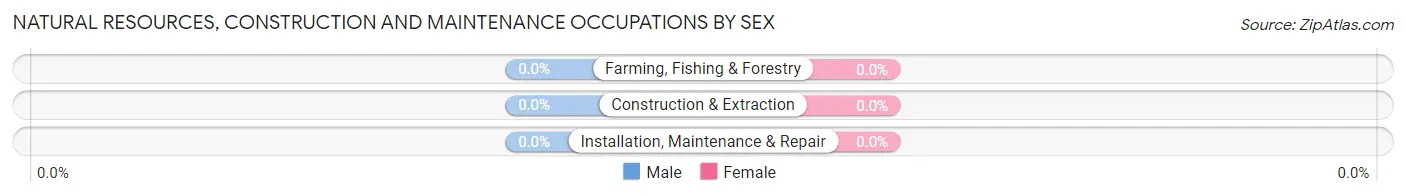
| Occupation | Male | Female |
| Farming, Fishing & Forestry | 0 (0.0%) | 0 (0.0%) |
| Construction & Extraction | 0 (0.0%) | 0 (0.0%) |
| Installation, Maintenance & Repair | 0 (0.0%) | 0 (0.0%) |
| Total (Category) | 0 (0.0%) | 0 (0.0%) |
| Total (Overall) | 166 (33.0%) | 337 (67.0%) |
Production, Transportation and Moving Occupations
The most common Production, Transportation and Moving occupations in Glen Ellen are , and Production (7 | 1.4%).
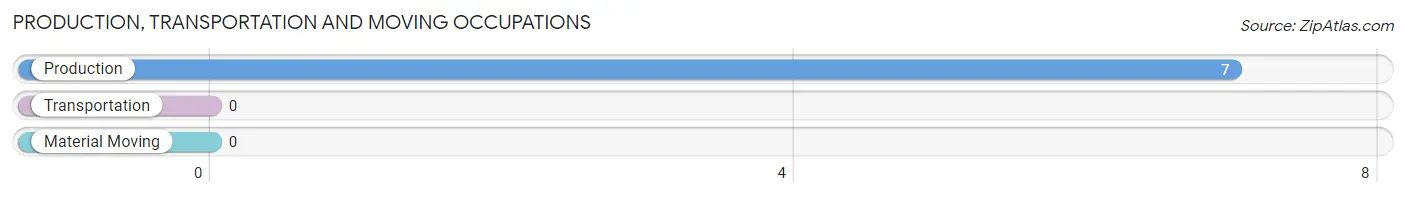
Production, Transportation and Moving Occupations by Sex
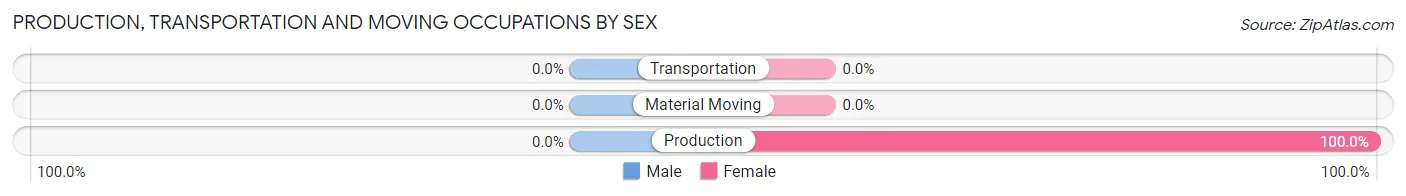
| Occupation | Male | Female |
| Production | 0 (0.0%) | 7 (100.0%) |
| Transportation | 0 (0.0%) | 0 (0.0%) |
| Material Moving | 0 (0.0%) | 0 (0.0%) |
| Total (Category) | 0 (0.0%) | 7 (100.0%) |
| Total (Overall) | 166 (33.0%) | 337 (67.0%) |
Employment Industries by Sex in Glen Ellen
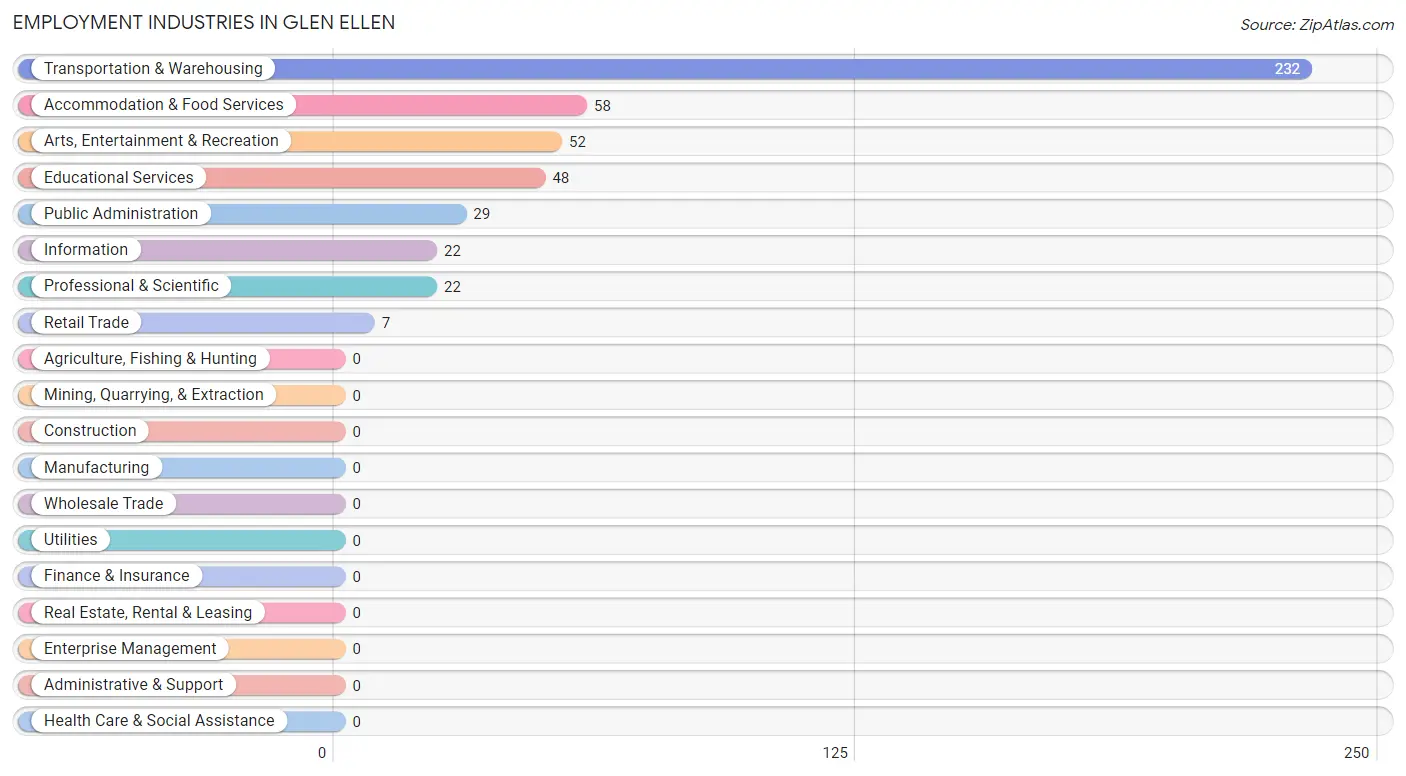
Employment Industries in Glen Ellen
The major employment industries in Glen Ellen include Transportation & Warehousing (232 | 46.1%), Accommodation & Food Services (58 | 11.5%), Arts, Entertainment & Recreation (52 | 10.3%), Educational Services (48 | 9.5%), and Public Administration (29 | 5.8%).
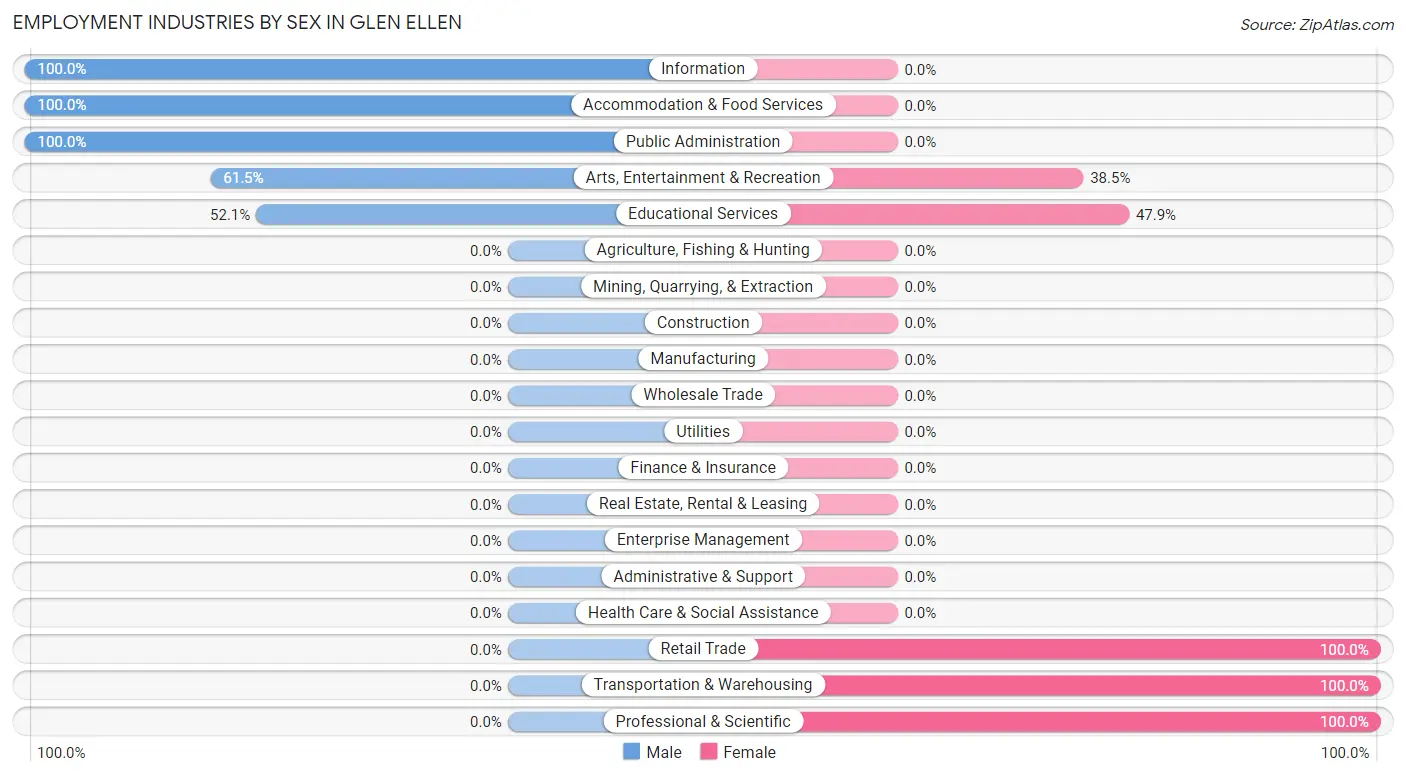
Employment Industries by Sex in Glen Ellen
The Glen Ellen industries that see more men than women are Information (100.0%), Accommodation & Food Services (100.0%), and Public Administration (100.0%), whereas the industries that tend to have a higher number of women are Retail Trade (100.0%), Transportation & Warehousing (100.0%), and Professional & Scientific (100.0%).
| Industry | Male | Female |
| Agriculture, Fishing & Hunting | 0 (0.0%) | 0 (0.0%) |
| Mining, Quarrying, & Extraction | 0 (0.0%) | 0 (0.0%) |
| Construction | 0 (0.0%) | 0 (0.0%) |
| Manufacturing | 0 (0.0%) | 0 (0.0%) |
| Wholesale Trade | 0 (0.0%) | 0 (0.0%) |
| Retail Trade | 0 (0.0%) | 7 (100.0%) |
| Transportation & Warehousing | 0 (0.0%) | 232 (100.0%) |
| Utilities | 0 (0.0%) | 0 (0.0%) |
| Information | 22 (100.0%) | 0 (0.0%) |
| Finance & Insurance | 0 (0.0%) | 0 (0.0%) |
| Real Estate, Rental & Leasing | 0 (0.0%) | 0 (0.0%) |
| Professional & Scientific | 0 (0.0%) | 22 (100.0%) |
| Enterprise Management | 0 (0.0%) | 0 (0.0%) |
| Administrative & Support | 0 (0.0%) | 0 (0.0%) |
| Educational Services | 25 (52.1%) | 23 (47.9%) |
| Health Care & Social Assistance | 0 (0.0%) | 0 (0.0%) |
| Arts, Entertainment & Recreation | 32 (61.5%) | 20 (38.5%) |
| Accommodation & Food Services | 58 (100.0%) | 0 (0.0%) |
| Public Administration | 29 (100.0%) | 0 (0.0%) |
| Total | 166 (33.0%) | 337 (67.0%) |
Education in Glen Ellen
School Enrollment in Glen Ellen
The most common levels of schooling among the 77 students in Glen Ellen are kindergarten (22 | 28.6%), nursery / preschool (20 | 26.0%), and middle school (12 | 15.6%).
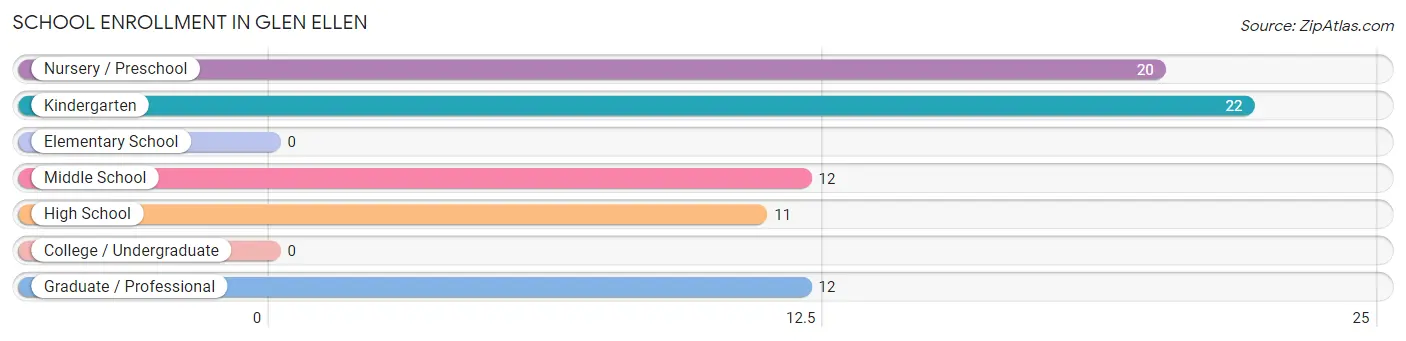
| School Level | # Students | % Students |
| Nursery / Preschool | 20 | 26.0% |
| Kindergarten | 22 | 28.6% |
| Elementary School | 0 | 0.0% |
| Middle School | 12 | 15.6% |
| High School | 11 | 14.3% |
| College / Undergraduate | 0 | 0.0% |
| Graduate / Professional | 12 | 15.6% |
| Total | 77 | 100.0% |
School Enrollment by Age by Funding Source in Glen Ellen
Out of a total of 77 students who are enrolled in schools in Glen Ellen, 11 (14.3%) attend a private institution, while the remaining 66 (85.7%) are enrolled in public schools. The age group of 15 to 17 year olds has the highest likelihood of being enrolled in private schools, with 11 (100.0% in the age bracket) enrolled. Conversely, the age group of 3 to 4 year olds has the lowest likelihood of being enrolled in a private school, with 20 (100.0% in the age bracket) attending a public institution.
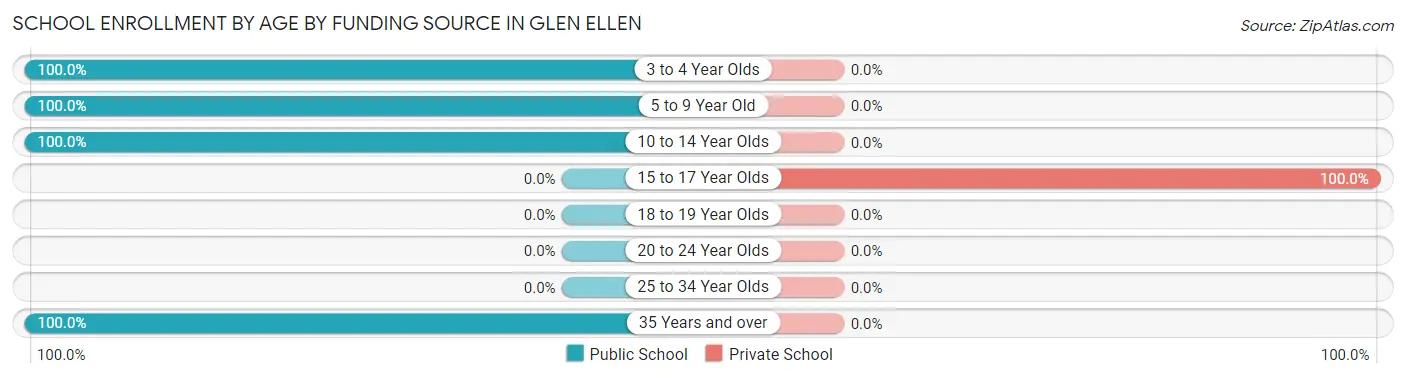
| Age Bracket | Public School | Private School |
| 3 to 4 Year Olds | 20 (100.0%) | 0 (0.0%) |
| 5 to 9 Year Old | 22 (100.0%) | 0 (0.0%) |
| 10 to 14 Year Olds | 12 (100.0%) | 0 (0.0%) |
| 15 to 17 Year Olds | 0 (0.0%) | 11 (100.0%) |
| 18 to 19 Year Olds | 0 (0.0%) | 0 (0.0%) |
| 20 to 24 Year Olds | 0 (0.0%) | 0 (0.0%) |
| 25 to 34 Year Olds | 0 (0.0%) | 0 (0.0%) |
| 35 Years and over | 12 (100.0%) | 0 (0.0%) |
| Total | 66 (85.7%) | 11 (14.3%) |
Educational Attainment by Field of Study in Glen Ellen
Business (502 | 64.0%), communications (54 | 6.9%), multidisciplinary studies (46 | 5.9%), liberal arts & history (36 | 4.6%), and social sciences (34 | 4.3%) are the most common fields of study among 784 individuals in Glen Ellen who have obtained a bachelor's degree or higher.
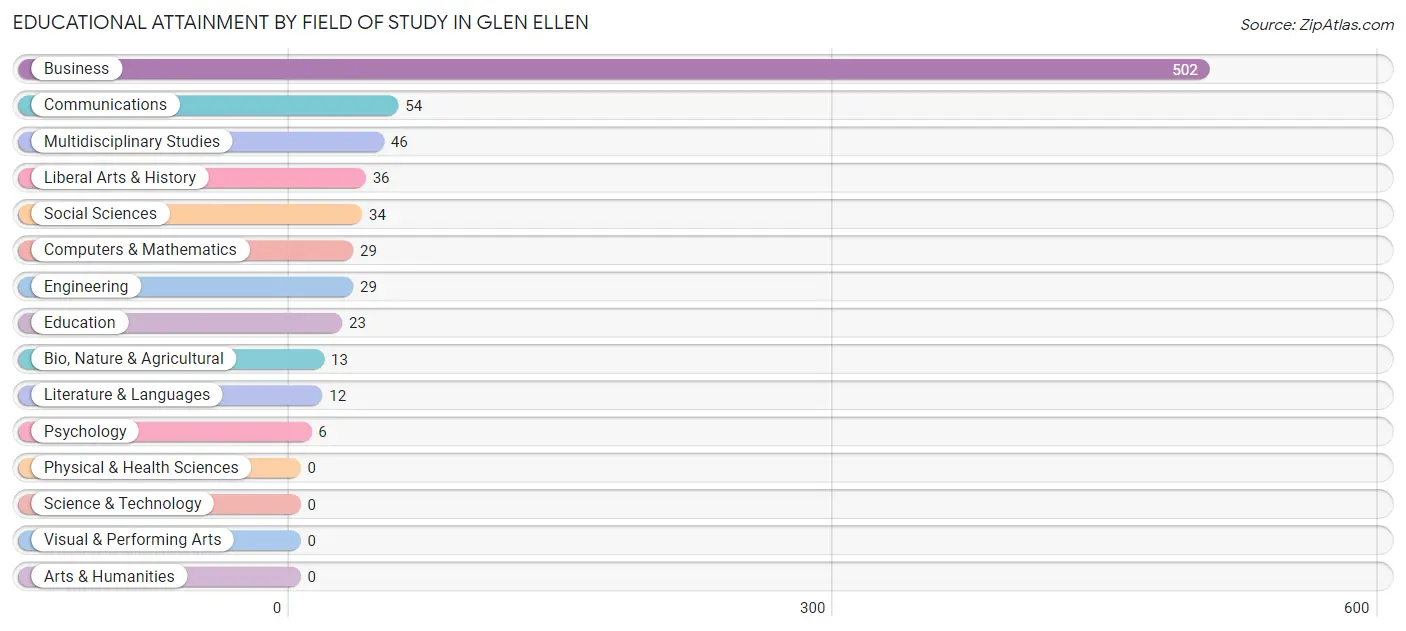
| Field of Study | # Graduates | % Graduates |
| Computers & Mathematics | 29 | 3.7% |
| Bio, Nature & Agricultural | 13 | 1.7% |
| Physical & Health Sciences | 0 | 0.0% |
| Psychology | 6 | 0.8% |
| Social Sciences | 34 | 4.3% |
| Engineering | 29 | 3.7% |
| Multidisciplinary Studies | 46 | 5.9% |
| Science & Technology | 0 | 0.0% |
| Business | 502 | 64.0% |
| Education | 23 | 2.9% |
| Literature & Languages | 12 | 1.5% |
| Liberal Arts & History | 36 | 4.6% |
| Visual & Performing Arts | 0 | 0.0% |
| Communications | 54 | 6.9% |
| Arts & Humanities | 0 | 0.0% |
| Total | 784 | 100.0% |
Transportation & Commute in Glen Ellen
Vehicle Availability by Sex in Glen Ellen
The most prevalent vehicle ownership categories in Glen Ellen are males with 1 vehicle (61, accounting for 36.7%) and females with 1 vehicle (273, making up 18.1%).
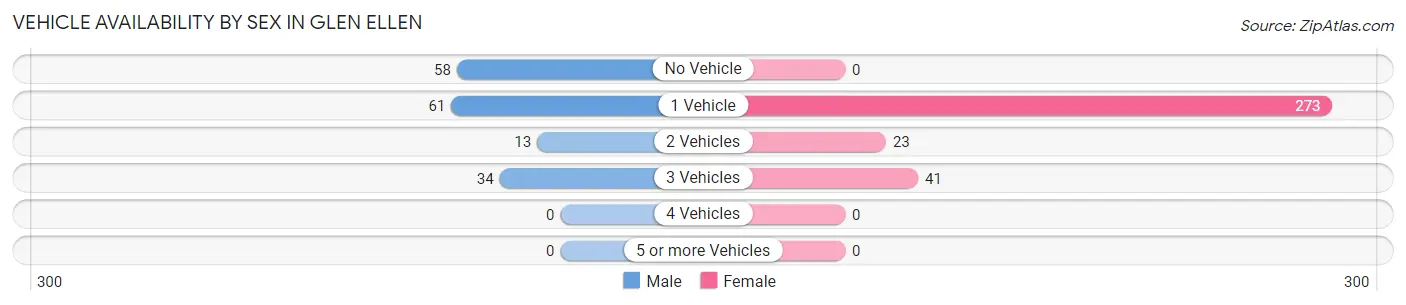
| Vehicles Available | Male | Female |
| No Vehicle | 58 (34.9%) | 0 (0.0%) |
| 1 Vehicle | 61 (36.7%) | 273 (81.0%) |
| 2 Vehicles | 13 (7.8%) | 23 (6.8%) |
| 3 Vehicles | 34 (20.5%) | 41 (12.2%) |
| 4 Vehicles | 0 (0.0%) | 0 (0.0%) |
| 5 or more Vehicles | 0 (0.0%) | 0 (0.0%) |
| Total | 166 (100.0%) | 337 (100.0%) |
Commute Time in Glen Ellen
The most frequently occuring commute durations in Glen Ellen are 5 to 9 minutes (232 commuters, 46.1%), 15 to 19 minutes (113 commuters, 22.5%), and 30 to 34 minutes (61 commuters, 12.1%).
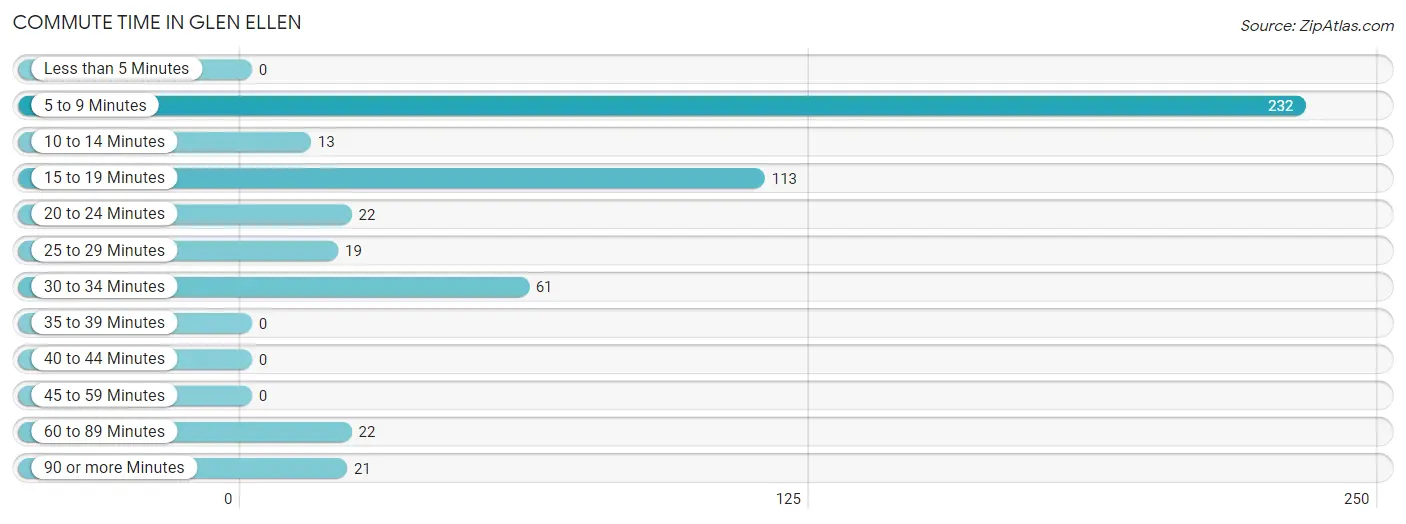
| Commute Time | # Commuters | % Commuters |
| Less than 5 Minutes | 0 | 0.0% |
| 5 to 9 Minutes | 232 | 46.1% |
| 10 to 14 Minutes | 13 | 2.6% |
| 15 to 19 Minutes | 113 | 22.5% |
| 20 to 24 Minutes | 22 | 4.4% |
| 25 to 29 Minutes | 19 | 3.8% |
| 30 to 34 Minutes | 61 | 12.1% |
| 35 to 39 Minutes | 0 | 0.0% |
| 40 to 44 Minutes | 0 | 0.0% |
| 45 to 59 Minutes | 0 | 0.0% |
| 60 to 89 Minutes | 22 | 4.4% |
| 90 or more Minutes | 21 | 4.2% |
Commute Time by Sex in Glen Ellen
The most common commute times in Glen Ellen are 30 to 34 minutes (61 commuters, 36.7%) for males and 5 to 9 minutes (232 commuters, 68.8%) for females.
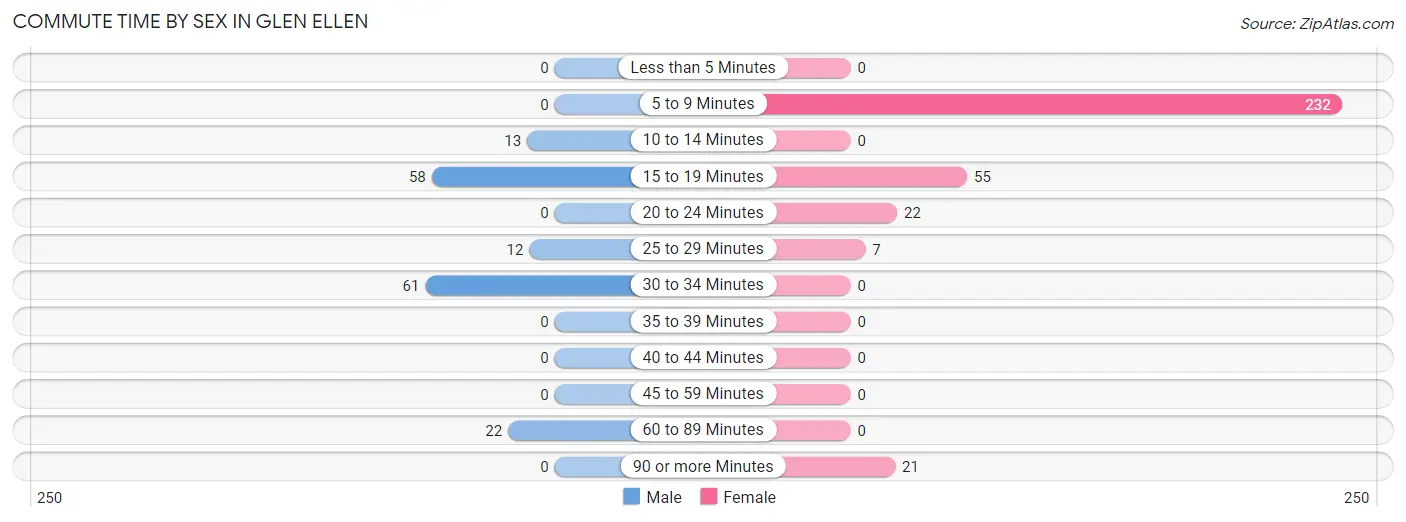
| Commute Time | Male | Female |
| Less than 5 Minutes | 0 (0.0%) | 0 (0.0%) |
| 5 to 9 Minutes | 0 (0.0%) | 232 (68.8%) |
| 10 to 14 Minutes | 13 (7.8%) | 0 (0.0%) |
| 15 to 19 Minutes | 58 (34.9%) | 55 (16.3%) |
| 20 to 24 Minutes | 0 (0.0%) | 22 (6.5%) |
| 25 to 29 Minutes | 12 (7.2%) | 7 (2.1%) |
| 30 to 34 Minutes | 61 (36.7%) | 0 (0.0%) |
| 35 to 39 Minutes | 0 (0.0%) | 0 (0.0%) |
| 40 to 44 Minutes | 0 (0.0%) | 0 (0.0%) |
| 45 to 59 Minutes | 0 (0.0%) | 0 (0.0%) |
| 60 to 89 Minutes | 22 (13.3%) | 0 (0.0%) |
| 90 or more Minutes | 0 (0.0%) | 21 (6.2%) |
Time of Departure to Work by Sex in Glen Ellen
The most frequent times of departure to work in Glen Ellen are 10:00 AM to 10:59 AM (58, 34.9%) for males and 7:00 AM to 7:29 AM (255, 75.7%) for females.
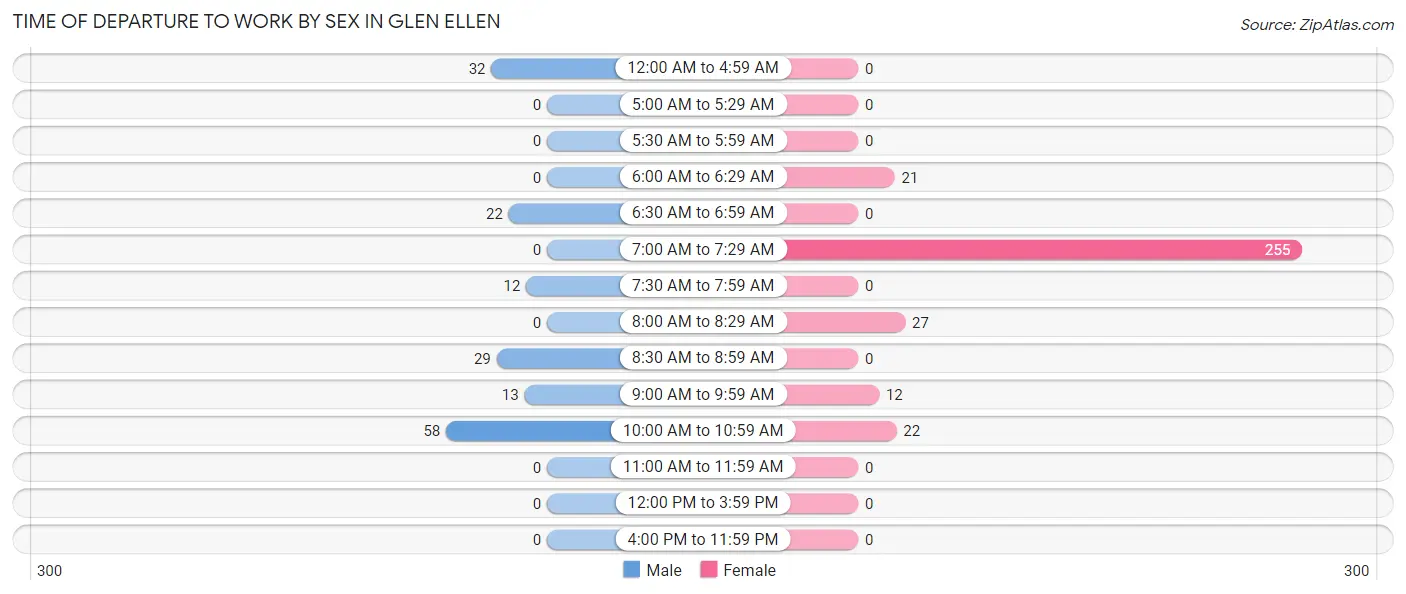
| Time of Departure | Male | Female |
| 12:00 AM to 4:59 AM | 32 (19.3%) | 0 (0.0%) |
| 5:00 AM to 5:29 AM | 0 (0.0%) | 0 (0.0%) |
| 5:30 AM to 5:59 AM | 0 (0.0%) | 0 (0.0%) |
| 6:00 AM to 6:29 AM | 0 (0.0%) | 21 (6.2%) |
| 6:30 AM to 6:59 AM | 22 (13.3%) | 0 (0.0%) |
| 7:00 AM to 7:29 AM | 0 (0.0%) | 255 (75.7%) |
| 7:30 AM to 7:59 AM | 12 (7.2%) | 0 (0.0%) |
| 8:00 AM to 8:29 AM | 0 (0.0%) | 27 (8.0%) |
| 8:30 AM to 8:59 AM | 29 (17.5%) | 0 (0.0%) |
| 9:00 AM to 9:59 AM | 13 (7.8%) | 12 (3.6%) |
| 10:00 AM to 10:59 AM | 58 (34.9%) | 22 (6.5%) |
| 11:00 AM to 11:59 AM | 0 (0.0%) | 0 (0.0%) |
| 12:00 PM to 3:59 PM | 0 (0.0%) | 0 (0.0%) |
| 4:00 PM to 11:59 PM | 0 (0.0%) | 0 (0.0%) |
| Total | 166 (100.0%) | 337 (100.0%) |
Housing Occupancy in Glen Ellen
Occupancy by Ownership in Glen Ellen
Of the total 526 dwellings in Glen Ellen, owner-occupied units account for 376 (71.5%), while renter-occupied units make up 150 (28.5%).
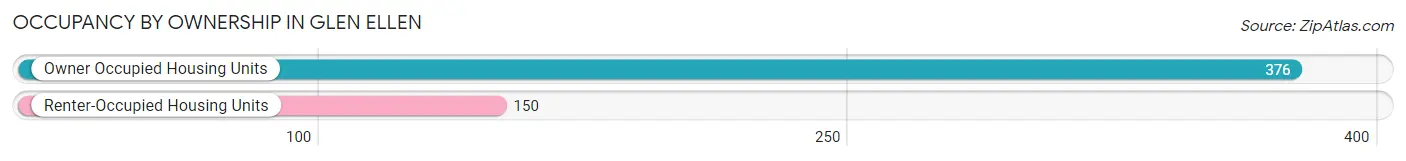
| Occupancy | # Housing Units | % Housing Units |
| Owner Occupied Housing Units | 376 | 71.5% |
| Renter-Occupied Housing Units | 150 | 28.5% |
| Total Occupied Housing Units | 526 | 100.0% |
Occupancy by Household Size in Glen Ellen
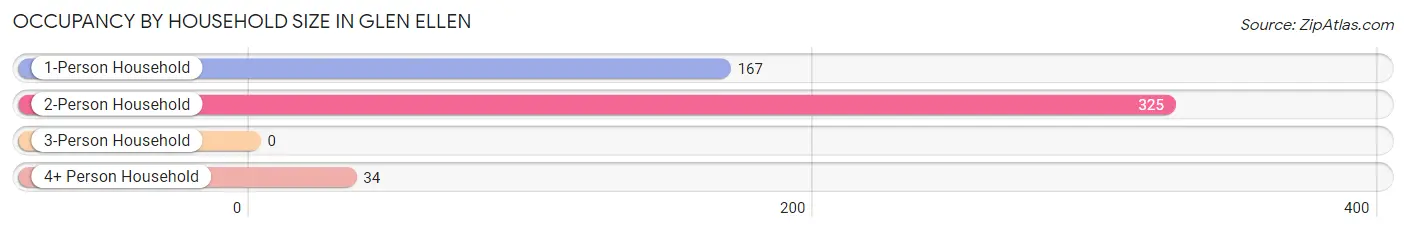
| Household Size | # Housing Units | % Housing Units |
| 1-Person Household | 167 | 31.8% |
| 2-Person Household | 325 | 61.8% |
| 3-Person Household | 0 | 0.0% |
| 4+ Person Household | 34 | 6.5% |
| Total Housing Units | 526 | 100.0% |
Occupancy by Ownership by Household Size in Glen Ellen
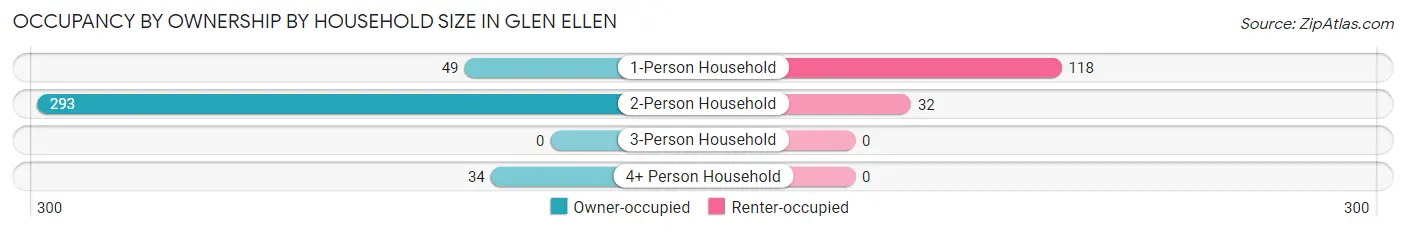
| Household Size | Owner-occupied | Renter-occupied |
| 1-Person Household | 49 (29.3%) | 118 (70.7%) |
| 2-Person Household | 293 (90.1%) | 32 (9.9%) |
| 3-Person Household | 0 (0.0%) | 0 (0.0%) |
| 4+ Person Household | 34 (100.0%) | 0 (0.0%) |
| Total Housing Units | 376 (71.5%) | 150 (28.5%) |
Occupancy by Educational Attainment in Glen Ellen
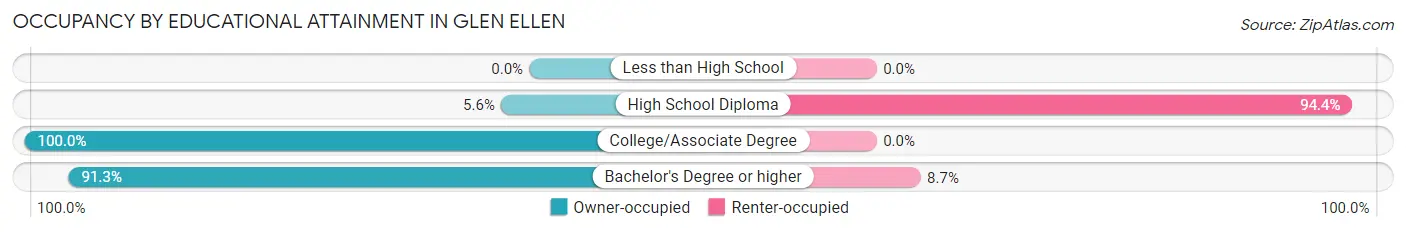
| Household Size | Owner-occupied | Renter-occupied |
| Less than High School | 0 (0.0%) | 0 (0.0%) |
| High School Diploma | 7 (5.6%) | 118 (94.4%) |
| College/Associate Degree | 34 (100.0%) | 0 (0.0%) |
| Bachelor's Degree or higher | 335 (91.3%) | 32 (8.7%) |
Occupancy by Age of Householder in Glen Ellen
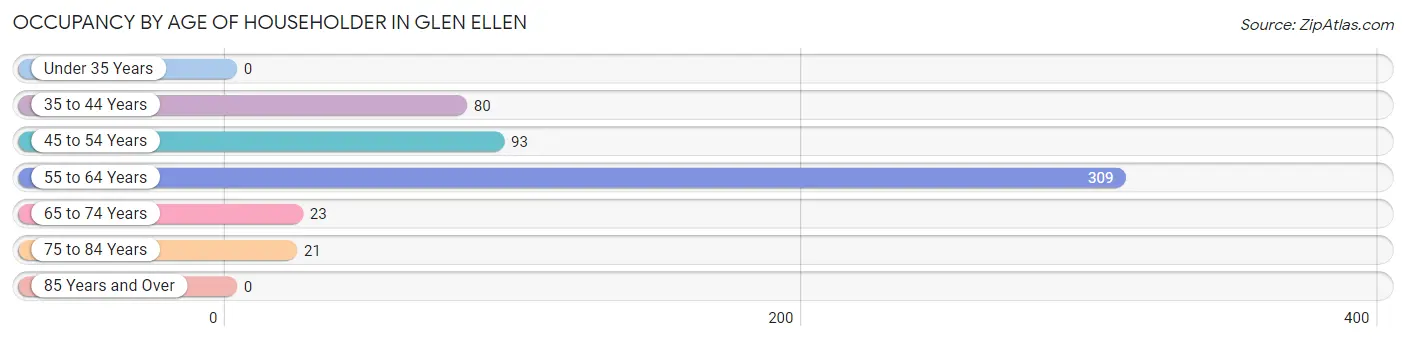
| Age Bracket | # Households | % Households |
| Under 35 Years | 0 | 0.0% |
| 35 to 44 Years | 80 | 15.2% |
| 45 to 54 Years | 93 | 17.7% |
| 55 to 64 Years | 309 | 58.8% |
| 65 to 74 Years | 23 | 4.4% |
| 75 to 84 Years | 21 | 4.0% |
| 85 Years and Over | 0 | 0.0% |
| Total | 526 | 100.0% |
Housing Finances in Glen Ellen
Median Income by Occupancy in Glen Ellen
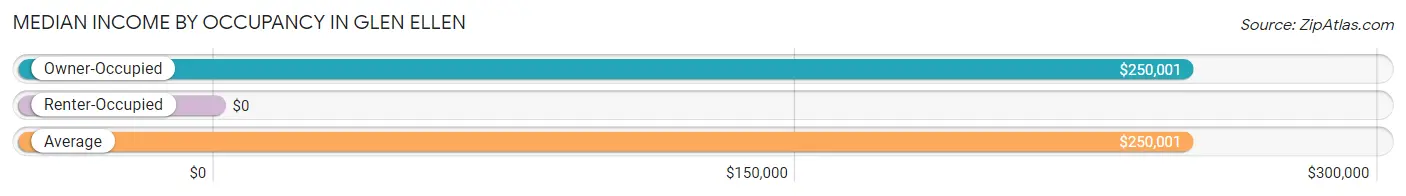
| Occupancy Type | # Households | Median Income |
| Owner-Occupied | 376 (71.5%) | $250,001 |
| Renter-Occupied | 150 (28.5%) | $0 |
| Average | 526 (100.0%) | $250,001 |
Occupancy by Householder Income Bracket in Glen Ellen
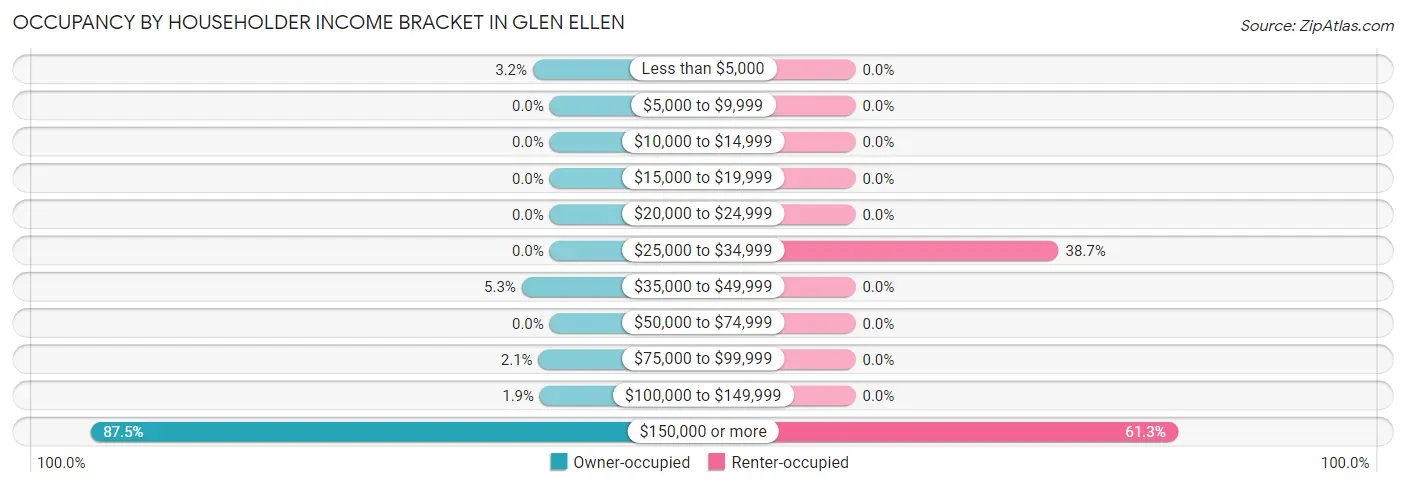
| Income Bracket | Owner-occupied | Renter-occupied |
| Less than $5,000 | 12 (3.2%) | 0 (0.0%) |
| $5,000 to $9,999 | 0 (0.0%) | 0 (0.0%) |
| $10,000 to $14,999 | 0 (0.0%) | 0 (0.0%) |
| $15,000 to $19,999 | 0 (0.0%) | 0 (0.0%) |
| $20,000 to $24,999 | 0 (0.0%) | 0 (0.0%) |
| $25,000 to $34,999 | 0 (0.0%) | 58 (38.7%) |
| $35,000 to $49,999 | 20 (5.3%) | 0 (0.0%) |
| $50,000 to $74,999 | 0 (0.0%) | 0 (0.0%) |
| $75,000 to $99,999 | 8 (2.1%) | 0 (0.0%) |
| $100,000 to $149,999 | 7 (1.9%) | 0 (0.0%) |
| $150,000 or more | 329 (87.5%) | 92 (61.3%) |
| Total | 376 (100.0%) | 150 (100.0%) |
Monthly Housing Cost Tiers in Glen Ellen
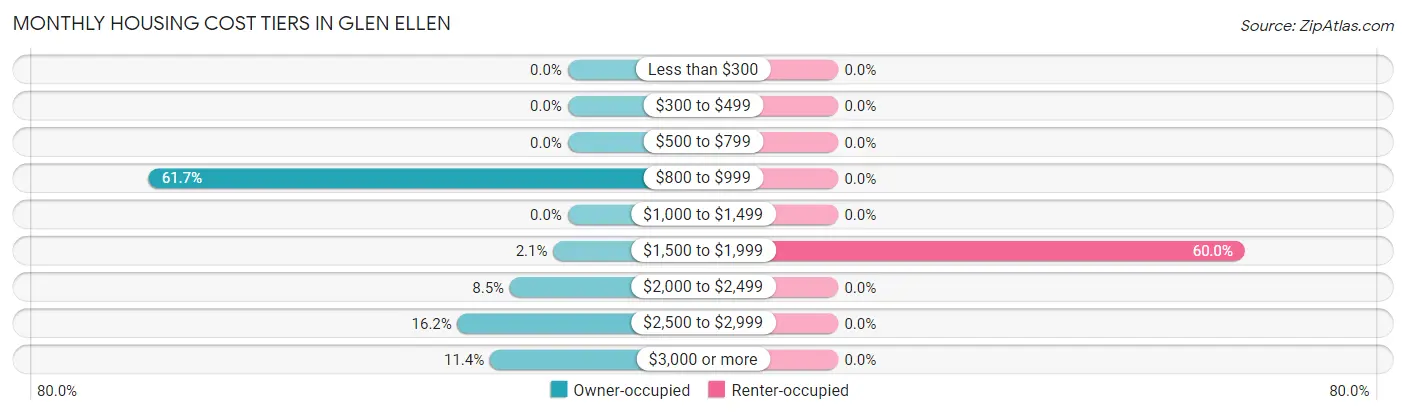
| Monthly Cost | Owner-occupied | Renter-occupied |
| Less than $300 | 0 (0.0%) | 0 (0.0%) |
| $300 to $499 | 0 (0.0%) | 0 (0.0%) |
| $500 to $799 | 0 (0.0%) | 0 (0.0%) |
| $800 to $999 | 232 (61.7%) | 0 (0.0%) |
| $1,000 to $1,499 | 0 (0.0%) | 0 (0.0%) |
| $1,500 to $1,999 | 8 (2.1%) | 90 (60.0%) |
| $2,000 to $2,499 | 32 (8.5%) | 0 (0.0%) |
| $2,500 to $2,999 | 61 (16.2%) | 0 (0.0%) |
| $3,000 or more | 43 (11.4%) | 0 (0.0%) |
| Total | 376 (100.0%) | 150 (100.0%) |
Physical Housing Characteristics in Glen Ellen
Housing Structures in Glen Ellen
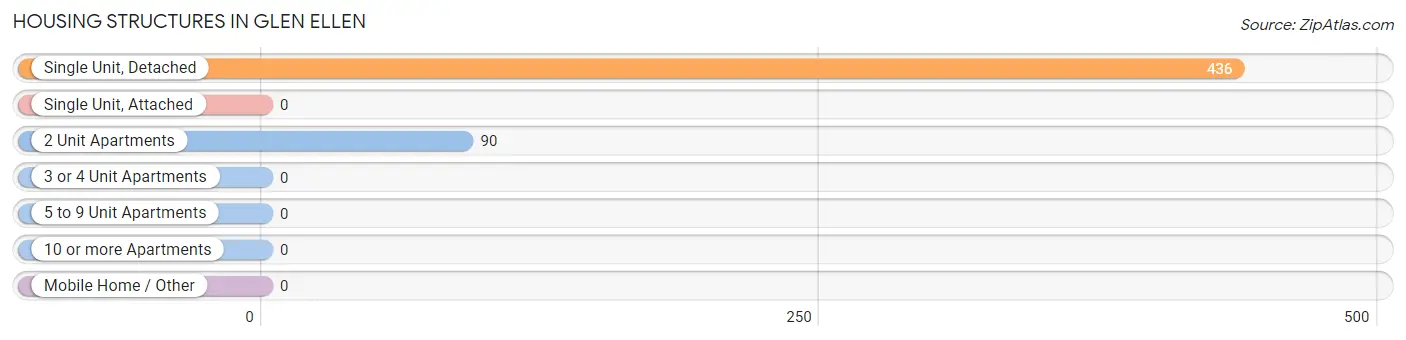
| Structure Type | # Housing Units | % Housing Units |
| Single Unit, Detached | 436 | 82.9% |
| Single Unit, Attached | 0 | 0.0% |
| 2 Unit Apartments | 90 | 17.1% |
| 3 or 4 Unit Apartments | 0 | 0.0% |
| 5 to 9 Unit Apartments | 0 | 0.0% |
| 10 or more Apartments | 0 | 0.0% |
| Mobile Home / Other | 0 | 0.0% |
| Total | 526 | 100.0% |
Housing Structures by Occupancy in Glen Ellen
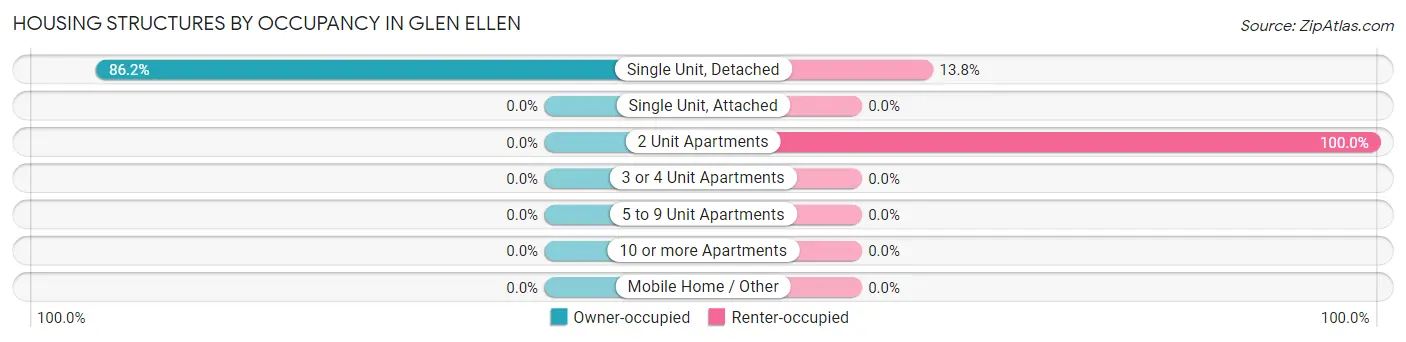
| Structure Type | Owner-occupied | Renter-occupied |
| Single Unit, Detached | 376 (86.2%) | 60 (13.8%) |
| Single Unit, Attached | 0 (0.0%) | 0 (0.0%) |
| 2 Unit Apartments | 0 (0.0%) | 90 (100.0%) |
| 3 or 4 Unit Apartments | 0 (0.0%) | 0 (0.0%) |
| 5 to 9 Unit Apartments | 0 (0.0%) | 0 (0.0%) |
| 10 or more Apartments | 0 (0.0%) | 0 (0.0%) |
| Mobile Home / Other | 0 (0.0%) | 0 (0.0%) |
| Total | 376 (71.5%) | 150 (28.5%) |
Housing Structures by Number of Rooms in Glen Ellen
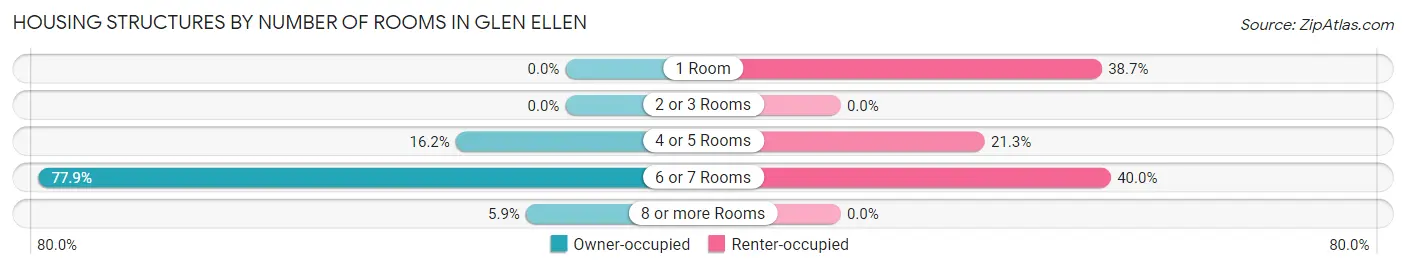
| Number of Rooms | Owner-occupied | Renter-occupied |
| 1 Room | 0 (0.0%) | 58 (38.7%) |
| 2 or 3 Rooms | 0 (0.0%) | 0 (0.0%) |
| 4 or 5 Rooms | 61 (16.2%) | 32 (21.3%) |
| 6 or 7 Rooms | 293 (77.9%) | 60 (40.0%) |
| 8 or more Rooms | 22 (5.9%) | 0 (0.0%) |
| Total | 376 (100.0%) | 150 (100.0%) |
Housing Structure by Heating Type in Glen Ellen
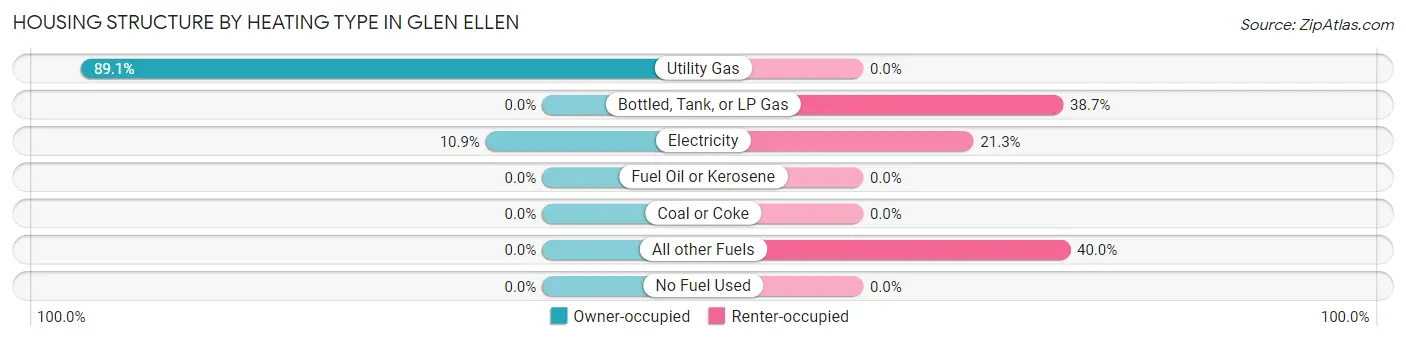
| Heating Type | Owner-occupied | Renter-occupied |
| Utility Gas | 335 (89.1%) | 0 (0.0%) |
| Bottled, Tank, or LP Gas | 0 (0.0%) | 58 (38.7%) |
| Electricity | 41 (10.9%) | 32 (21.3%) |
| Fuel Oil or Kerosene | 0 (0.0%) | 0 (0.0%) |
| Coal or Coke | 0 (0.0%) | 0 (0.0%) |
| All other Fuels | 0 (0.0%) | 60 (40.0%) |
| No Fuel Used | 0 (0.0%) | 0 (0.0%) |
| Total | 376 (100.0%) | 150 (100.0%) |
Household Vehicle Usage in Glen Ellen
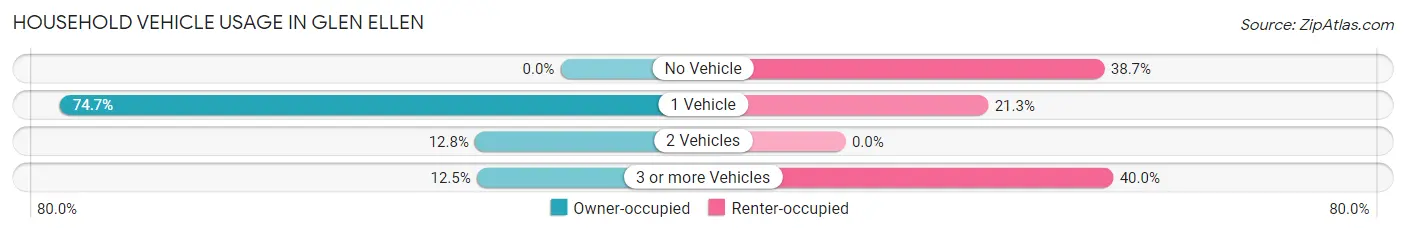
| Vehicles per Household | Owner-occupied | Renter-occupied |
| No Vehicle | 0 (0.0%) | 58 (38.7%) |
| 1 Vehicle | 281 (74.7%) | 32 (21.3%) |
| 2 Vehicles | 48 (12.8%) | 0 (0.0%) |
| 3 or more Vehicles | 47 (12.5%) | 60 (40.0%) |
| Total | 376 (100.0%) | 150 (100.0%) |
Real Estate & Mortgages in Glen Ellen
Real Estate and Mortgage Overview in Glen Ellen
| Characteristic | Without Mortgage | With Mortgage |
| Housing Units | 253 | 123 |
| Median Property Value | $1,386,300 | $1,351,700 |
| Median Household Income | $250,001 | $84 |
| Monthly Housing Costs | $955 | $43 |
| Real Estate Taxes | $8,863 | $0 |
Property Value by Mortgage Status in Glen Ellen
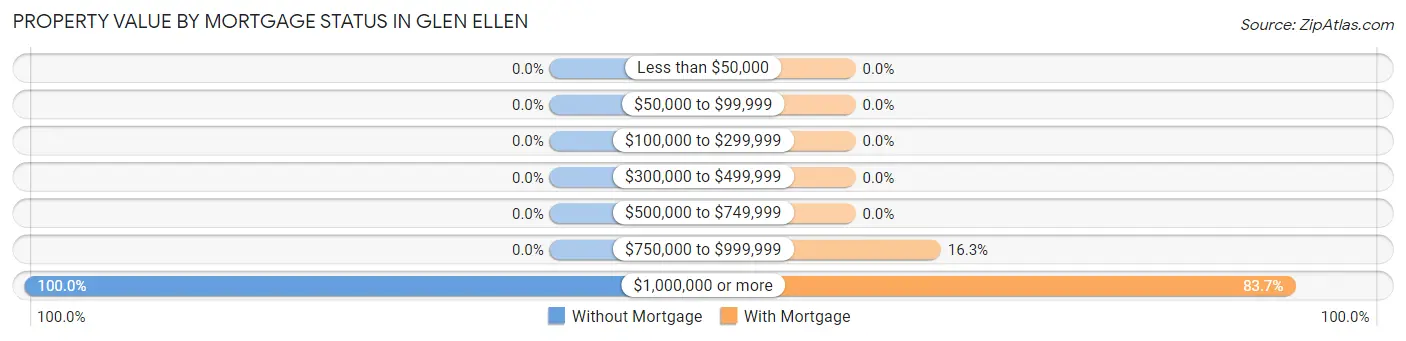
| Property Value | Without Mortgage | With Mortgage |
| Less than $50,000 | 0 (0.0%) | 0 (0.0%) |
| $50,000 to $99,999 | 0 (0.0%) | 0 (0.0%) |
| $100,000 to $299,999 | 0 (0.0%) | 0 (0.0%) |
| $300,000 to $499,999 | 0 (0.0%) | 0 (0.0%) |
| $500,000 to $749,999 | 0 (0.0%) | 0 (0.0%) |
| $750,000 to $999,999 | 0 (0.0%) | 20 (16.3%) |
| $1,000,000 or more | 253 (100.0%) | 103 (83.7%) |
| Total | 253 (100.0%) | 123 (100.0%) |
Household Income by Mortgage Status in Glen Ellen
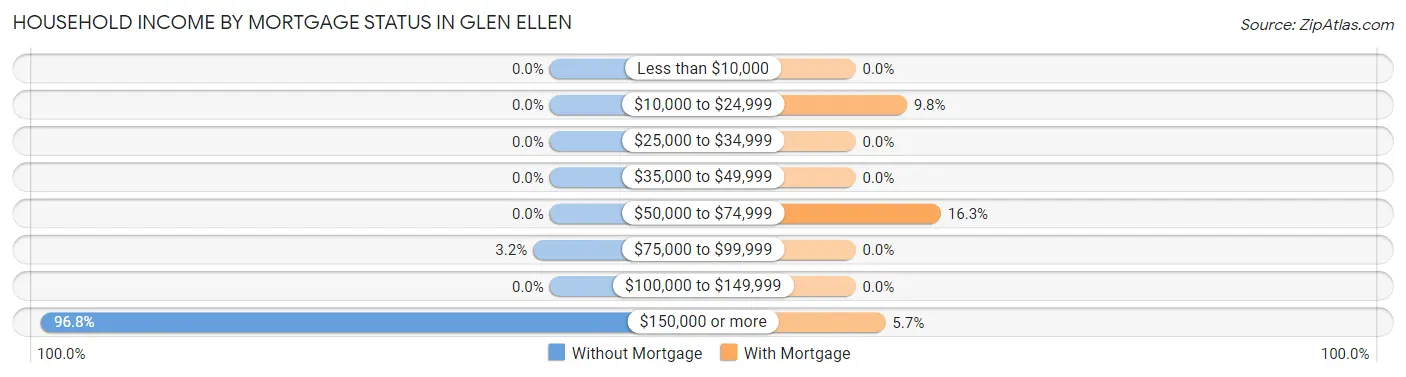
| Household Income | Without Mortgage | With Mortgage |
| Less than $10,000 | 0 (0.0%) | 0 (0.0%) |
| $10,000 to $24,999 | 0 (0.0%) | 12 (9.8%) |
| $25,000 to $34,999 | 0 (0.0%) | 0 (0.0%) |
| $35,000 to $49,999 | 0 (0.0%) | 0 (0.0%) |
| $50,000 to $74,999 | 0 (0.0%) | 20 (16.3%) |
| $75,000 to $99,999 | 8 (3.2%) | 0 (0.0%) |
| $100,000 to $149,999 | 0 (0.0%) | 0 (0.0%) |
| $150,000 or more | 245 (96.8%) | 7 (5.7%) |
| Total | 253 (100.0%) | 123 (100.0%) |
Property Value to Household Income Ratio in Glen Ellen
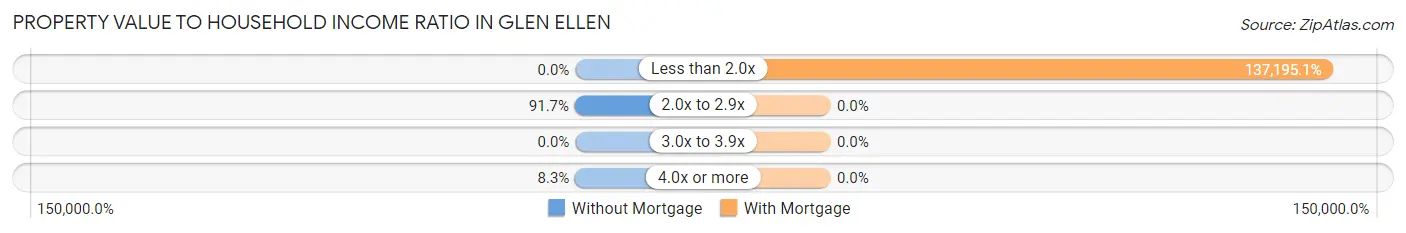
| Value-to-Income Ratio | Without Mortgage | With Mortgage |
| Less than 2.0x | 0 (0.0%) | 168,750 (137,195.1%) |
| 2.0x to 2.9x | 232 (91.7%) | 0 (0.0%) |
| 3.0x to 3.9x | 0 (0.0%) | 0 (0.0%) |
| 4.0x or more | 21 (8.3%) | 0 (0.0%) |
| Total | 253 (100.0%) | 123 (100.0%) |
Real Estate Taxes by Mortgage Status in Glen Ellen
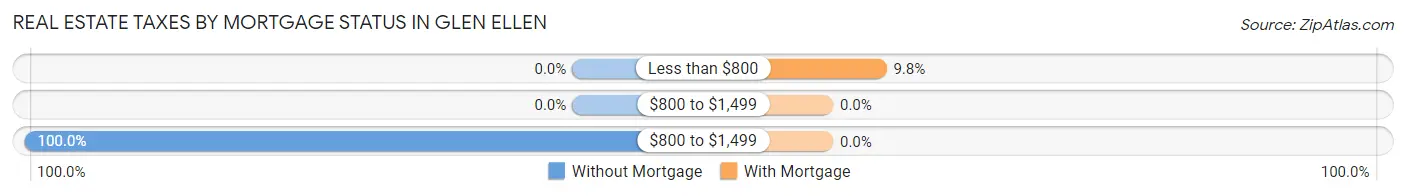
| Property Taxes | Without Mortgage | With Mortgage |
| Less than $800 | 0 (0.0%) | 12 (9.8%) |
| $800 to $1,499 | 0 (0.0%) | 0 (0.0%) |
| $800 to $1,499 | 253 (100.0%) | 0 (0.0%) |
| Total | 253 (100.0%) | 123 (100.0%) |
Health & Disability in Glen Ellen
Health Insurance Coverage by Age in Glen Ellen
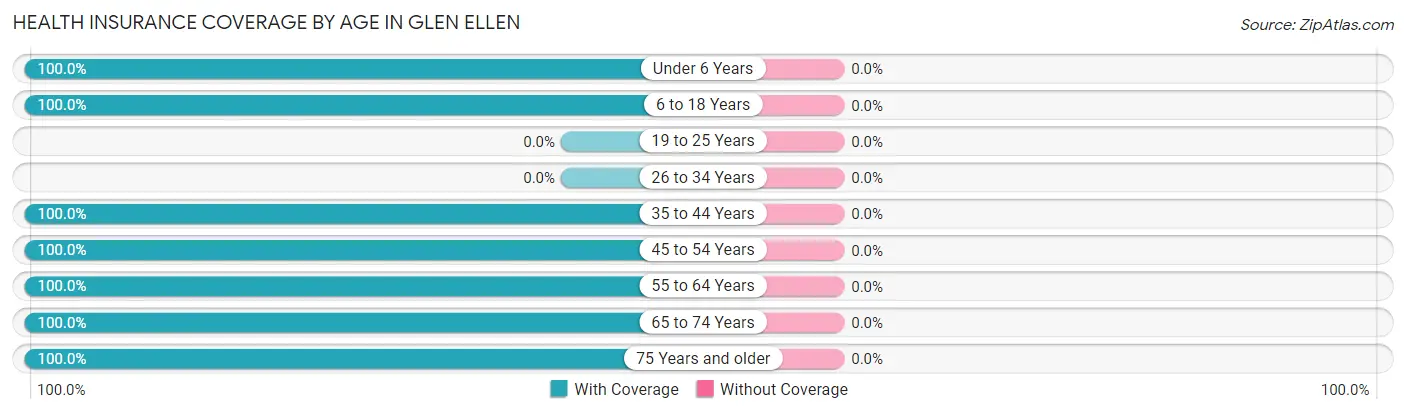
| Age Bracket | With Coverage | Without Coverage |
| Under 6 Years | 20 (100.0%) | 0 (0.0%) |
| 6 to 18 Years | 45 (100.0%) | 0 (0.0%) |
| 19 to 25 Years | 0 (0.0%) | 0 (0.0%) |
| 26 to 34 Years | 0 (0.0%) | 0 (0.0%) |
| 35 to 44 Years | 102 (100.0%) | 0 (0.0%) |
| 45 to 54 Years | 105 (100.0%) | 0 (0.0%) |
| 55 to 64 Years | 608 (100.0%) | 0 (0.0%) |
| 65 to 74 Years | 97 (100.0%) | 0 (0.0%) |
| 75 Years and older | 21 (100.0%) | 0 (0.0%) |
| Total | 998 (100.0%) | 0 (0.0%) |
Health Insurance Coverage by Citizenship Status in Glen Ellen
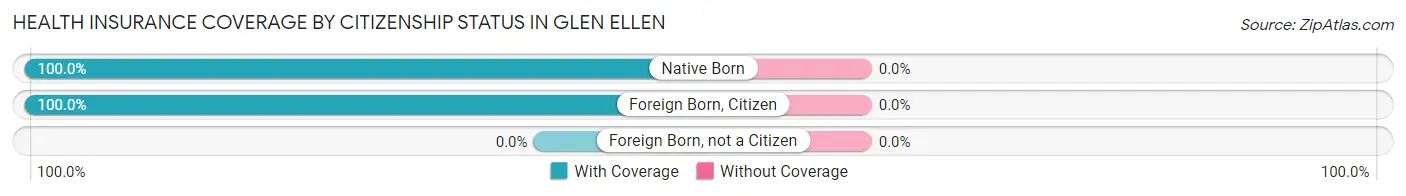
| Citizenship Status | With Coverage | Without Coverage |
| Native Born | 20 (100.0%) | 0 (0.0%) |
| Foreign Born, Citizen | 45 (100.0%) | 0 (0.0%) |
| Foreign Born, not a Citizen | 0 (0.0%) | 0 (0.0%) |
Health Insurance Coverage by Household Income in Glen Ellen
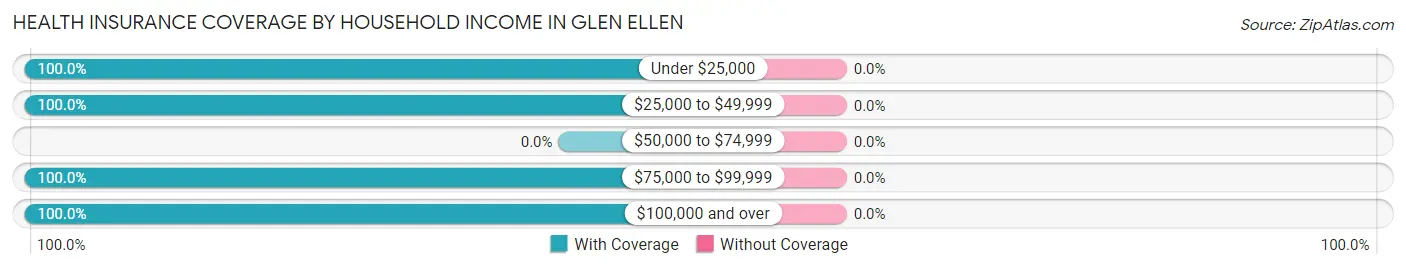
| Household Income | With Coverage | Without Coverage |
| Under $25,000 | 24 (100.0%) | 0 (0.0%) |
| $25,000 to $49,999 | 78 (100.0%) | 0 (0.0%) |
| $50,000 to $74,999 | 0 (0.0%) | 0 (0.0%) |
| $75,000 to $99,999 | 8 (100.0%) | 0 (0.0%) |
| $100,000 and over | 888 (100.0%) | 0 (0.0%) |
Public vs Private Health Insurance Coverage by Age in Glen Ellen
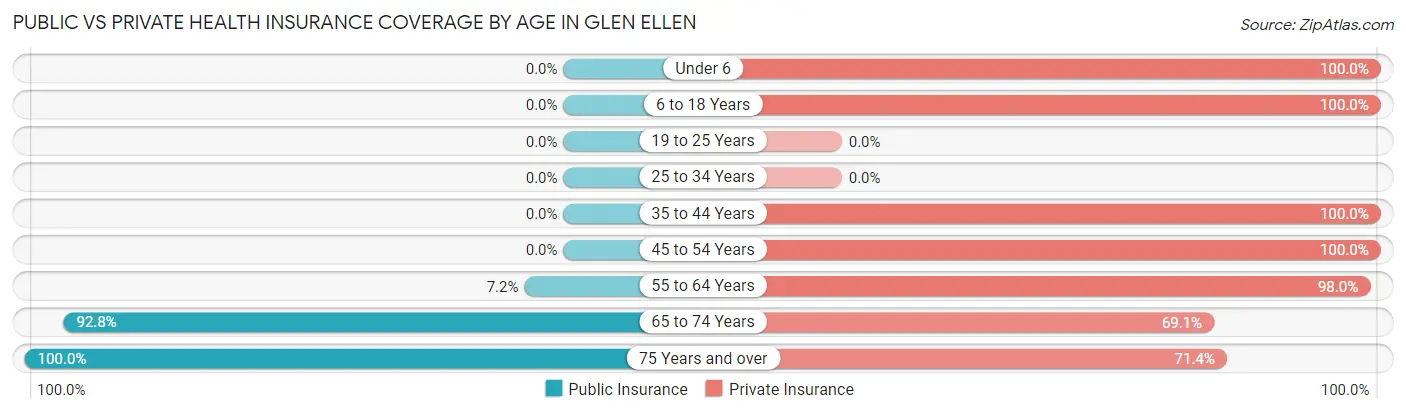
| Age Bracket | Public Insurance | Private Insurance |
| Under 6 | 0 (0.0%) | 20 (100.0%) |
| 6 to 18 Years | 0 (0.0%) | 45 (100.0%) |
| 19 to 25 Years | 0 (0.0%) | 0 (0.0%) |
| 25 to 34 Years | 0 (0.0%) | 0 (0.0%) |
| 35 to 44 Years | 0 (0.0%) | 102 (100.0%) |
| 45 to 54 Years | 0 (0.0%) | 105 (100.0%) |
| 55 to 64 Years | 44 (7.2%) | 596 (98.0%) |
| 65 to 74 Years | 90 (92.8%) | 67 (69.1%) |
| 75 Years and over | 21 (100.0%) | 15 (71.4%) |
| Total | 155 (15.5%) | 950 (95.2%) |
Disability Status by Sex by Age in Glen Ellen

| Age Bracket | Male | Female |
| Under 5 Years | 0 (0.0%) | 0 (0.0%) |
| 5 to 17 Years | 0 (0.0%) | 0 (0.0%) |
| 18 to 34 Years | 0 (0.0%) | 0 (0.0%) |
| 35 to 64 Years | 0 (0.0%) | 20 (6.0%) |
| 65 to 74 Years | 0 (0.0%) | 0 (0.0%) |
| 75 Years and over | 7 (53.8%) | 0 (0.0%) |
Disability Class by Sex by Age in Glen Ellen
Disability Class: Hearing Difficulty
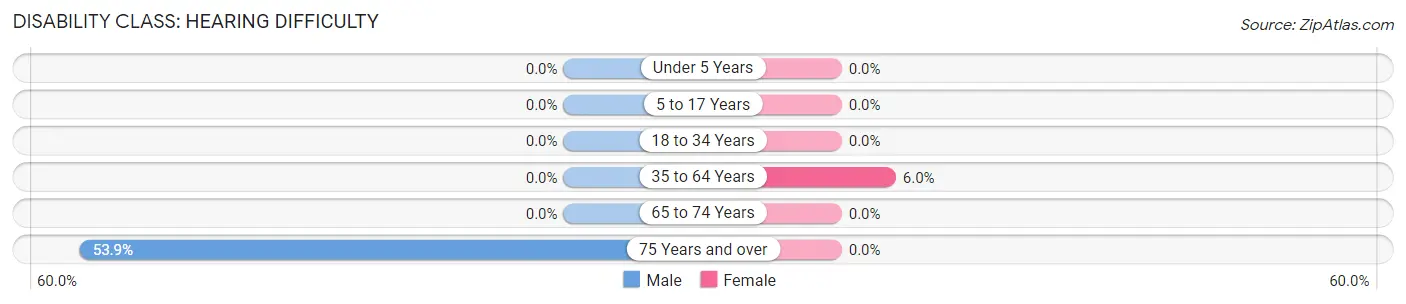
| Age Bracket | Male | Female |
| Under 5 Years | 0 (0.0%) | 0 (0.0%) |
| 5 to 17 Years | 0 (0.0%) | 0 (0.0%) |
| 18 to 34 Years | 0 (0.0%) | 0 (0.0%) |
| 35 to 64 Years | 0 (0.0%) | 20 (6.0%) |
| 65 to 74 Years | 0 (0.0%) | 0 (0.0%) |
| 75 Years and over | 7 (53.8%) | 0 (0.0%) |
Disability Class: Vision Difficulty
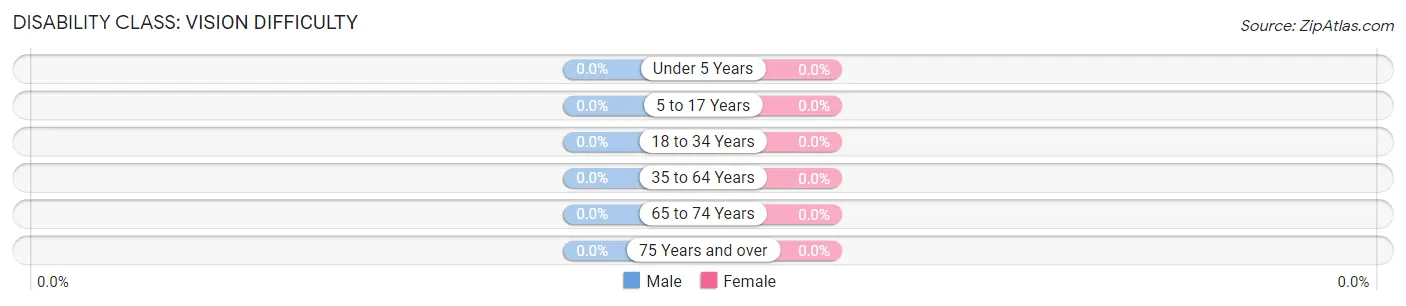
| Age Bracket | Male | Female |
| Under 5 Years | 0 (0.0%) | 0 (0.0%) |
| 5 to 17 Years | 0 (0.0%) | 0 (0.0%) |
| 18 to 34 Years | 0 (0.0%) | 0 (0.0%) |
| 35 to 64 Years | 0 (0.0%) | 0 (0.0%) |
| 65 to 74 Years | 0 (0.0%) | 0 (0.0%) |
| 75 Years and over | 0 (0.0%) | 0 (0.0%) |
Disability Class: Cognitive Difficulty
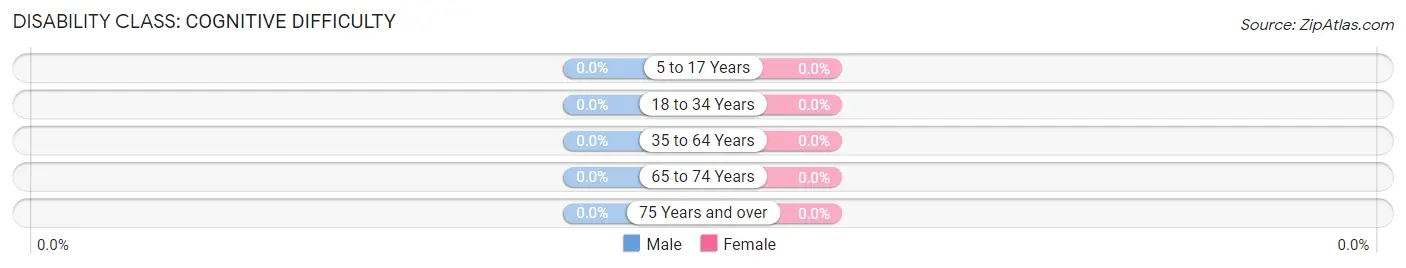
| Age Bracket | Male | Female |
| 5 to 17 Years | 0 (0.0%) | 0 (0.0%) |
| 18 to 34 Years | 0 (0.0%) | 0 (0.0%) |
| 35 to 64 Years | 0 (0.0%) | 0 (0.0%) |
| 65 to 74 Years | 0 (0.0%) | 0 (0.0%) |
| 75 Years and over | 0 (0.0%) | 0 (0.0%) |
Disability Class: Ambulatory Difficulty
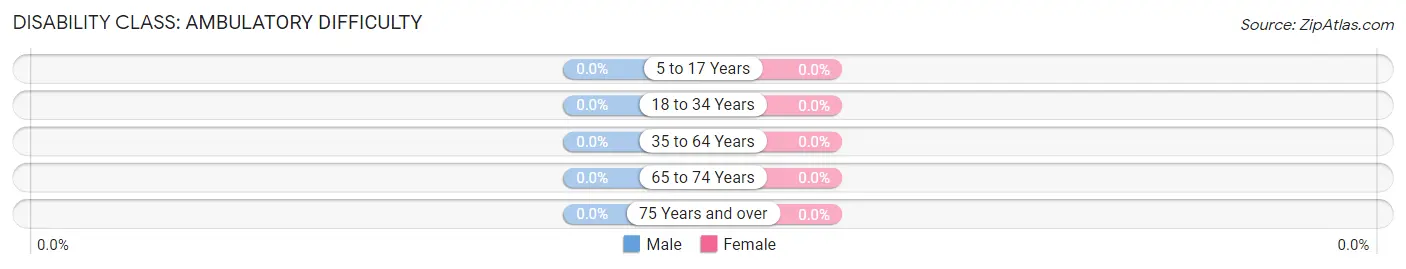
| Age Bracket | Male | Female |
| 5 to 17 Years | 0 (0.0%) | 0 (0.0%) |
| 18 to 34 Years | 0 (0.0%) | 0 (0.0%) |
| 35 to 64 Years | 0 (0.0%) | 0 (0.0%) |
| 65 to 74 Years | 0 (0.0%) | 0 (0.0%) |
| 75 Years and over | 0 (0.0%) | 0 (0.0%) |
Disability Class: Self-Care Difficulty
| Age Bracket | Male | Female |
| 5 to 17 Years | 0 (0.0%) | 0 (0.0%) |
| 18 to 34 Years | 0 (0.0%) | 0 (0.0%) |
| 35 to 64 Years | 0 (0.0%) | 0 (0.0%) |
| 65 to 74 Years | 0 (0.0%) | 0 (0.0%) |
| 75 Years and over | 0 (0.0%) | 0 (0.0%) |
Technology Access in Glen Ellen
Computing Device Access in Glen Ellen
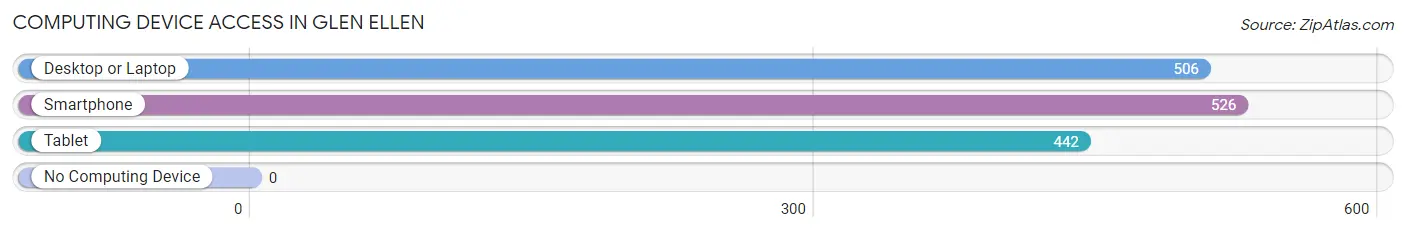
| Device Type | # Households | % Households |
| Desktop or Laptop | 506 | 96.2% |
| Smartphone | 526 | 100.0% |
| Tablet | 442 | 84.0% |
| No Computing Device | 0 | 0.0% |
| Total | 526 | 100.0% |
Internet Access in Glen Ellen
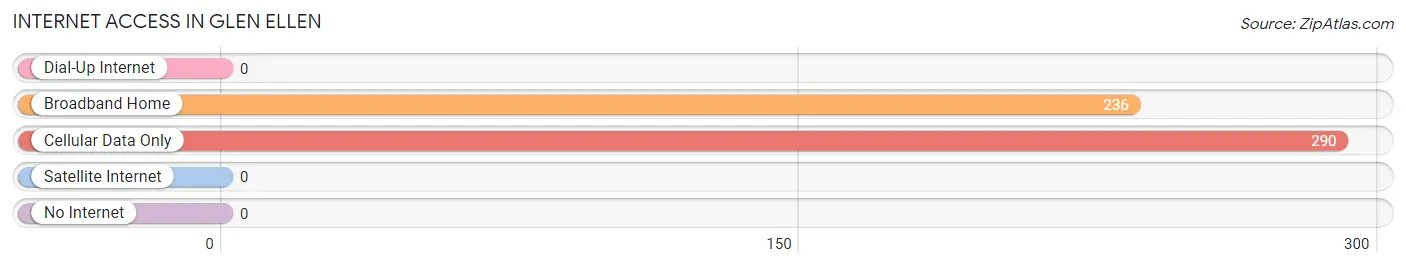
| Internet Type | # Households | % Households |
| Dial-Up Internet | 0 | 0.0% |
| Broadband Home | 236 | 44.9% |
| Cellular Data Only | 290 | 55.1% |
| Satellite Internet | 0 | 0.0% |
| No Internet | 0 | 0.0% |
| Total | 526 | 100.0% |
Glen Ellen Summary
Glen Ellen is a small unincorporated community located in Sonoma County, California. It is situated in the Sonoma Valley, approximately 8 miles north of the city of Sonoma and about 50 miles north of San Francisco. The population of Glen Ellen was estimated to be 845 in the year 2000.
History
Glen Ellen was originally inhabited by the Coast Miwok Native Americans. The first European settlers arrived in the area in the early 19th century. The town was founded in 1854 by a man named John Thomas Reed, who named it after his wife Ellen. The town was initially a small farming community, but it soon became a popular tourist destination due to its proximity to the nearby Sonoma Valley wineries.
In the late 19th century, Glen Ellen was home to a number of famous writers and artists, including Jack London, who wrote many of his famous works while living in the area. The town was also home to the famous writer and naturalist John Muir, who wrote extensively about the area’s natural beauty.
Geography
Glen Ellen is located in the Sonoma Valley, which is part of the larger North Bay region of the San Francisco Bay Area. The town is situated at the base of the Mayacamas Mountains, which form the eastern boundary of the Sonoma Valley. The town is surrounded by vineyards and rolling hills, and is known for its picturesque scenery.
The climate in Glen Ellen is Mediterranean, with warm, dry summers and mild, wet winters. The average annual temperature is around 60°F (15°C). The average annual precipitation is around 24 inches (610 mm).
Economy
The economy of Glen Ellen is largely based on tourism and agriculture. The town is home to a number of wineries and vineyards, which attract visitors from all over the world. The town is also home to a number of small businesses, including restaurants, shops, and art galleries.
Demographics
The population of Glen Ellen was estimated to be 845 in the year 2000. The racial makeup of the town was 87.3% White, 0.6% African American, 0.6% Native American, 0.9% Asian, 0.1% Pacific Islander, 8.2% from other races, and 2.3% from two or more races. Hispanic or Latino of any race were 16.2% of the population.
The median income for a household in Glen Ellen was $50,000, and the median income for a family was $60,000. The per capita income for the town was $25,000. About 8.2% of families and 11.2% of the population were below the poverty line, including 15.2% of those under age 18 and 4.2% of those age 65 or over.
Common Questions
What is Per Capita Income in Glen Ellen?
Per Capita income in Glen Ellen is $205,652.
What is the Median Family Income in Glen Ellen?
Median Family Income in Glen Ellen is $202,557.
What is the Median Household income in Glen Ellen?
Median Household Income in Glen Ellen is $250,001.
What is Inequality or Gini Index in Glen Ellen?
Inequality or Gini Index in Glen Ellen is 0.38.
What is the Total Population of Glen Ellen?
Total Population of Glen Ellen is 998.
What is the Total Male Population of Glen Ellen?
Total Male Population of Glen Ellen is 586.
What is the Total Female Population of Glen Ellen?
Total Female Population of Glen Ellen is 412.
What is the Ratio of Males per 100 Females in Glen Ellen?
There are 142.23 Males per 100 Females in Glen Ellen.
What is the Ratio of Females per 100 Males in Glen Ellen?
There are 70.31 Females per 100 Males in Glen Ellen.
What is the Median Population Age in Glen Ellen?
Median Population Age in Glen Ellen is 57.8 Years.
What is the Average Family Size in Glen Ellen
Average Family Size in Glen Ellen is 2.7 People.
What is the Average Household Size in Glen Ellen
Average Household Size in Glen Ellen is 1.9 People.
How Large is the Labor Force in Glen Ellen?
There are 527 People in the Labor Forcein in Glen Ellen.
What is the Percentage of People in the Labor Force in Glen Ellen?
55.8% of People are in the Labor Force in Glen Ellen.
What is the Unemployment Rate in Glen Ellen?
Unemployment Rate in Glen Ellen is 4.6%.